IX. COMMUNICATION RESEARCH A. MULTIPATH TRANSMISSION Prof. L. B. Arguimbau E. P. Brandeau J. Granlund H. E. Singleton
Speech and Music
a. Laboratory model of ionosphere
W. L. Hatton D. A. Kemper R. A. Paananen
In summarizing the field results we have come to believe that when distortion was evident during any particular interval of time it occurred in sharp pulses whenever the main signal path had particular frequencies; for example, at 25. 93, 25. 95, 25. 97, 25. 99, 26.01, 26.03, 26.05, and 26.07 Mc. At these selective fading frequencies correspond-ing to phase opposition of two components of a split path, the split path might lose control momentarily and a second path take over. The situation is illustrated in Fig. IX-I. At times when the frequency of the main (split) path passes through the
l
/'
i::t-_;
/~
8 ,/ SECONDARY cr PATH LL II - - - -~"\c_-'~r'____lI7T
TIMEFig. IX-I Nature of remaining trouble in field tests.
phase opposition frequencies f l' f 2' and f3, the amplitude of the main path drops
momentarily below that of the other principal path and instantaneous frequency shifts to that of the secondary path. The result with sinusoidal modulation sounds like typical harmonic distortion.
In case the signal is nonperiodic, as in speech and music, the jumps occur in a some-what random fashion and to the ear the disturbance sounds more like random noise and static than like harmonic distortion.
We have recently set up in the laboratory a three-path model consisting of a direct path and two mercury delay lines of about 500 fJ.sec delay, variable by a few percent. If we adjust the two lines to give very nearly equal attenuation and then have the undelayed signal of smaller amplitude, we get results that are very much like those of Fig. IX-l found in our tests. We are now proceeding to try to remove the noise by clipping it out, as discussed later in this report. We are also trying the effect of audio compression on the over-all results.
L. B. Arguimbau, J. Granlund, R. A. Paananen
-39-b. Noise-reducing circuit
As mentioned above, an attempt is being made to design equipment which will repair the audio frequency wave. The general idea is to make use of large radio frequency spikes which occur just before the interfering wave takes over, to obtain trigger pulses which are used to gate the interference out and to substitute a sawtooth wave in its place. The sawtooth is to have an initial value equal to the value of the signal just prior to trig-gering, and during the interference interval is to have a constant slope equal to the slope of the signal just before triggering. The large r-f spike which occurs at the end of the interference interval is used to gate the desired signal back in. A preliminary design of equipment for accomplishing the required switching is now being tested with the labora-tory model of the ionosphere. H. E. Singleton, D. A. Kemper
c. High -frequency limiter
In the Quarterly Progress Report of Jan. 15, 1950, page 54, a method was outlined whereby the limiting action of crystal diodes could be computed. It was hoped that this method would apply for frequencies as high as 30 Mc.
lIJ Cl 7 ~ Ul ~ 6 o
...
o 5 Ul ~ §? 4 .... ~ 3a
fo = 184mc - - - 3 I V2VBIAS ~-~-- ~-~-- MEASURED VALUES - - - CALCULATED VALUES _ 1 - = 184mc 2'ITfLC R lonk = 500 ohms Clank • 25f1-fLfFig. IX-2 High-frequency limiter circuit.
INPUT VOLTS
Fig. IX-3 Limiter performance.
A two-stage limiter operating at 184 Me has been built with crystal diodes, as shown in Fig. IX-2. The measured output voltage for the first stage as a function of input volt-age and various crystal biases is shown by the solid-line curves of Fig. IX-3. Plotted along with these measured values are the values computed by the method referred to.
The difference between the measured and computed voltages is less than the prob-able experimental error, but there seems to be some indication of a small lead
(IX. COMMUNICATION RESEARCH)
B. STATISTICAL THEORY OF COMMUNICATION
Prof. J. B. Wiesner F. K. Bennett B. Howland
Prof. W. B. Davenport, Jr. B. A. Basore L. G. Kraft
Prof. R. M. Fano J. J. Bussgang A. J. Lephakis
Prof. Y. W. Lee P. E. A. Cowley H. E. Singleton
Prof. J. F. Reintjes L. Dolansky C. A. Stutt
Dr. E. E. David, Jr. E. H. Gibbons I. Uygur
Dr. O. H. Straus P. E. Green, Jr. L. Weinberg
1. Analog Electronic Correlator
Construction of the multiplier and integrator circuits has been completed, and their performance characteristics are being studied. J. F. Reintjes
2. Radar Waveform Detection by Crosscorrelation
Several crosscorrelations of a periodic unit impulse with the video return of a radar system have been run on the digital electronic correlator. In these tests the radar and correlator were synchronized at approximately 500 pulses and samples per second. About 14, 000 product pairs were averaged in obtaining each point on the output curve of the correlator.
(a)
Fig. IX-4 Crosscorrelation of radar video signal with synchronized peri-odic unit impulse. Above, radar video signal (correlator input); right, correlator output.
(b)
Figure IX-4a shows the A-scope presentation of the radar video signal on a 25-fJ.sec sweep. Fig. IX -4b is the correlator output over the T -range of about 3 fJ.sec to 18 fJ.sec.
Y. W. Lee, L. G. Kraft, I. Uygur
-41-3. Noise in Nonlinear Devices
An experimental check on the autocorrelation functions obtained theoretically for linear and nonlinear circuits is now in progress. The output of a white-noise generator (with and without sinusoidal signal) was fed through a band-pass filter with variable Q to a linear rectifier. The Q's that are being used are 60, 25, and 8.8.
1 160 200 218 I 80 120 TINfLsec b 40
6
'i:'IIII~II
J~
' .' \ -',I~. ;1" 8'0 120 TINfLsec u6
40o
E
.fi_~
_
80
120 160 200 218 T INfLsec cFig. IX-5 Normalized autocorrelation function for filtered noise. (a) Q
=
60 (b) Q=
25 (c) Q =8.8.It is desired to obtain curves of the autocorrelation function for the input and output of the linear rectifier by use of the electronic digital correlator. Curves for the three different Q's (with points separated by T
=
2 f-Lsec) have been obtained for the input to therectifier when the inputs are: (a) filtered random noise, and (b) filtered random noise plus a sine wave of frequency equal to the midband frequency of the noise (f
=
22 kc. ).o
As an example of the curves obtained from the correlator, those for filtered random noise are given in Fig. IX-5. Autocorrelation curves for the output of the rectifier with an input of filtered random noise have also been obtained. StiU to be obtained are those curves for the output of the rectifier when the input is a sine wave plus filtered random noise.
The experimental curves shown in Fig. IX-5 have been compared with the theoreti-cally calculated curves. The plots are given in Fig. IX-6.
CALCULATED EXPERIMENTAL
-1.0 I ....,..-0
o .~~ .~~ ~.~ ;~~ ~~~ ~~~ An~ "'A" ,.,...,... ,.,.." -.,.,'" ""n" OAn Or,,,,, n.::" ,..,..,,, ,,,,,,... -1.0~L_--L-_-'-_-'-_-'---_...l-_...l-_~_-'---_-'---_L-_L---.J_--.J_---,_.--'-_--'-_----L_----'--_ <PinIT) <Pin(1;) We1:1DEGREES) We T (DEGREES) b CALCULATED EXPERIMENTAL
Fig. IX- 6 Calculated and experimental curves of normalized autocorrelation function for filtered noise.
(,rJ' T o ,1,..
=
e 2Q cos W T. 'rill 0 8.8 (c) Q25
(b) Q 60 (a) Q <PinIT) We T(D~GREES)4. Techniques of Optimum Filter Design
The delay-line filter briefly described in the Quarterly Progress Report, July 15, 1950, has been completed, and has given quite satisfactory results in the following appli-cations:
a. Realization of linear filters from a prescribed impulse response. b. Determination of the amplitude and phase response of networks
designed for a prescribed impulse response.
c. Determination of the Fourier transforms of correlation function. d. Evaluation of convolution integrals.
Experimental results from these four applications, especially in regard to use of the line in the synthesis of optimum mean-square filters, will be published later.
Y. W. Lee, C. A. Stutt
5. Interference Filtering
Ordinarily the filtering problem concerns itself with a single time series composed of the sum of a message and a disturbance. Interference filtering represents a more general approach to the filtering problem. Consider, for example, the situation described by Fig. IX-7 where f 1(t) and f
2(t) represent messages in channels 1 and 2
Fig. IX-7 Two-channel interference filtering.
respectively and gl (t) and g2(t) represent disturbance functions. It is assumed that some correlation exists between the channell and channel 2 voltages. If, for example, the desired output is the channel-l message, system functions H 11(w) and H 12(w) must be found which minimize the mean-square error
t
between f (t) and f1(t
+
a). That iso
-T
~
=¥~~
h-
J
[fort) - fl(t .:':.a)]
2 dtmust be made a minimum.
Exact network solutions have been obtained for long-delay filtering and approximate methods are now being tried to give more general solutions.
(IX. COMMUNICATION RESEARCH)
6. Theory of Nonlinear Transducers
A detailed report on the results of this study has been prepared, and is being
pub-lished as Technical Report No. 160. H. E. Singleton
7. Application of Correlation Techniques to Electro-Acoustic Measurements In investigating the acoustical properties of rooms and loudspeakers we are dealing with systems which have distributed constants, and therefore exhibit numerous reso-nances. Periodic signals, when applied to such systems, excite only some particular modes of the sound field, creating conditions different from those in actual transmission of speech and music. In this respect, more valuable data are obtainable by using ran-dom noise.
Standard methods c all for filtering of the noise at the input or at the output in order to determine the frequency content at these points. Theoretically, filtering can be substituted by the process of autocorrelation and a subsequent Laplace transformation. In addition, crosscorrelation of the input with the output should give a direct indication of the impulse response of the system provided the input has a uniform frequency spec-trum.
Some preliminary tests of these techniques have been carried out on a studio with the use of the digital electronic correlator. They have indicated difficulties arising from the fact that acoustic systems are relatively slow and introduce long delays. Moreover, time constants associated with decay are large as compared with the frequencies of decay. The conditions thus imposed on the correlating machine are more exacting than those encountered in purely electrical networks. J. B. Wiesner, J. J. Bussgang
8. Speech Studies
a. A short-time correlator for speech waves
A short-time correlator, substantially as described in the Quarterly Progress Report, Jan. 15, 1950, has been completed and aligned. The delay line is somewhat different from the earlier design. It consists of 36 sections, each of which comprises 9 inductively coupled tuned circuits. The maximum delay obtained is 1. 57 msec; the deviation in the speech range is within 2 percent. The attenuation and phase character-istics are shown in Fig. IX-8.
The correlation pattern displayed is an approximation to the true correlation pattern obtained by specifying the value of the correlation function at 13 points. These points correspond to 13 equally spaced discrete values of delay T. It can be shown (see
R. M. Fano, J. Acous. Soc. Am., Sept. 1950) that if the frequency spectrum is suitably defined, the power spectrum corresponding to the correlation pattern is defined by 13 terms of a Fourier series, one of which is a constant term.
-45-the o-45-ther follows, -45-the pattern. In the
pat-FREQUENCY DEViATION FROM MID-BAND (Kc)
Fig. IX-8 Attenuation and phase characteristics of delay line.
2 o 4 i6 ~ 6 .c
..,
~ 8 z Q 10 ~ ~ 12 w ~ 14 !::(The frequency of the fundamental term is given by 2iTf1
=
iTlT12 where T12 is the totaldelay, and the highest frequency is given by 2iTf
2 = iTIT1 whereT 1 is the spacing between
values of delay. Thus the spacing of the values of delay T determines the highest
fre-quency term, and the total delay determines the lowest frequency term. In the case of this correlator with T1
=
131 f-lsec and T12
=
1.57 msec, f1=
318 c and f2=
3820 c. Thus the correlation pattern is adequate for the display of speech of telephonic toll quality.Although primarily designed for speech, other signals can be handled by the corre-lator, provided that the signals lie within the speech frequency range or can be trans-lated to lie within that range. The correla-tion patterns obtained with sinusoidal input signals are illustrated in Fig. IX-9 (1) to (5). The value of the correlation function is given by the vertical dimension. The zero or reference position is indicated by two "points", one of which precedes, and
terns the delay T is zero on the left and
1.57 msec on the right. In many of the patterns a point on the extreme right appears that is a repetition of the zero delay point.
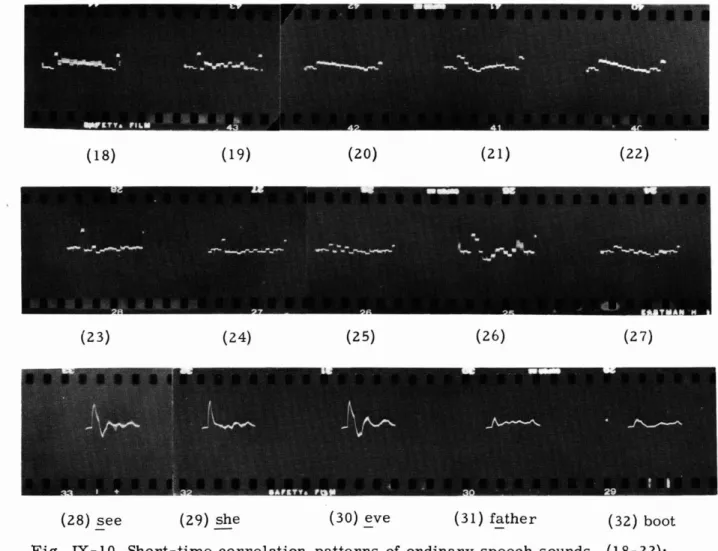
Some preliminary correlation patterns of speech sounds are given in Fig. IX-9, (6) to (17) and Fig. IX-IO, (18) to (27). Figure IX-9, (6) to (13) and Fig. IX-IO, (18) to (22) are for ordinary speech; Fig. IX-9, (14)to (17) and Fig. IX-IO, (23) to (27) are for dif-ferentiated speech. The method of obtaining the photographs was to reproduce the speech sounds from a magnetic-tape recording and to operate the camera shutter at the appro-priate moment as nearly as could be judged. Later the actual pattern photographed was compared with the oscilloscope pattern produced by repeating the speech sounds into a microphone. The exposure used was 1/25 sec, in which period 40 sweeps of the screen take place. The blurring of some of the photographs is due to exposure having been made while speech is in a state of transition from one sound to another. By taking pictures with a cinecamera it may be possible to learn something of the transitions in speech.
The effect of differentiating speech before applying it to the correlator is to produce shorter-period ripples in the patterns.
(1) 325 c (2) 650 c (3) 960 c (4) 1880 c (5) 3760 c
(6) ~Sk (7) ~ll (8) for (9) vote (10) church (11) judge
(12) sh~ (13) azure (14) f~r (15) v~te (16) church (17) judge
Fig. IX-9 Short-time correlation patterns of sinusoids, (1) to (5); of ordinary
(18) (19) (20) (21 ) (22)
(23) (24) (25) (26) (27)
(28) ~ee (29) she (30) ~ve (31) f~ther (32) boot
Fig. IX-IO Short-time correlation patterns of ordinary speech sounds, (18-22); of differentiated speech sounds, (23) to (27); of differentiated speech sounds smoothed by a condenser, (28) to (32).
across the oscilloscope is to produce an almost smooth curve which is more pleasant
to observe than the curve of step-like approximations. This is illustrated in Fig. IX-I0,
(28) to (32). A technical report on this project is being prepared.
R .. M. Fano, P. E. A. Cowley, B. L. Basore
b. An electrical analog of the cochlea
When the cochlea is excited by a sinusoidal pressure wave, the amplitude of vibra-tion of the basilar membrane as a funcvibra-tion of distance along the membrane increases to some maximum value and then decreases; this response looks roughly like a resonance curve. The position of the maximum amplitude moves progressively towards the input of the cochlea as the excitation frequency is increased. Thus the cochlea is a frequency-analyzing device; only a particular portion of the basilar membrane vibrates strongly
(IX. COMMUNICATION RESEARCH)
at any given frequency.
In present techniques employed in the portrayal of visible speech, a frequency analy-sis of the sound spectrum is performed by means of filters (1). If, instead of the filters, an electrical analog of the cochlea were used to perform the frequency analysis, it is possible that some of the difficulties encountered in speech patterns might be avoided. The filters analyze the sound spectrum in an artificial manner, and hence may not bring out the most pertinent properties of speech; use of an analog of the cochlea will place in evidence the same properties of speech which actuate the ear, and which may therefore be considered to characterize speech.
Many theories of hearing are in existence. Even the more recent ones, however, are not in complete agreement with each other and with the data which G. von Bekesy obtained from measurements on anatomical specimens of the cochlea (2,3,4). It was therefore decided to carry out an experimental design of the electrical analog, based on von Be-kesy's data, rather than to construct a network which corresponds to some
partic-cut-off frequencies, " m ", and the resistances associated with the coils were studied experi-mentally. From the data thus obtained, a line of 35 sections was designed to represent the
cochlea; each section corresponds to a I-mm length of the cochlea. A model of this line, with the frequency scaled up by a factor of 10, has been constructed. Measurements made on it are, after being scaled down, in reasonably good agreement with von Bekesy's results. While the experimental lines were being constructed, descriptions of other transmission-line analogs of the cochlea appeared in the literature (5,6).
---I.
C 2(nj ular theory.
The available facts suggested as an electrical representation a transmission line consisting of cascaded m-derived low-pass filter sections, each section having a cut-off frequency lower than that of the immediately preceding section, with the charge on the condensers in the shunt branches corresponding to the amplitude of vibration of the basi-lar membrane. A typical section of such a line is shown in Fig. IX-II; the resistances are necessary to account for the large amount of dissipation which is present in the
cochlea. A 13- section line of this type was con-structed, and the effects of varying the section
Fig. IX-II One section of the trans-mission line analog of the cochlea. n
=
section number; w=
cut-off frequency; R=
imped£hce level. L 1(n) = 2R (n) m (n)/Wo(n); Cz
(n) = Zm(n)/R(n)wo(n); LZ (n)=
[l/m(n) - m(n)] R(n)/Zw o(n). R. M. Fano, A. J. Lephakis-49-References
(1) J. Acous. Soc. Amer. 18, 1-89 (July 1946). (2) J. Acous. Soc. Amer. 19, 452-460 (May 1947). (3) J. Acous. Soc. Amer. 20, 227-241 (May 1948). (4) J. Acous. Soc. Amer. 21, 233-254 (May 1949). (5) J. Acous. Soc. Amer. 22, 369-381 (May 1950). ( 6) Bell Lab. Rec. 28, 257 (June 1950).
c. The effect of syllabic rate on speech intelligibility
Articulation tests on speech at various syllabic rates have been run. The data are now being examined and will be presented later. R. M. Fano, P. E. Green
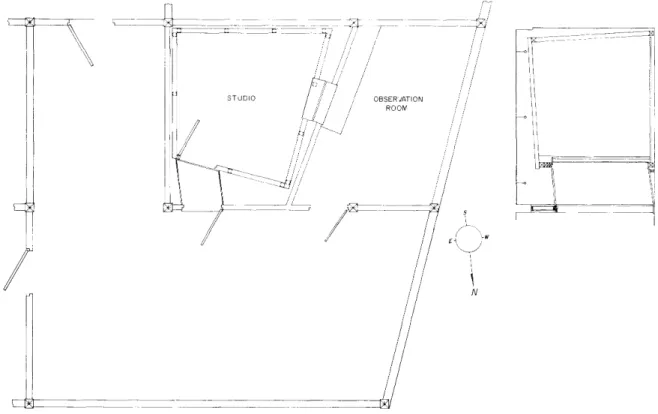
9. A Studio for Speech Studies
Problem. A small room with acoustic characteristics approaching the ideal has been constructed for use in the study of speech. The requirements were that it be quiet, comfortable in summer, and be a good environment for the study of the characteristics of speech.
L i L O ' C
2 6 8 I 10,000 4
-
T E S T E D U -4 6 8 I . 1000FREQUENCY IN CYCLES PER SECOND {
RESONATOR TREATED,
~
-J
WITH TWO ADULTS...
~-... - : : _ _ -t--J-I I"-CALCULAT~- _
---Fig. IX-14 Reverberation chart.
1.6 1.4 1.2 1.0 T 0.8 0.6 0.4 0.2
01
I I 4 6 4 6 8 I 10,000 2 2 4 6 8 I 1000 FREQUENCY IN CYCLES PER SECOND4 6 8 I
100
Fig. IX-I3 Exterior arrangement of ductwork.
-~ I
/I' \
I-~ ... I (b) \~-
/ ...,
/ 42.5ft.2 \~ l -I \ ' @ 1650cpa \ /y\
\
I (a) \ \ I I 24fl. 2 \ \ l- I @400cpa I I I I II I I I I I I I I I I I I I I I I I I I 30 40 O 2 10 In Z iii et In 20 I .,Construction. The studio proper is of wood-frame construction with plaster-board as a surfacing material. It is a double- shell scheme in which the outer shell is part of the building and the inner shell is floated free. This inner shell is composed of two units: the walls and ceiling; and the floor. The walls and ceiling form a braced box resting on felt pads on the base floor; the studio floor is laid on double-thick wood pulp insulating blanket. The two units are free of each other. To reduce to a minimum the possibilities of normal mode degeneracies and flutter echo within the studio there are no parallel surfaces. Since the room is smalL about 800 cubic feet, this also makes for a diffuse sound field. To reduce the possibility of reinforced resonance of the sur-faces, the studs and joists of the walls, floor and ceiling are spaced nonuniformly.
Ventilation. The air conditioning system is made up of separate components purchased from and installed by a local firm. The ductwork was made in the Research Laboratory of Electronics machine shop. The blower (far right in Fig. IX-I3) had a peak in its noise spectrum about 65 db high and with a frequency of 800 cps at design rpm, due to siren effect of the blades. To cut this to a reasonable value, J. J. Baruch of the
M.1. T. Acoustics Laboratory designed a tuned-duct section, using 9-pound density fiber-glass, 5 inches thick, for an overall size of 22 inches by 22 inches. This section has a calculated attenuation of the order of 20 db per foot at 800 cps. Lengths of the section may be seen in Fig. IX-I3 in the supply and return ducts.
Treatment. Upon completion of the studio, the reverberation time was meas-ured by standard methods using octave bands of thermal noise and the result plotted against frequency (top curve Fig. IX-I4). This curve has two points of interest. When we decided to use plasterboard as a surface material, it was estimated, in the absence of concrete data, that it would act somewhat like plywood toward low-frequency sounds. The low reverberation time in the 200-cps region is substantiation of this view to a large degree. This was fortunate in that absorption of low-frequency sound is a bulky propo-sition. The high peak at 2000 cps has not been accounted for satisfactorily but was taken c are of easily in the subsequent absorptive treatment. For this treatment we decided to use a method discovered by K. U. Ingard (1) of using standard perforated asbestos cement board, covered with cloth, as an acoustic resonator. The simplicity of applica-tion and low material cost of this treatment makes it quite appealing to the designer. A projected paper by Dr. Ingard will treat the necessary calculations in some detail. Once the materials are selected the two critical factors are the area to be covered and the spacing of the material from the wall. The method of use may be gathered from Fig. IX-I5. The solid line shows the absorption needed for optimum reverberation time vs. frequency, the dotted lines indicate the action of two resonant areas in providing this absorption. The final appearance of the treatment may be seen in Fig. IX-I6 where the low-frequency resonator is to the right, spaced 14 em from the wall, and the high-frequency area to the left, spaced 1. 3 em from the wall and ceiling. The cloth covering
(IX. COMMUNICATION RESEARCH)
is on the back in both cases.
The final reverberation tests were made with the use, as on-the-site equipment, of a starter's pistol and a magnetic tape recorder. The tape was played back through an octave band filter and a high-speed graphic level recorder and the reverberation time read from the slope of the curve in the usual way. This method is much less cumber-some to use and correlate, within the usual interpretation error limits, with the more classical methods. The results of this test may be seen in Fig. IX-14 below the calcu-lated curve. This discrepancy has been explained as due to flexibility of wall and reso-nator-panel. The change in slope in the 1500-cps region is attributable to the approxi-mations used in the calculations for the resonators.
In the final analysis, efforts toward insuring satisfactory behavior of sound origi-nating in the room were quite successful. Isolationwise things have not worked out as well. The noise-reduction coefficient of the shells, and thus the ambient noise level in the studio, while not prohibitive are not perfect. Part of this is the result of expecting too much of light construction, part to the impossibility of sufficiently close supervision. This condition is correctible to a large extent and improvements will be made.
John T. Weeks
M.1. T. School of Architecture Acknowledgment
To Prof. R. H. Bolt* and R. B. Newman* for time spent in invaluable advice and
coun-*
*,
sel, to J. A. Kessler and H. Federhen for reverberation testing, to Dr. K. U. Ingard* and P. E. Doak* for advice and help with the resonator, to J. J. Baruch* for the tuned ducts, and to A. A. Schlicting of the M. 1. T. Plastics Laboratory, for assembling the resonators.
Bibliography
1. K. U. Ingard: Scattering and Absorption by Acoustic Resonators, Doctoral thesis, Physics department, M.LT. (1950).
2. L. L. Beranek: Acoustic Measurements, John Wiley, N. Y. (1950).
3. V. O. Knudson, C. M. Harris: Acoustical Designing in Architecture, John Wiley, N. Y. (1950).
* M .1. T. Acoustics Laboratory.
-53-C. HUMAN COMMUNICATION SYSTEMS * Prof. A. Bavelas Prof. J. B. Wiesner Dr. O. H. Straus R. P. Abelson W. H. Huggins A. Simmel F. L. Skinner S. L. Smith N. O. Sokal
Theory of Cochlear Frequency Discrimination
A theory based on the known mechanical properties of the cochlea and utilizing the peculiar structure of the organ of Corti and the tectorial membrane has been developed. Assuming a simple neural inhibiting mechanism, this theory explains qualitatively and quantitatively some of the experimental data obtained by Galambos and Davis (1) on the inhibition of activity in single auditory nerve fibers by acoustic stimulation consisting of one or two different tones. The theory yields a pattern of stimulation along the basilar membrane which is in good agreement with the pattern determined indirectly from data on masking by Fletcher (2), and it easily accounts for the observed frequency-discrimination of the ear (0.3 percent at 1000 cps).
The theory is based on the following mechanical assumptions:
a) The tectorial membrane is linked rigidly to the organ of Corti by the cilia of the inner and outer hair cells.
b) Excitation of the hair cells occurs when the cilia are placed under tension. The intensity of the excitation is proportion. J to the force exerted upon the cilia.
c) The vibration of the basilar membrane obeys the simple hydrodynamical laws described by Peterson (3) and others, with dissipation assigned to the basilar mem-brane corresponding to a logarithmic decrement of 1. 57.
d) In agreement with Bekesy's observation that the tectorial membrane possesses substantial stiffness in the longitudinal direction (4), the tectorial membrane is
regarded as a stiff beam which is given the same displacement as the organ of Corti by forces exerted upon it by the cilia of the outer hair cells. The force-distribution function w(x) at a distance x along the basilar membrane is related to the displace-ment y(x) by the well-known relation for the bending of a beam
d4
K1
=
w(x) dxThus, the outer hair cells are excited by a traveling wave proportional to the fourth space-derivative of the displacement. On the other hand, the inner hair cells are
0' ---- ---.::>.,
!::=:----35 30
25
10 15 20
DISTANCE FROM STAPES IN mm 5 0.001 0 0.5 0.1 ::s.. E z I-Z w :!: w 0.0\ Q <t ...J a.. (J) is 35 30 [d 4 Y
1
org - 4 'PHASE OF OUTER-HAIR-dK CELL EXCITATION
10 15 20 25
~STANCEFROM STAPES IN mm
(b) 5 ----FACiLITATION .'\<- INHI8ITION--1 (f) Z <t 0 <t cr Z <!> 271" <t ...J W (f) <t :r: 371" 0.. 471"
l
0 0.16 ::l... 0.14 E ~ I-z 0.12 w ::E w <.) <t ...J 0.10 0.. (f) Ci -271" (0) PHASE OF INNER-HAIR-CELL EXCITATION,org [YjOr----= C\l
i
0.08 ~ ~ 0.06 z ;:;:; 0.04 cr ::::> (f) (f) w g: 0.02-71"--Fig. IX-17 Phase and amplitude variation of the
trans-verse pressu.re, displacement, and fourth space deriv-ative of the displacement for a IOOO-cps tone.
Fig. IX-IS Magnitude of fourth space derivative of the
displacement compared to the stimulation pattern on the basilar membrane determined from data on masking by Fletcher.
located in such a position that it is reasonable to assume that they are excited in proportion to the displacement y(x) of the organ of Corti.
A solution of the dynamical equations of the cochlea for sinusoidal stimulation by a 1000 -cps sinusoidal tone of 1 dyne/em2 pressure, using the approximate method appro-priate to nonuniform transmission lines (5), led to the numerical results presented graphically in Fig. IX-I7. Figure IX-I8 shows the excitation of the outer hair cells (i. e. d4y/ dx4) replotted on a logarithmic scale and compared with the stimulation pattern along the basilar membrane as determined by Fletcher from data on masking (traced from Stevens and Davis, "HEARING", Fig. 93, 55-db curve).
More significant than the fact that the excitation of the outer hair cells (being propor-tional to d4y/ dx4) is now quite localized, is the fact that the phase of excitation of the outer hair cells changes much more rapidly with respect to position along the basilar membrane than does the phase of excitation of the inner hair cells. Figure IX-17b shows this phase relation for a IOOO-cps tone. For a given frequency, there is one and only one point along the basilar membrane where the excitations of inner and outer hair cells are in phase. This important effect suggests three additional assumptions; the first is essential to the theory and the remaining two are necessary to fit available experimental data:
e) At either a first- or second-order neuron level, the firing of the nerve fibers arborizing on the inner hair cells temporarily inhibits the neural response to the excitation of certain of the outer hair cells. Thus, for periodic excitation, the neural response from the region of the basilar membrane extending from the point of resonance toward the apex will be inhibited as shown in Fig. IX-I7b.
f) At the point along the basilar membrane for which maximal excitation of the outer hair cells occurs, the threshold for firing of the inner-hair-cell nerve fibers is assumed to be 20 db higher than that for the outer-hair-cell nerve fibers.
g) It is assumed that the nerve fibers arborizing on a given inner hair cell act as inhibitors for those nerve fibers terminating on the group of outer hair cells that are 1.5 mm basalward. This assumption is consistent with the observation that the fibers innervating the outer hair cells issue from the habenula perforata, pass the inner hair cells and thence, after reaching the outer-hair-cell region, run basal-ward for a considerable distance before arborizing around adjacent hair cells. To compare the theory with the experimental observations of Galambos and Davis, the data of Fig. IX-I8 have been replotted in Fig. IX-I9a in terms of the acoustic stim-ulus required to stimulate the nerve fibers terminating on the inner and outer hair cells, assuming a -100 db threshold for the latter. In accordance with assumption (f), the threshold curve for the inner hair cell was adjusted to have a value 20 db higher at the point of maximum sensitivity for the outer hair cells, and it was then displaced 1. 5 mm
(IX. COMMUNICATION RESEARCH)
0 . - - - . - - - . .
Fig. IX-19 (a) Regions of response and inhibi-tion along basilar membrane for a 1000-cps tone. (b) Expected inhibition due to a second tone as explained in text.
INIHIBITORY AREA I I / -40 -60 -20 -90 -IOO'--.,..>,---"::---,.L:--~-'=:---'-:---' ~ ~ 100 UJ !:( 50 a:: ~ OJ----..d----+--~+----++---___,___!_____ UJ C> ~ -50 J: u ~-100 ' - -_ _- ' - - ' - - _ - ' - - - ' - - - ' - - - - J . _ 1.0 1.5 FREQUENCY IN Keps
(SCALE ADJUSTED FOR COMPARISON WITH FIG. 4)
( b)
toward the right in accord with assumption (g).
Whether or not the inhibiting nerve fiber associated with the inner hair cell will fire before or after the corresponding outer-nerve-cell fiber depends not only upon the phase
angle between the two excitations but also upon the amplitudes of the stimulations at the two hair cells relative to their respective thresholds. For stimulation by very loud tones, inhibition will occur when the phase of the inner-hair-cell excitation leads that of the outer by even a very small angle, and the simple situation indicated in Fig. IX-17b applies. But for weak tones approaching the threshold of the inner-hair-cell fibers, the phase angle of the inner-hair-cell excitation may lead the outer by large angles
approaching 90° without inhibiting the response. This boundary condition is easily determined from the amplitude and phase data of Fig. IX-17 and leads to the "response" and IIinhibitoryII areas bounded by the heavy lines in Fig. IX -19 a. Since 'place' along
the basilar membrane is roughly interchangeable with 'frequency', these theoretical results may be compared with the experimental data obtained by Galambos and Davis and reproduced in Fig. IX-20a.
Also shown in Fig. IX-19b are theoretical estimates, based on the calculated sensi-tivity curves given immediately above, of the effect of a second tone in inhibiting the activity of a single nerve fiber already subjected to the steady excitation of a 1000 -cps tone 22 db above threshold (indicated by the point T 1 in Fig. IX-19a). When the ear is driven simultaneously by a second tone T 2 of different frequency and amplitude, the average phase of the resultant excitation at any point along the basilar membrane will be controlled by that frequency component which has the greater amplitude. In other
-57-words, there exists a "capture effect" just as in the interference between two f-m radio transmissions. As the frequency T 2 is varied, the effect will be similar to a displace-ment along the basilar membrane, and examination of Fig. IX-I9a shows that even
Fig. IX-20 Experimental data after Galambos and Davis for response of a single nerve fiber in the cochlear nucleus of a cat (see ref. 1).
RESPONSE AREA FREQUENCY IN Kcps "
---
~~"
rJl
18 [ 1300~-94db] (b) (0) 0 0:: 0 20 I-<{ ...J ...J (3 (/) 0 ::!: 40 0 0:: U. > (\J ~ 60 9 I.IJ CD ..c "'C 80 100 (\J 100 I- >-CD 50 I.IJ I-<{ 0 0:: ~ I.IJ -50 <!l z <{ -100 J: Q ~ 0.1 FREQUENCY T2 , K cpsthough the strength of T 2 is held constant, changes in its frequency can cause widely different effects. For a T2 at 44 db and lying between 26 and 27 mm, the excitation caused by T 2 will have a greater amplitude than that caused by T 1 for both the inner and outer hair cells, and complete inhibition will result since T 2 lies in the inhibitory area. At other frequencies, corresponding to a T 2 in the region of 16 mm, the inner-hair-cell excitation will be controlled by T 2 whereas the outer-hair-cell excitation is controlled by T 1. Since the firing of the inhibitory nerve fibers is then no longer synchronized with the outer-hair-cell excitation, it is reasonable to expect partial, but not complete, inhibition. The theoretical curves shown in Fig. IX-19b were determined for stimulus levels corresponding to the experimental data obtained by Galambos and Davis and repro-duced in Fig. IX-20b.
Finally, the theoretical data of Fig. IX-17b after modification according to assump-tion (g) show that in the critical region of phase equality, the phase difference between inner and outer hair-cell excitations is increasing at the rate of about 113 degrees/ mm which for the assumed cochlear tuning corresponds to a phase change of 10 degrees/ per-cent frequency change. Assuming that the neural mechanism is capable of measuring this phase angle to within 1/12 period or 30 degrees, each cycle of the stimulation
(IX. COMMUNICATION RESEARCH)
should provide an estimate of the frequency which is accurate to within 3 percent. But it is reasonable that the nervous system is capable of computing the average value of a large number of such samplings extending over a time interval as great as 0.2 seconds.
0----0 EXPERIMENTAL DATA AFTER
BEKESY FOR 800cps TONE 0.03 IN 0.01 0.008 ~F 0.006 F 0.004 0.002 00 0.1 0.2
DURATION OF TONE IN SEC
0.3 0.4
Fig. IX-21 Effect of duration of tone on frequency discrimination.
For a 1000-cps tone, this would correspond to 200 independent measurements of the frequency, and the accuracy of the mean value of these observations would be in the order of 3 percent/IN, where N is the number of measurements, or about 0.0021. Whether or not the nervous system does average the data in this manner is, of course, open to question; experimental data taken by Bekesy (6) show a rather close agreement with the theory, as indicated in Fig. IX-21. W. H. Huggins
References
1. Robert Galambos, Hallowell Davis: J. Neurophysiol. 7, 287-304 (1944). 2. Harvey Fletcher: J. Acous. Soc. Am .
.!.'
311-343 (1930).3. L. C. Peterson, B. P. Bogert: J. Acous. Soc. Am. 22, 369-381 (May 1950). 4. G. v. Bekesy: J. Acous. Soc. Am.
1:1,
452-460 (May 1947).5. J. C. Slater: Microwave Transmission, McGraw Hill, N. Y. (1942) Chap. 1, sect. 6. 6. Stevens and Davis: Hearing, John Wiley and Sons, Fig. 38.
-59-D. TRANSIENT PROBLEMS
Prof. E. A. Guillemin Dr. M. V. Cerrillo
H. M. Lucal 1. Network Synthesis in the Time Domain
Dr. L. M. Vallese W. H. Kautz
a. The synthesis of delay, pulse forming, jump and supression networks has been under investigation. These networks playa basic role in the synthesis in the time domain because they perform basic operations. The networks are extracted from e-ST;
-ST -ST
I
-ST-Tis
1 ~ e ,(1 - e ) (1
+
e ); e ,when they are realized as transfer functions. Their exact realization requires an infinite number of lumped elements. Good approxi-mate networks can be obtained by using a certain part of the infinite networks. The process of construction of these partial networks is as follows: An infinite set of rational functions, for example, pjQn n = 1, 2, .... , is generated in such a way that: first, Pn/Qn + selected transcendental, when n + 00. Second, Pn/Qn is realizable as atransfer function. The above transcendental functions possess Pade sequences which satisfy the above requirements.
The function
k
(s
+
a)e
leads to a family of networks which represent group (k
=
2) and transitional (k > 2) delays. The function itself is not realizable, but its Pade approximants can be realized by a suitable choice of "a ", which depends on n.The function
has a realizable branch. The sequence of Pade approximants, which has this branch as limiting value, is unrestrictedly realizable. This function is used to simulate wave guides, transmission lines, etc. with networks of lumped elements. There is a large group of transcendental functions which have realizable Pade approximants. Some mem-bers of this group are under investigation.
b. We will describe in this report a family of networks which is associated with the function e -ST.
Let h (t) be the time response of a network, which has a transfer function G(s), when it is excited by a driving force f (t). Assume L f (t) = F (s).
We want to synthesize a family of networks G (s) which has the following transmitting property
(IX. COMMUNICATION RESEARCH)
(
0 for t < 0
h (t)
=
almost 0 for 0 < t < T~f(t-T)forT<t< 00
It can be observed that all pass delay structures are particular members of this group. For simplicity, and without loss of generality, we will set T
=
1 (normalized delay).We will construct and realize a family of sequences which approaches e -s ~ G (s). c. Minimum phase family generated by Pade sequences.
The Pade approximations of transcendental functions, constitute, in fact, double sequences of the integer numbers IJ., v.
Let P (s) and Q (s) be polynomials, respectively, of degree 1/ and IJ. and given by
fJ.,1/ IJ.,v
P () 1 _ _1/ _
~
+
v (v - 1) s2 ( l)v v (v - 1) ... 2. 1 sVfJ.,1/ S '= fJ. + vI! (IJ. +v){IJ. + v - I )
2T
+.... + - (fJ. + lI}(IJ +v - 1) ...(IJ. + 1)ZiT
It can be shown that the ratio P
/Q
is realizable as a minimum phase transferIJ.,1/ fJ.,v
function for every integral value of fJ., 1/, fJ.:> 1/.
The double sequence P
/Q
-+ e - s (uniformly) when (1/+ IJ.) -+00. Every rationalfJ.,1/ IJ.,II
approximant is realized as a lattice structure. The following triangular arrangement shows a few Pade approximants computed for fJ. and 1/ = 0, 1, 2, 3.
TABLE I 1
T
1 1 -1 2 sT+S
1 1 +2 s 1 1-"3 s1 I - - s +1 61 s2"'5T 2 2. 2 2 1 s2 1 1 s2 1 + s ..l.- S 1 1 I ZT +3 s +3ZT +Zs+62T 1 2 1 2 1 1 s2 1 s3 1 1- s 4 s 1-5 s+ TaZT 1-z
s +5ZT-203T s2 s3 3 2 s2 1 s3 3 3 2 3 1 1 s2 1 s3 1 s I s 1 1 + S +2T +3T 1 +4 s +4' 2T + 43T +5 s +TQ' 2T + T03T +z:s+s2T+zo3T-61-The family of all pass minimum phase networks which synthesize delay lines, is con-tained along the diagonal line, (IJ. =II). The corresponding delay lines are called "Pade
sense delay lines". It can be seen that the diagonal approximants represent a transfer function whose magnitude is equal to 1 for all frequencies. This property does not hold for the other approximants.
As an illustration of the method of synthesis we will give the corresponding lattice structures which realize the transfer function of the diagonal line. They are drawn on one ohm and one unit delay basis. Fig. IX-22 shows the structures for IJ. =v = 1, 2, 3 and the corresponding structures in the general case. The delaying effect of these
I iO
t
J.L=11= I In J.L=1I=2 In J.L=1I=3 InFig. IX-22 Structures corresponding to an all pass delay network in the Pade sense. structures becomes sharper as IJ. = v increases. Figure IX-23 illustrates the transmis-sion of the unit step function through the structures IJ. = II (delay line) for different values
of IJ.. Figure IX-23a shows the transmission for II
=
IJ.=
6, 7. Note that one spike (marker) always appears for a brief time at t=
o.
For t < 1 there are some small wiggles which decrease as IJ. increases. This sort of transient, Fig. IX-23a, corre-sponds exactly to the structures of the diagonal in Table 1. It is possible to suppress, completely or partially, this initial spike by loading with a resistor the ends of the impedances Za and Zb as it is indicated in Fig. IX-22. Complete suppression of the initial spike is attained by loading with one ohm resistance. Figure IX-23b shows the effect of the loading resistances. The structures corresponding to the approximants outside of the principal diagonal do not show the initial spike at t=
o.
(IX. COMMUNICATION RESEARCH)
still have certain freedom of specifying condi-tions (not all arbitrary) in the frequency domain. The transient behavior changes naturally with the selection of /-1 and II but always retains the
general common characteristic of delay. Most of the changes appear in the region of transient formation. For example, the transmission of the unit step shows a complete monotonic
behav-o
/-1f
O. (See Fig. IX-24.) t -t _ fL=II=6 ,r;~ / fL=II=6 (a) ( b)Fig. IX-23 Transmission of unit step.
ior, for all approximants given by v
=
by /-1
f
lI. This magnitude is one at zero frequency and decreases towards zero more orless rapidly, depending on the selection of /-1, lI.
Since any subsequence of approximants tends
-s
uniformly to e when (/-1
+
lI) +00 , then corre-sponding delaying effect is preserved and be-comes sharper as /-1 and v increase, and it is independent of the behavior of the magnitude of the transfer function (in an approximate way). The above property makes very valuable the Pade process of synthesis, since we can specify a certain characteristic in the time domain andFig. IX-24 Transmission of unit step.
t
-fL=5,II=O
d. Minimum phase recurrent network generated by Pade subsequences. Multiple order poles and zeros.
Recurrent networks can be easily extracted by the proper combination of the Pade sequences. This possibility has a strong practical significance. The procedure is simple. Let k be an integer. Then
_ s ( _
~)k
_
~
_
~
_
~
e = e =e xe X ' ' ' x e
Each factor in the second member can now be approximated by any Pade approximant. For large values of k it is obvious that the first approxirnants render a high-degree approximation. For example, we can choose II = 0, /-1 = 2, (or any other) and get
-63-2 l+~+_s_ k 4k2 Finally - s 1 e
~
[1
+
~
+
s2]k k 4k2(multiple complex poles only)
which corresponds to a cascade connection of k equal structures. The realization of the transfer function is indicated in Fig. IX-25. The response of this network to the unit
In
k STRUCTURES
Fig. IX-25 Recurrent structure corre-sponding to two complex poles of multi-plicity k.
fit)
r '
Fig. IX-26 Typical response to the unit impulse of the structure given in Fig. IX-25.
impulse, or to the unit step function, can be easily computed. For example the response to the unit impulse is given by
- kt
f (t) =
rem
e t (2 k - 1)1\ 1 (kt)l.l..(k-
z)
where A indicate the lambda function. This typical response has the form given in n
Fig. IX-26. Multiple zeros can be introduced in the same manner.
The study of the transmission properties and transient behavior of the Pade approxi-mation corresponding to a pole and zero distribution given by
- s [(s - a)(s - 6)](3
e ~
[ (s
+
a)( s+
6) ]aa ~ (3 0, 6, complex
has been started. Dr. Vallese is engaged in this research and progress has been
attained in the study and characterization of the transient function. Several other config-urations corresponding to a larger number of poles will be the next step. Our main interest here is concerned with the effect of the exponents a and (3 on the transient response.
(IX. COMMUNICATION RESEARCH)
Other elementary subsequences can be generated by the decomposition
This sequence produces simple RC or RL recording networks. The transient response to the unit impulse is given by
where f{t) -(a-(3-l) (3 aa (a+(3) = (- 1) 2 ? r(a - (3) T (a-(3-1) T
=
2(a+
(3)tMr. F. White has discussed these structures with numerical detail in his M.1. T. MasterIs thesis, "Application of Transitional Transients to Network Design".
It must be noted that the network configurations given above have transmitting prop-erties which are approximately independent of the incoming signal, at least when
(IJ.
+
11)-00. By using similar techniques, networks can be found which transmit fairly well a certain type of signals but do not transmit other signals. This type of network can be synthesized with a smaller number of elements, depending of course on the wave-form of the signal to be transmitted. For example, networks which transmit unit step type signals fairly well, but not necessarily other signals, can be found with a much smaller number of elements than those corresponding to the above-mentioned all pass networks.- S T _ T / S
e. Networks derived from 1 - e and e have the effect of suppressing the transient wave for appropriate values of T . The first function has the tendency to pro-duce pulse type signals. The second has a strong suppression effect for large values OfT. Networks extracted from e- 1/ s can be simply obtained by replacing s by l/s in the last expressions corresponding to the e- s networks. Examples are not included due
to lack of space. k
f. Networks extracted from e(s
+
a) reproduce group and transitional delays. They c an be realized only for a suitable choice of IIa", which depends on n. These networks reproduce only the asymptotic behavior of a certain class of waveforms. These net-works are still under investigation. Some detailed work in this direction is found inMr. White's thesis. M. V. Cerrillo
-65-E. SLIGHTLY LOSSY NETWORKS
Prof. E. A. Guillemin Prof. J. G. Linvill
Compensation for Incidental Dissipation in Network Synthesis
Networks which are essentially lossless are of great importance in network syn-thesis; they are encountered as coupling networks in filters and equalizers and as termi-nating networks in resonators. In design procedures the slightly lossy elements are ordinarily first idealized as lossless, and the effect of the incidental dissipation present is subsequently taken into account. The case of uniform incidental dissipation has been adequately studied. Fig. IX-Z 7 summarizes the pertinent well-known conclusions regarding uniform incidental dissipation.
"D "] "..,,,"""""'"''
(a) EVERY --.f(j()L 15 REPLACED BY ~ Lh Lh oLD. EVERY1t-
15 REPLACED BY\!J
Cf oC MHO ---YV'- 15 STILL ----vvv-RD. RD.Any network function f( >..)
is replaced by f (>..) = f(>.. + a) Z
=
f(>")+ af'(X.) +az
f"(>") + ...(b)
MAPS OF CRITICAL FREOUENCIES
FOR f(h) FOR fe(h) '>'0'-a AOI 0 x X AP2 '>'P2-a - l ( IS REPLACED BY '>'PI Apl-a x x Xp2 "Xp2 -a ~o, 0 ):0'-a (C) (d)
(IX. COMMUNICATION RESEARCH)
These results are simple and are applicable in a number of cases. In many important cases the dissipation is not uniform and a more general result is needed. The method described in the following permits evaluation of the effect of incidental dissipation whether or not it is uniform.
In a network (Fig. IX-Z8) coupling a source and load, element A possesses incidental loss not accounted for in the initial design. To determine the effect of its incidental loss it is convenient to replace the lossy A by the lossless A in series with t.E, a voltage
source of such size that the combination takes the same current as the lossy A. The application of Thevenin's theorem to the remainder of the network supplying A leads to
i
At (LOSSY)i
ZA+ li.ZA OHMS
~ - - - J OR YA+ li.YAMHOS
A (LOSSLESS) ZA OHMS OR
YA MHOS Fig. IX-Z8 Network in which
ele-ment Ahas incidental dissipation.
Fig. IX- Z9 Equivalent circuits employing lossy element or lossless element and voltage source.
the equivalent circuits of Fig. IX - Z9.
One readily determines t.E to be t.Z A ETh/fTh
+
Z A+
t.Z~.
The voltage change at E Z caused by the lossiness of A is t.E Z. This voltage is simply t.E T AZ where T AZ is the transfer function relating output voltage to the voltage of a source in series with A. Finally(1)
In the event that opening element A reduces E
Zto zero (for instance, if element A is a series branch of a ladder network) one readily verifies that E Z for lossless A is
Consequently, the fractional change in response due to lossiness of A is simply
t.EZ _ -L!.ZA
~ - ZTh
+
Z A+
t.ZA(Z)
( 3)
In the event that shorting element A reduces E
Zto zero (for instance, if element A is a shunt element of a ladder network) a similar kind of argument indicates that
(4)
-67-Simple and powerful synthesis procedures have been developed for lossless forms of networks. To make available these procedures to the synthesis of networks with
slightly lossy elements one would like to carry through the synthesis for such networks as if they were lossless. One way in which this can properly be done is to predistort the map of critical frequencies for a lossless form which, when loss is accounted for, results in the desired map of critical frequencies. For instance, if the map of critical frequencies shown in Fig. IX-27d is desired for a network with uniform loss in
inductors and capacitors of loss ratio~, then one can shift all critical frequencies to the right by~, getting the map of Fig. IX-27c. If one synthesizes a lossless network from this map of critical frequencies, then employs loss elements in its construction, the behavior will be as desired. Alternate information for the case of nonuniform dissipa-tion to that given by Eqs. 1, 3, and 4 which is more useful for the technique just men-tioned is the evaluation of shifts in critical frequencies caused by dissipation in an element. Ladder networks, which are of great interest in practical cases, yield very simple results for this attack. In Fig. IX- 30 is shown a ladder network coupling a source and load. That every zero of the transfer function
(5)
is identified with open-circuit behavior of a series element or short-circuit behavior of
Fig. IX- 30 An essentially lossless ladder network coupling source and load.
Fig. IX- 31 Element with incidental loss and the impedance it faces.
a shunt element is well known. Consequently, the position of the zero associated with a given element is the only zero affected by loss in that element. The amount of shift of the zero is easily determined by the shift in frequency required to bring the impedance to zero or infinity for shunt or series elements, respectively. For instance, if an inductor of L henries is a shunt element causing a zero at zero frequency in the transfer function, an associated loss from a series resistance of R
L ohms shifts the zero of the transfer function to - RL/L. This loss associated with the inductance causes no change at all in the other zeros of the transfer function. The shift in poles of the transfer
function resulting from loss in elements is determined from a different approach. Poles of the transfer function occur at complex frequencies at which a sort of resonance occurs. At a pole of the transfer function, one observes that looking across any node-pair of the
(IX. COMMUNICATION RESEARCH)
network one sees an open circuit and at a break in any mesh of the network one sees a short circuit. If one considers the element A in Fig. IX-28, he observes that it faces the impedance ZTh as shown in Fig. IX-31. Element A and ZTh present impedances which are the negatives of each other at every pole of the transfer function for the circuit of Fig. IX-28. A small loss in A changes its impedance by I::-.Z A and changes the pole positions by an amount necessary to make ZTh undergo a change of - I::-.Z A. For small amounts of dissipation one finds the change in location of a pole at A.
1 to be A. - A.- 1 "" I::-.Z A I::-. A.1 = 'd-Z=---:----Th dA. ( 6)
A particular problem of interest is the design of filter networks employing one or two crystals with the remainder of the network consisting of moderately lossy inductors and capacitors. The low-loss crystals can provide extreme rejection and the coils and condensers can be applied to shape the characteristic in less critical frequency regions. The foregoing results indicate that the presence of loss in other elements need not restrict the effectiveness of the crystals, in fact, the different quality elements may behave very well together. A design is now being carried through to verify this result.
J. G. Linvill