HAL Id: hal-02401018
https://hal.laas.fr/hal-02401018
Submitted on 9 Dec 2019
HAL is a multi-disciplinary open access archive for the deposit and dissemination of sci-entific research documents, whether they are pub-lished or not. The documents may come from teaching and research institutions in France or abroad, or from public or private research centers.
L’archive ouverte pluridisciplinaire HAL, est destinée au dépôt et à la diffusion de documents scientifiques de niveau recherche, publiés ou non, émanant des établissements d’enseignement et de recherche français ou étrangers, des laboratoires publics ou privés.
Microstrip Lines Loaded with Metamaterial-Inspired
Resonators for Microwave Sensors/Comparators with
Optimized Sensitivity
J Muñoz-Enano, P Vélez, M. Gil, J. Mata-Contreras, Katia Grenier, David
Dubuc, Ferran Martin
To cite this version:
J Muñoz-Enano, P Vélez, M. Gil, J. Mata-Contreras, Katia Grenier, et al.. Microstrip Lines Loaded with Metamaterial-Inspired Resonators for Microwave Sensors/Comparators with Optimized Sensi-tivity. 49th European Microwave Conference (EuMC 2019), Oct 2019, Paris, France. pp.754-757, �10.23919/EuMC.2019.8910702�. �hal-02401018�
Microstrip Lines Loaded with Metamaterial-Inspired
Resonators for Microwave Sensors/Comparators with
Optimized Sensitivity
J. Muñoz-Enano1, P. Vélez1, M. Gil2, J. Mata-Contreras3, K. Grenier4, D. Dubuc4, and F. Martín1,*
1 CIMITEC, Departament d’Enginyeria Electrònica, Universitat Autònoma de Barcelona, 08193 Bellaterra, Spain 2 Dept. de Teoría de la Señal y Comunicaciones, Universidad Politécnica de Madrid, 28031 Madrid, Spain
3 Departamento de Ingeniería de Comunicaciones, Universidad de Málaga, 29016 Málaga, Spain 4 MH2F, LAAS-CNRS, 7th Avenue du Colonel Roche, 31400 Toulouse, France
*E-mail: [email protected]
Abstract — This paper presents a sensitive comparator/sensor
useful to detect small differences between a reference sample and a sample under test (SUT). The device, a four-port structure, is based on a pair of identical microstrip lines each one loaded with an open split ring resonator (OSRR), the sensitive part of the device. The working principle of the comparator/sensor is mode conversion, caused when the OSRRs are asymmetrically loaded, and the output variable is the cross-mode transmission coefficient. The structure is very sensitive to changes in the complex dielectric constant between the reference sample and the SUT, and it is useful as comparator and sensor in applications such as defect detection, dielectric characterization of solids and liquids, and solute concentration measurements in liquids. The application examples reported in the paper confirm the high sensitivity of the structure to the complex dielectric constant of the SUT, caused by the specific shape of the OSRRs.
Keywords — Metamaterial resonators, microwave sensors,
microstrip technology, open split ring resonators, fluidic sensors. I. INTRODUCTION
Transmission lines loaded with metamaterial-inspired resonant elements have been exhaustively used for sensing purposes. In such sensors, frequency and notch (or peak) magnitude variation [1]-[5], coupling modulation [6]-[12], and frequency splitting [13]-[17], caused by the variable to be sensed, have been the main considered sensing principles. In most of the previously cited works, sensor performance (i.e., dynamic range, sensitivity, resolution, etc.) has been proven to be enough for the intended application. However, there are applications demanding extremely sensitive passive sensors, able to detect small variations in the measurand. Examples are defect detection in solid samples, solute concentration measurement in highly diluted solutions (e.g., electrolytes or glucose content in water, blood, or urine), or monitoring changes in the composition of certain substances (of potential interest, e.g., in wine fermentation processes), among others.
In [18], highly sensitive sensors based on a pair of symmetric transmission lines loaded with mirrored open complementary split ring resonators (OCSRRs) were reported. In that work, the structure was applied to the dielectric characterization of liquids (i.e., mixtures of DI water and
ethanol), as well as to the measurement of diluted concentrations of NaCl in DI water. The working principle in the sensors of [18] is mode conversion, caused by disruption of symmetry. Namely, when the mirrored OCSRRs are identically loaded or unloaded (hence keeping symmetry unaltered), mode conversion is prevented, and the cross-mode transmission coefficient, the output variable, is (ideally) null. Conversely, when one of the OCSRRs is loaded with a sample (the reference -REF), and the other one is loaded with a different sample (the sample under test -SUT), mode conversion arises, and the magnitude of the cross mode transmission coefficient is determined by the level of asymmetry. Thus, these devices are similar to differential sensors, which can be used as comparators (e.g., to detect defects or to monitor changes in the composition of a substance, as compared to a reference), or as sensors useful to determine the properties of the SUT.
Key performance parameters of these sensors based on symmetry truncation are resolution and sensitivity. The former provides the minimum level of the input variable (measurand) that can be detected (or resolved), and it is intimately related to the “quality” of symmetry in the unloaded sensing structure. Sensitivity is defined as the variation of the output variable (magnitude of the cross-mode transmission coefficient in our case) caused by the variation in the input variable (dielectric constant, solute concentration, etc.). For resolution optimization, it is fundamental: (i) to be as much precise as possible in sensor manufacturing, and (ii) to simplify the fabrication process of the sensor as much as possible, circumventing stages that might cause undesired symmetry disruption. Particularly, the use of vias should be avoided (if possible), since these elements may be the origin of potential deviations from (perfect) symmetry.
Contrary to the sensor reported in [18], where vias associated to the OCSRRs were necessary, a novel via-less sensor/comparator based on a pair of microstrip lines, each one loaded with an open split ring resonator (OSRR), is reported in this paper. The sensor exhibits good resolution and high sensitivity, since it has been designed on the basis of an analysis aimed to optimize sensitivity (note that resolution
mainly depends on the accuracy in the fabrication process). In the paper, such sensitivity analysis, based on the lumped element equivalent circuit model, is presented. Then, the sensor is used as comparator, where it is shown that tiny defects in a dielectric sample (as compared to a reference) are detectable. Finally, the functionality of the structure to determine the concentration of solute (NaCl in this work) in highly diluted solutions of DI water (the solvent), is demonstrated. For that purpose, the sensor has been equipped with two fluidic channels, one for the REF liquid and the other one for the LUT (liquid under test). The most relevant aspect in this later case is the resulting sensitivity, by far superior than the one achieved in [18].
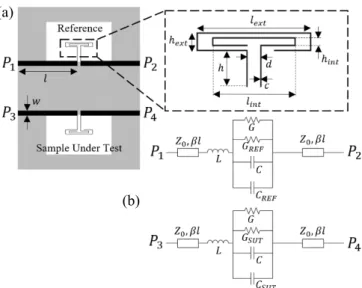
II. THE SENSOR:TOPOLOGY AND CIRCUIT MODEL The topology of the proposed sensor (excluding the fluidic channels and necessary accessories) and the equivalent circuit model are depicted in Fig. 1. Note that the transmission lines are described by distributed elements in the circuit model (i.e., transmission line sections with characteristic impedance Z0
and electrical length 𝛽l, l being the physical length of such lines), whereas the OSRRs are accounted for by means of lumped elements. L, C and G are the inductance, capacitance and conductance, respectively of the unloaded OSRR. The effects of the loading samples are taken into account by means of CREF and GREF,the OSRR capacitance and conductance,
respectively, associated to the REF sample, and by means of
CSUT and GSUT, corresponding to the contribution of the SUT.
Note that the lines (and OSRRs) are deliberately uncoupled. This simplifies the circuit model of the structure, since each half can be treated separately (i.e., lumped elements accounting for an eventual coupling are avoided), which in turn eases the analysis, to be reported latter.
Fig. 1. Topology (a) and circuit model (b) of the proposed sensor. Notice that windows are opened in the ground plane in order to ensure the validity of the proposed equivalent circuit model.
To demonstrate the validity of the model, it suffices to consider one half of the sensing structure. Particularly, we have extracted the parameters by considering a bare (unloaded) OSRR. Figure 2 depicts the transmission coefficient of such
half structure inferred from full wave electromagnetic simulation (using Keysight ADS), compared to the one obtained by circuit simulation. The agreement in the region of interest is good, pointing out the validity of the model.
Fig. 2. Transmission coefficient (magnitude and phase) of the sensor (one half) inferred from circuit and electromagnetic simulation. The considered substrate is Rogers RO4003C with dielectric constant er = 3.38, thickness
h = 1.524 mm, and loss tangent tand = 0.0027. In reference to Fig. 1, dimensions are: l = 40 mm, 𝑤 = 3.4 mm, ℎ = 9.4 mm, 𝑐 = 0.2 mm, 𝑑 = 2 mm, 𝑙'() = 18.4 mm, ℎ'() = 3 mm, 𝑙*+) = 13.4 mm, ℎ*+) = 1.4 mm, 𝑙, = 44 mm and
ℎ, = 26.8 mm. Circuit parameters are: L = 32.6 nH, C = 0.714 pF,
G = 0.079 mS; line parameters are 𝛽l = 83º and Z0 = 50 W..
III. SENSITIVITY ANALYSIS
According to the port designation in Fig. 1, and taking into account that the lines are uncoupled, the cross-mode transmission coefficient is given by
𝑆./01=/.(𝑆./− 𝑆56) (1)
Let us now consider that the characteristic impedance of the lines is identical to the port impedance, Z0 (typically 50 W).
Under these conditions, the effect of the lines is simply a phase shift in the cross-mode transmission coefficient. Since we consider that the output variable is the modulus of that coefficient, the effects of the line can be neglected in the analysis. In other words, the modulus of the cross-mode transmission coefficient is identical to the one of the cross-mode transmission coefficient of the structure by excluding the lines. Such transmission coefficient is thus given by
|𝑆./01| =/.|𝑆./9:;;− 𝑆569:;;| =/.< / />?@AB C?D − / />?EFG C?D < (2) where S21OSRR and S43OSRR are the transmission coefficients
of the individual OSRR-loaded lines that result by excluding the line contribution, and ZREF and ZSUT are the impedances of
the series branches of the individual lines.
Let us now assume that substrate losses are small, that the reference (REF) sample and the SUT are dielectric (i.e. intrinsically low-loss) materials, and that the dielectric constant of both samples (REF and SUT) are similar (a situation of interest in many applications). Let us also evaluate expression (2) at the frequency of maximum transmission for the REF line, given by
wH'I =JK(1>1/
@AB) (3)
At such frequency, ZREF(wref) << Z0 since losses are small
and the effects of the inductive (L) and capacitive (C + CREF)
reactances are cancelled at that frequency. Moreover,
ZREF » ZSUT provided it is assumed that the dielectric constant
0.6 0.7 0.8 0.9 1.0 1.1 1.2 1.3 1.4 -10 -8 -6 -4 -2
0 Eletromagnetic Simulation Schematic Simulation
|S
21| (dB)
Frequency (GHz)
-200 -150 -100 -50 0 50 100 150 200S
21(degree)
(a) (b)of both samples are similar (and consequently CREF » CSUT).
Therefore, the cross-mode transmission coefficient can be approximated by
|𝑆./01|wLMN =5O/
DP𝑍:RS(wH'I) − 𝑍;TU(wH'I)P (4)
Finally, after some tedious (but straightforward) algebra, the real and the imaginary parts of the cross-mode transmission coefficient are found to be:
𝑅𝑒 X𝑆./01wLMNY = KCwLMNC 5OD Z𝐺:RS \ ]1>1@AB 1>1EFG^ − 𝐺;TU \ _ (5a) 𝐼𝑚 X𝑆./01wLMNY 𝐿6w H'I 6 4𝑍d e𝐺:RS \ .(𝐶 + 𝐶;TU). (𝐶 + 𝐶:RS).− 𝐺;TU \ . −(𝐶;TU− 𝐶:RS)(𝐶 + 𝐶;TU) 𝐿(𝐶 + 𝐶:RS) h
where G’SUT = G + GSUT and G’REF = G + GREF.
From (5), it can be concluded that the sensitivity of the modulus of the cross-mode transmission coefficient with complex dielectric constant variations between the REF sample and the SUT (manifested by different values of GSUT
and GREF, and/or different values of CSUT and CREF) increases
with L and wref. If we consider that wref is not a design
parameter (working at high frequencies may represent a penalty in terms of equipment costs), it follows that to increase sensitivity L must be large and, consequently, C must be small.
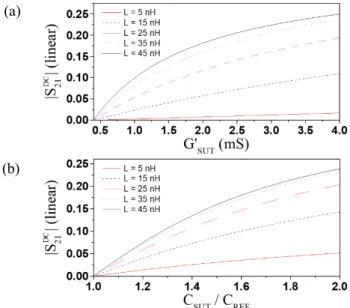
In Fig. 3, the effects of L on |S21DC|wref, for changes in both the capacitance and conductance of the SUT with regard to the REF sample, are depicted. It can be seen that the sensitivity (given by the slope of the curves) increases significantly with
L, as expected.
Fig. 3. Effects of L on the cross-mode transmission coefficient for variations in the conductance (a) and capacitance (b) of the SUT as compared to the REF sample. In (a), CREF and CSUT are identical and fref = wref/2p and G’REF are fixed
to 1 GHz and 0.4 mS respectively. In (b), G’REF and G’SUT are identical and
equal to 0.4 mS and fref is still fixed to 1 GHz. Note that when G’REF and G’SUT
are equal in (a) and CREF and CSUT are equal in (b), the modulus of the
cross-mode transmission coefficient is zero (perfect symmetry case). IV. DESIGN AND EXPERIMENTAL VALIDATION
The OSRRs of the sensor have been designed on the basis of the previous sensitivity analysis. Thus, the objective has
been to implement an OSRR with small capacitance and large inductance, exhibiting a resonance frequency (unloaded OSRR) of 1.05 GHz. The result is the sensor layout depicted in Fig. 1(a). Note that the topology of the OSRRs presents narrow and separated strips, as corresponds to a large inductance and small capacitance.
A. Functionality as Comparator
The first experimental validation (as comparator) has been carried out by considering a slab of Rogers RO3010 with er = 10.2, h = 1.27 mm and tand = 0.0022 as REF sample. It
has been positioned on top of the OSRR of the REF line, and it has been tightened by screws against the substrate in order to eliminate the effects of the air gap. Then, different SUTs have been considered: (i) a SUT identical to the REF sample, (ii) a SUT consisting of a slab of Rogers RO4003C with er = 3.38, h = 1.524 mm and tand = 0.0027, (iii) a SUT
consisting of a slab of FR4 with er = 4.4, h = 1.6 mm and
tand = 0.02, and (iv) SUTs identical to the reference sample, with periodic arrays of holes across the slab to generate a smaller effective dielectric constant, and different density of holes. In all cases, the SUT has been also screwed against the substrate. The measured cross-mode transmission coefficients, depicted in Fig. 4 for the considered cases, reveal that a minimum level of –36.75 dB is achieved for the symmetric case. By contrast, the maximum cross-mode transmission coefficient increases to -9.43 dB for case (ii), whereas for case (iii) the maximum value is found to be –12.08 dB. Finally, for case (iv), the maximum value is found to be –10.83 dB for the sample with higher density of holes (i.e., the difference in the composition of the REF sample and SUT can be perfectly detected).
Fig. 4. Cross-mode transmission coefficient that results by loading the REF and the SUT lines with different solid samples.
B. Solute concentration measurements
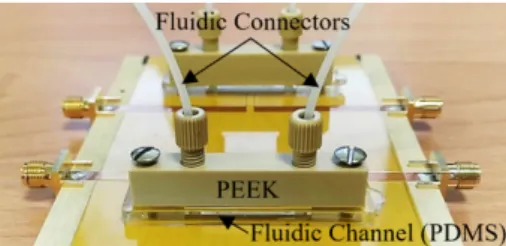
The second experimental validation has been focused on the determination of NaCl concentration in DI water. Thus, the REF sample is pure DI water, whereas the SUT (or liquid under test –LUT- in this case) is the solution of NaCl in DI water. Obviously, it has been necessary to add fluidic channels with the corresponding accessories to fix the channel to the substrate and to inject the liquids (by means of a syringe) in the corresponding channels. The picture of the device is shown in Fig. 5, where channel dimensions and other details of the structure are provided (see caption).
(5b)
(a)
Fig. 5. Photograph of the sensor including fluidic channels and accessories. The fluidic channels, made of polydimethylsiloxane (PDMS), have dimensions:26 mm (length), 4.6 mm (width), 1.5 mm (height). Such channels are covered by polyether ether ketone (PEEK) to provide mechanical stability. The measured cross-mode transmission coefficient (magnitude) for different NaCl concentrations is depicted in Fig. 6, whereas the maximum value as a function of the solute content can be seen in Fig. 7. The minimum level of NaCl concentration that can be resolved is 0.25 g/L, similar to [18]. The sensitivity increases as the concentration of NaCl decreases, and the maximum value is found to be 0.0216 (g/L)-1, superior than the one obtained in [18] [0.0092 (g/L)-1].
From the results of Fig. 7, a calibration curve, providing a correlation coefficient of R2 = 0.9934, has been obtained:
[𝑁𝑎](𝑔/𝐿) = 0.43337𝑒s P:CtuvPwxy d.d/z{z | + 0.00998𝑒s P:CtuvPwxy d.d//zz | − −0.17264𝑒s
‚ECtuv‚wxy D.Dtƒ„„ |
− 0.35567 (6) This curve can be obtained to determine the concentration of NaCl in DI water from the measurement of the cross-mode transmission coefficient.
Fig. 6. Cross-mode transmission coefficient for different NaCl concentrations.
Fig. 7. Maximum cross-mode transmission coefficient with NaCl content. V. CONCLUSION
A novel differential sensor based on the measurement of the cross-mode transmission coefficient in a pair of OSRR-loaded lines has been presented. From a simple analysis, based on the equivalent circuit model, it has been concluded that
sensitivity increases with the inductance of the OSRR. Consequently, the fabricated sensor has been designed with a large inductance and low capacitance. The functionality of the sensor as comparator and for the measurement of small concentrations of NaCl in DI water has been demonstrated.
ACKNOWLEDGMENT
This work was supported by projects TEC2016-75650-R and 2017SGR-1159, and by FEDER funds. P. Vélez acknowledges MICINN for JdC fellowship, ref. IJCI-2017-31339. J. Muñoz acknowledges Secreteraria d’Universitats i Recerca (Gen. Cat.) and European Social Fund for the FI grant.
REFERENCES
[1] A. Ebrahimi, W. Withayachumnankul, S. Al-Sarawi, D. Abbott, “High-sensitivity metamaterial-inspired sensor for microfluidic dielectric characterization,” IEEE Sensors J., vol. 14, pp. 1345−1351, May 2014. [2] M. S. Boybay and O. M. Ramahi, “Material characterization using
complementary split-ring resonators,” IEEE Trans. Instrum. Meas., vol. 61, pp. 3039−3046, Nov. 2012.
[3] C.-S. Lee and C.-L. Yang, “Complementary split-ring resonators for measuring dielectric constants and loss tangents,” IEEE Microw.
Wireless Compon. Lett., vol. 24, pp. 563−565, Aug. 2014.
[4] C.-L. Yang, et al., “Noncontact measurement of complex permittivity and thickness by using planar resonators,” IEEE Trans. Microw. Theory
Techn., vol. 64, pp. 247−257, Jan. 2016.
[5] L. Su, et al., “Analytical method to estimate the complex permittivity of oil samples”, Sensors, vol. 18, p. 984, 2018.
[6] J. Naqui, M. Durán-Sindreu and F. Martín, “Novel sensors based on the symmetry properties of split ring resonators (SRRs),” Sensors, vol 11, pp. 7545−7553, 2011.
[7] J. Naqui, et al., “Alignment and position sensors based on split ring resonators,” Sensors, vol. 12, pp. 11790−11797, 2012.
[8] A.K. Horestani, et al., “Displacement sensor based on diamond-shaped tapered split ring resonator,” IEEE Sensors J., vol. 13, pp. 1153–1160, 2013.
[9] A.K. Horestani, et al., “Rotation sensor based on horn-shaped split ring resonator,” IEEE Sens. J., vol. 13, pp. 3014–3015, 2013.
[10] J. Naqui et al., “Transmission lines loaded with bisymmetric resonators and their application to angular displacement and velocity sensors,”
IEEE Trans. Microw. Theory Techn., vol. 61, pp. 4700–4713, 2013.
[11] J. Naqui and F. Martín, “Angular displacement and velocity sensors based on electric-LC (ELC) loaded microstrip lines,” IEEE Sensors J., vol. 14, pp. 939–940, Apr. 2014.
[12] A.K. Horestani, et al., “Two-dimensional displacement and alignment sensor based on reflection coefficients of open microstrip lines loaded with split ring resonators,” Elec. Lett., vol. 50, pp. 620–622, Apr. 2014. [13] A. K. Horestani, et al., “Two-dimensional alignment and displacement
sensor based on movable broadside-coupled split ring resonators,”
Sensors and Actuators A, vol. 210, pp. 18–24, Apr. 2014.
[14] J. Naqui, et al., “Transmission lines loaded with pairs of magnetically coupled stepped impedance resonators (SIRs): modeling and application to microwave sensors,” IEEE MTT-S Int. Microwave Symp., Tampa, FL, USA, Jun. 2014, pp. 1–4.
[15] L. Su, et al., “Splitter/combiner microstrip sections loaded with pairs of complementary split ring resonators (CSRRs): modeling and optimization for differential sensing applications,” IEEE Trans. Microw.
Theory Techn., vol. 64, pp. 4362-4370, Dec. 2016.
[16] P. Vélez, et al. "Microwave microfluidic sensor based on a microstrip splitter/combiner configuration and split ring resonators (SRR) for dielectric characterization of liquids", IEEE Sensors J., vol. 17, pp. 6589-6598, Aug. 2017.
[17] A. Ebrahimi, et al, "Differential sensors using microstrip lines loaded with two split ring resonators," IEEE Sensors J., vol. 18, pp. 5786-5793, Jul. 2018.
[18] P. Vélez, et al., “Highly-sensitive microwave sensors based on open complementary split ring resonators (OCSRRs) for dielectric characterization and solute concentration measurements in liquids”,
IEEE Access, vol. 6, pp. 48324-48338, Dec. 2018.
0.1 0.2 0.3 0.4 0.5 -40 -30 -20 -10 0 DC |S 21 | (dB) Frecuency (GHz) 80 g/L 10 g/L 0.5 g/L 60 g/L 5 g/L 0.25 g/L 40 g/L 2.5 g/L 0.125 g/L 20 g/L 1 g/L reference (0 g/L) 0.00 0.02 0.04 0.06 0.08 0.10 0.12 0.14 0 20 40 60 80 Measured
Calculated using eq. (6)
[NaCl] (g/L)