Characterization of Turbine Rim Seal Flow and its
Sealing Effectiveness
by
Peter T. Catalfamo
B.S. Aeronautical and Mechanical Engineering
Rensselaer Polytechnic Institute (2008)
MCHiW
MA SSACHUSETTS INSiftE
OF TECHNOLOGY
JUL 19 2013
LIBRARIES
Submitted to the Department of Aeronautics and Astronautics
in partial fulfillment of the requirements for the degree of
Master of Science in Aeronautics and Astronautics
at the
MASSACHUSETTS INSTITUTE OF TECHNOLOGY
June 2013
©
Massachusetts Institute of Technology 2013. All rights reserved.
Author ... , ... .
Department of Aeronautics and Astronautics
May 23, 2013
Certified by . ... ... .. .... ... ...
Choon S. Tan
Senior Research Engineer of Aeronautics and Astronautics
/
I
I IThesis Supervisor
Accepted by...
,. .
Eytan H. Modiano
Professor of Aeronautics and Astronautics
Chair, Graduate Program Committee
Characterization of Turbine Rim Seal Flow and its Sealing
Effectiveness
by
Peter T. Catalfamo
Submitted to the Department of Aeronautics and Astronautics on May 23, 2013, in partial fulfillment of the
requirements for the degree of
Master of Science in Aeronautics and Astronautics
Abstract
In a gas turbine engine, ingestion of hot gas from the flowpath into the gaps between the turbine rotor and stator can lead to elevated metal temperatures and a deteri-oration of component life. To prevent ingestion, bleed air from the compressor is used to "purge" the rim seal cavities. Establishing a quantitative understanding of the wheelspace and rim cavity flow processes driving ingestion is critical to optimiz-ing seal design and minimizoptimiz-ing the associated performance penalty. A computational model of the wheelspace that does not limit the spatial or temporal scales of flow pro-cesses is formulated. This allows the assessment of the response of the wheelspace to external stimuli set up by the turbine main flow path, and the development of causal links between flow processes and their drivers. Varying the axisymmetric turbine flowpath pressure on a quasi-steady basis when the purge flow supply seal is choked has no impact on ingestion; the pressure field in the wheelspace merely scales with the flowpath pressure, leaving the flow structure unchanged. Introducing circumferential variation in the external pressure field can, however, lead to ingestion with the ratio of disturbance wavelength to the trench depth emerging as a key parameter. Varying rotational speed alone does not drive ingestion as a stagnation point is formed on the outer shroud that is ingestion resistant. It is shown that excitation at frequencies corresponding to the natural modes of the wheelspace system can lead to large re-sponses in pressure and seal flow rate, with the seal reduced frequency appearing as a characterizing parameter. The existence and parametric dependence of these modes is further assessed through a small disturbance flow analysis. A generalized small disturbance flow analysis is formulated that provides a direct enumeration of the key characterizing parameters.
Thesis Supervisor: Choon S. Tan
Acknowledgments
The work presented here would not have been possible without the support and guidance of a great number of people, among them teachers, colleagues, family, and friends. I am deeply grateful for their help and would like to use this opportunity to recognize them.
First I would like to thank my advisor, Dr. Choon Tan. His encouragement and guidance has been invaluable to the progress of this research. His frequent advice and good-humored encouragement to think outside of the box has forced me to greatly expand my base of knowledge and change the way I think. He consistently urged me to avoid over-constraining my thoughts, a valuable lesson that I hope to continue to improve upon. I greatly look forward to even more such learning and growth through continued work with him. He has truly been a great teacher.
I have also benefitted greatly from the input of my colleagues at General Electric.
The program sponsors, Dr. Kevin Kirtley and Ben Ding of G.E. Power and Water have monitored progress and given suggestions and encouragement throughout the process. Their insight and experience ensured the steady progress of this research in
what is hopefully a beneficial direction. Dr. Pepe Palafox of G.E. Global Research whose experience in the area, especially regarding wheelspace experiments, has made him another great resource.
I would like to extend special thanks to Dr. Greg Laskowski of G.E. Aviation who has, through numerous formal and informal discussions guided me greatly throughout the course of the research. His great wealth of knowledge on the mechanics of CFD modeling, especially regarding wheelspace modeling, has been an amazing resource. His consistent support and encouragement throughout has been the source of much inspiration and cannot be overstated.
I would also like to greatly thank the leadership of the Aviation thermal systems
design organization, Tim Stone of G.E. Aviation, Beth Schumacher of G.E. Avia-tion, and my immediate manager Jordan Schwartz also of G.E. Aviation for their continued support throughout. Having representatives of both the industrial and
avi-ation sectors has highlighted the importance of this research across a great range of applications.
Many thanks to General Electric for sponsoring and funding this research through a research contract with MIT and for supporting my studies through its Advanced Courses in Engineering program.
Lastly I would like to thank my family who have supported me in everything from the beginning. My parents have always encouraged me to grow intellectually and have been a source of constant support throughout my education. A special thanks to my wife, Kelly, who has quietly put up with many long nights in the GTL, and continues to encourage me despite this.
Contents
1 Introduction 15
1.1 Literature Review . . . . 17
1.2 O bjectives . . . . 18
1.3 Contributions and Findings . . . . 19
1.4 Thesis Organization. . . . . 21
2 Research Approach 23 2.1 Incremental Modeling . . . . 24
2.2 Modal Analysis . . . . 27
2.3 Summary of Research Approach . . . . 27
3 Computational Analysis 29 3.1 Methodology and Setup . . . . 29
3.2 R esults . . . . 33
3.2.1 Steady Axisymmetric . . . . 34
3.2.2 Unsteady Axisymmetric . . . . 41
3.2.3 Steady Circumferentially Periodic Pressure Field . . . . 47
3.2.4 Unsteady Circumferentially Periodic Pressure Field . . . . 51
3.3 Overall Summary . . . . 53
4 Small Disturbance Analysis 55 4.1 Generalized Formulation . . . . 56
4.2.1 Solid Body Rotation without Throughflow . . . . 59
4.2.2 Without Rotation(=3 = 0) . . . . 62
4.2.3 Comparison to Experimental Data . . . . 63
4.2.4 Overall Summary . . . . 64
5 Summary and Conclusions 67 5.1 Sum m ary . . . . 67
5.2 Key Findings . . . . 68
6 Future Work 71
A Small Disturbance Analysis Derivation 75
B Unsteady Velocity Response to Downstream Pressure Fluctuations as a Function of Reduced Frequency 79
List of Figures
1-1 Illustration of canonical rim seal configurations . . . . 16
2-1 Illustration of canonical wheelspace configuration and nomenclature . 25 2-2 llustration showing the trench cavity in relation to rotor and turboma-chinery components. . . . . 26
3-1 Computational Domain . . . . 30
3-2 Close up of the rim seal geometry modeled, a canonical radial seal. 30 3-3 Mesh in the rim seal region . . . . 32
3-4 Results of the grid sensitivity study. . . . 33
3-5 Streamlines and pressure field contours for Re, = 0. . . . . 35
3-6 Streamlines and pressure field contours for Req = 2.5 x 10⁶ . . . .. 36
3-7 Streamlines and pressure field contours for Re, = 1.1 x 10⁷ . . . . . . 36
3-8 Specific Entropy Flux vs. Rotational Speed . . . . 38
3-9 Contours of viscous entropy generation for ReD = 2.5 x 10⁶. . . . . . 39
3-10 Modified seal geometry: no axial overlap . . . . 40
3-11 Streamlines with increasing rotational speed with no axial overlap. . . 40
3-12 Helmholtz resonator spring-mass analogy. . . . . 42
3-13 Pressure Response to Axisymmetric External Oscillation. . . . . 45
3-14 Mass-Flow Response to Axisymmetric External Oscillation . . . . 46
3-15 Velocity perturbation due to fluctuation in the exit pressure for a straight duct as a function of reduced frequency. . . . . 46
3-16 Decay of pressure disturbance as a function of the ratio of depth to N G V pitch. . . . . 48
3-17 Contours of "Hot Gas" ingestion for shallow and deep trenches. . . . 49
3-18 Ingestion Ratio vs. Pressure Amplitude . . . . 50
3-19 Flow Response to the ratio of phase velocity of the circumferentially periodic wave to the rotor speed. . . . . 52
3-20 Seal velocity response with varied swirl rate . . . . 52
4-1 Variation of 3, vs.
#3
for k=3 circumferential mode . . . . 614-2 Sketch of Annulus . . . . 62
4-3 Computed mode shape (pressure) for k = 3, n = 1 . . . . 64
List of Tables
1.1 Table of Characteristic Parameters and Typical Ranges based on re-view of published literature . . . . 18 3.1 Calculated Helmholtz frequencies of the Trench and Wheelspace Cavities 43 4.1 Comparison of Experimental and Predicted Frequencies for "Mercedes
Nomenclature
Non-Dimensional Characterizing Parameters
AI? Wheelspace aspect ratio
AC, Flowpath disturbance pressure coefficient <h Turbine stage loading coefficient
C, Non-dimensional cooling mass flow
Gc Seal clearance ratio
Re, Reynold's number in main flowpath
Reg Rotational Reynold's number
Resea Reynold's number in seal
Ro Rossby Number
Subscripts and Superscripts
* Non-Dimensionalized
Indicates Disturbance Quantity
e Exit
i Ingested
p Purge
~ Indicates Mean Flow
Variables Q w p a b c, k Lt n Nb Nv p S T U U V v w Angular Velocity Disturbance Frequency Density Speed of Sound Rim Radius
Specific Heat at Constant Pressure
Circumferential Wave Number
Seal Thickness
Radial Wave Number
Number of Blades Number of Vanes Pressure Specific Entropy Temperature Radial Velocity
Characteristic Radial Velocity
Characteristic Tangential Velocity
Tangential Velocity
Chapter 1
Introduction
Gas turbine engines have become an ubiquitous technology, having uses in a great number of applications including power generation, land and marine transportation, and aviation propulsion. Natural gas plants (i.e. gas turbines) will make up nearly
75% of the increase in net capacity of new power plants to be built between 2012
and 2016, according to a report compiled by the US Energy Information Agency
[1]. In nearly every application of gas turbines, from industrial power generation to
aircraft engines, fuel cost is a major driver of operator profit margins and therefore fuel economy of the generator (or engine) is a critical metric. Rising fuel prices and
growing environmental concerns have only made efficiency more important.
To achieve these ever higher efficiency goals the turbine inlet temperature has steadily risen over the past several decades such that modern turbines operate well above the melting point of available metal alloys. The flowpath components that see this temperature directly are typically made of exotic alloys capable of withstand-ing high temperatures (well beyond their meltwithstand-ing point) and incorporate advanced cooling technologies (e.g., convective and film cooling and thermal barrier coatings). Those components outside of the flowpath (e.g., rotor disks and structural compo-nents), however, are not capable of tolerating these elevated temperatures. Due to the requirement that one part be rotating and one stationary, there are by necessity gaps in the flowpath to allow relative motion. Ingress of the hot flowpath air through these gaps into the wheelspace cavity can lead to rapid deterioration of these less
Unsealed Axial Radial-Single Radial-Double Figure 1-1: Illustration of canonical rim seal configurations. Shown from left to right,
unsealed wheelspace, a simple axial seal, seal with a single radial clearance, and a seal with two radial clearances. These represent the typical configurations found in gas turbine applications
capable parts' lives and premature failure.
To prevent this, "cool" air is bled off of the late stages of the compressor and used to pressurize the cavities between the rotor and stator and "purge" the gaps in the flowpath. Seals upstream of the wheelspace are used to control the amount of air supplied for purging the flowpath gaps.
The use of this purge flow, however, negatively impacts cycle efficiency. Work is done compressing the air in the compressor but, since the air does not pass through the combustor and is not properly turned prior to entering the rotor row, less work can be extracted from it. There are also mixing losses associated with the reintro-duction of the air into the flowpath, which negatively impacts turbine efficiency[14]. Therefore, in the drive to improve efficiency there is a strong desire to reduce the purge flow necessary to prevent adverse impacts due to ingestion. The amount of purge flow required to prevent ingestion has been found to strongly depend on the configuration of the rim seal (the interface between rotor and stator hubs). Fig. 1-1 shows illustrations of several commonly used rim seal geometries. Studies have shown that radial seals tend to be more effective than axial seals.
The goal of this research is to identify the flow processes driving ingestion and limiting sealing effectiveness.
1.1
Literature Review
Flow in gas turbine wheelspace cavities has been an active area of research dating back to the early days of the jet age. Notably in the 1950s, Batchelor and Stewartson published seminal papers on the structure of flow in rotor stator cavities in different regimes. Batchelor contended that any radial flow is confined to the boundary layers on the rotor stator surface and that the system is characterized by an inviscid core in solid body rotation [2]. Stewartson argued that there was no such core and that the flow more gradually transitioned between rotor and stator [13]. Experiments have since shown both Batchelor and Stewartson were correct, with the flow approximating Stewartson behavior at low rotational speed and Batchelor type flow at higher speeds. Daily and Nece [3] categorized the wheelspace cavity flow regimes as function of rotational Reynolds number and rotor-stator spacing.
Since these foundational findings on rotor-stator wheelspace flow, the gas turbine industry has placed much focus on finding an optimal sealing configuration. A great number of experimental studies have been performed by Owen et. al [9][10][11][12], leading to a number of papers with a focus on developing orifice-type models. While these models have found use in direct design applications, they are limited in their generality by the geometry and configurations tested.
More recently, in the past decade or two, increasing attention has been given to computational studies of turbine rim cavity flow, such as those performed by Jakoby
[6], Laskowski [8], Hills [5], and others. These studies have largely consisted of sector
models of engine geometry, including the flowpath components. While this type of computational model has usefulness in showing the detailed flow field in true-to-product configurations, its utility for elucidating the drivers of key flow features is limited. The primary difficulty arising from these complex models is the challenge of assigning cause and effect to the emergence of flow features or phenomena. Because of their complexity, there are numerous effects induced by the main turbine and wheelspace flowpaths that impact ingestion; separating these out and distinguishing what specific design feature is driving it is difficult. Furthermore, the sector model
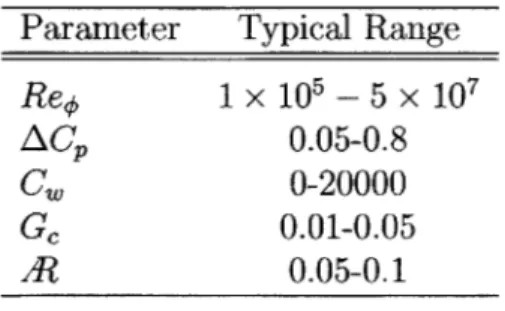
Table 1.1: Table of Characteristic Parameters and Typical Ranges based on review of published literature
Parameter Typical Range
Rep 1 x 10⁵ - 5 x 10⁷
AC, 0.05-0.8
CW 0-20000
Gc 0.01-0.05
A? 0.05-0.1
excludes flow features with length scale larger than the sector.
Through these previous research efforts several characterizing parameters, both geometric and fluid dynamic, have been identified and explored. Table 1.1 provides a brief overview of these parameters and the typical ranges reported in the literature. These parameters include the rotational Reynolds number, the non-dimensional purge flow rate, and several geometric characterizations.
1.2
Objectives
This research seeks to build on this body of work and expand the knowledge of the key drivers of ingestion and characterizing parameters in a form that can be applied generally. A review of the problem and existing literature leads to several overarching research questions.
1. What role do rim cavity modes and flow unsteadiness play?
2. What drivers limit the sealing effectiveness of rim seals?
3. What are the required attributes of CFD to adequately capture ingestion phe-nomena?
4. What are the sources of loss, and how are they linked to sealing effectiveness?
5. What sets the acceptable ingestion level before adversely impacting part life or
This thesis does not attempt to address all of these questions but recognizes them as the final goal. The research described in this thesis focuses on the top two questions regarding the drivers of sealing effectiveness and the role of resonance (i.e. Excitation of the wheelspace cavity modes) and flow unsteadiness.
1.3
Contributions and Findings
A computational model for turbine annular wheelspace flow is formulated. The model
allows for the analysis of wheelspace flow behavior in response to the pressure field in the turbine main flowpath. This pressure field is set by the turbine nozzle guide vane and rotor stage design. This assumption that the turbine flowpath pressure field is essentially independent of the wheelspace makes it computationally tractable to model the full 3600 wheelspace. As such the model does not restrict the spatial or temporal scales of the induced flow processes in the cavity as a sector model does. Furthermore the model enables the establishment of specific cause-and-effect. Specifically, the computational model has been used to elucidate the following findings:
1. The assumption of constant (choked) supply flow has implications for the
quasi-steady response of the wheelspace flow structure. With the inlet flow choked variations in the absolute level of the downstream pressure cause the wheelspace pressure field to scale up or down, but the flow structure and amount of purge flow remains the same. Because of this, quasi-steady variations in the axisym-metric pressure field do not lead to ingestion while the seal remains choked.
2. Circumferential variation in the external pressure field can lead to ingestion. This was assessed by imposing a periodic variation around the circumference of the rim. These studies identified the ratio of disturbance wavelength to trench depth as an important characterizing parameter.
3. Over a range of rotational Reynolds numbers of interest in gas turbines ingestion
could not be driven for a steady axisymmetric turbine flow path pressure field
formation of a stagnation point on the shroud. The flow that is pumped up the rotor boundary layer and impinges on the outer shroud thus generating a local high pressure zone at the seal that resists ingestion.
4. Varying the purge flow rate, with an axisymmetric external pressure field, did not lead to the onset of ingestion. As was shown in the case of varying rotational speed, it appears there needs to be another driver, such as a non-axisymmetric external pressure field, to drive ingestion on a quasi-steady basis.
5. Unsteadiness and, in particular, resonance (the excitation of cavity modes)
could have a significant impact on sealing effectiveness. An unsteady axisym-metric pressure field in the turbine main flow path induces strong responses in both pressure and seal mass flow rate when frequencies corresponding to those of the natural cavity modes are imposed in the turbine main flowpath.
wLt
It also suggests that the seal reduced frequency, defined as the ratio of Useal
the characteristic convection time through the seal to the unsteady timescale, is a characterizing parameter for ingestion. The influence of resonance on rim cavity sealing has not to this author's knowledge been addressed in the pub-licly available literature. Characterizing the natural modes of the system is an important step towards understanding an aspect of ingestion response.
6. An unsteady non-axisymmetric pressure field in the turbine main flow path,
similar to the steady circumferential variation, can lead to ingestion. In this case, however, the ratio between the phase speed of the pressure field and the swirl in the wheelspace is an important parameter. This has been discussed in the literature and was confirmed in these studies.
A generalized small disturbance analysis of turbine wheelspace flow has been
for-mulated for direct determination of eigen frequencies and associated eigen modes. The analysis also provides an alternative means to assess the unsteady non-axisymmetric flow disturbances in the wheelspace with a characteristic mean flow (radial swirling throughflow and temperature non-uniformity) in response to the pressure imposed by
the turbine flow path. We inferred from the analysis the following non-dimensional characterizing parameters for the cavity modes:
Qb
1. The rim mach number:
--2. The ratio of characteristic radial throughflow velocity to the characteristic
tan-U
gential velocity: .
3. The ratio of tangential velocity to rim speed: b
*Qb
U
4. The ratio of radial throughflow velocity to rim speed. Qb
UV
5. The product of the tangential and radial throughflow Mach numbers: -2
R2
6. The non-dimensional mean radius of the wheelspace: b bb 7. The compactness ratio based on the disturbance frequency:
-8. The ratio of the disturbance phase speed to the disk rotating speed:
These parameters come directly from the non-dimensionalization but it should be noted that they are not all independent (e.g. items 3 and 4 can be combined to yield 2).
For the situation of simple wheelspace flow consisting of no mean flow with non-rotating discs, the analysis shows the existence of a three-harmonic circumferential rotating modes in accord with experimental measurements. The addition of rotation also shows the existence of these modes, but with higher frequencies corresponding to a stiffening of the system.
1.4
Thesis Organization
In chapter 2, an overview of the research approach is presented. This chapter attempts to lay out the thought process and reasoning behind the methodology chosen for
answering the research questions. A brief outline of each of the major aspects of the approach taken is given.
Chapter 3 describes the computational modeling. This expands on the basic approach detailed in chapter 2 and gives a detailed description of the modeling and results. Similarly chapter 4 details the small disturbance analysis carried out and results to date. Chapters 5 and 6 summarize the findings and detail future work to continue the research initiated in this thesis.
Chapter 2
Research Approach
As was described in section 1.1, previous research efforts have primarily focused on developing correlative models that can be used directly in the design of turbine rim seals. This largely involved running tests on various configurations and developing empirical models to describe when ingestion would occur in that configuration. This approach leaves much of the design space unexplored however and the models de-rived from them is limited in its applicability to the configurations tested. The effort described here seeks to avoid this lack of generality by linking flow features to the spe-cific physical events driving them. The goal of this is to identify the non-dimensional parameters that control the sealing effectiveness of a canonical seal configuration. Two complementary approaches were taken. A series of computational simulations
(using the commercial package CFX) of increasing level of physical complexity were undertaken to establish parametric trends and to develop links between effect (e.g. ingestion) and cause (e.g. a specific flow feature). This is described in section 2.1. Along with these CFD studies, a small disturbance flow analysis was used to develop an analytical tool for identifying the natural modes of a canonical wheelspace cavity. This modal analysis is described in section 2.2.
2.1
Incremental Modeling
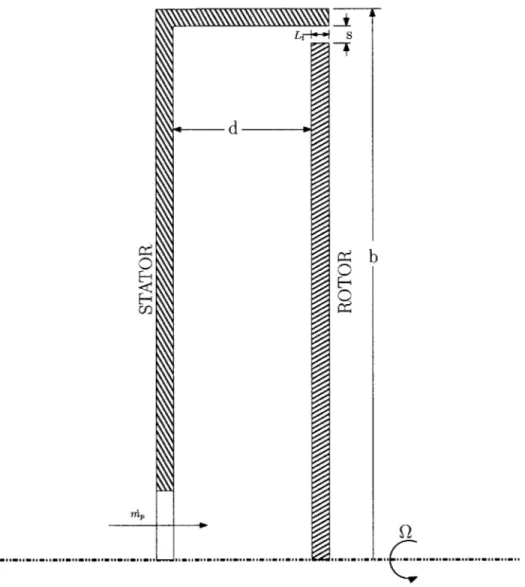
The wheelspace and rim cavity constitutes a rich aero-thermal environment with complex geometric features. In a model that includes all of this complexity it can be difficult to assign with any rigor the emergence of a flow phenomenon to any one driver. In order to disentangle these drivers and be able to assign causal relationships an incremental approach was adopted. In starting with an extremely simple geometry, with simple boundary conditions, and adding complexity on an incremental basis we can see the incremental effect each addition has on the flow field and sealing effectiveness. Fig. 2-1 shows the simplified wheelspace configuration and dimensional nomenclature that will be used throughout this thesis.
One key differentiating feature of the approach taken here to previous numerical analyses is the treatment of the flowpath. The purge flow for a given rotor-stator cavity is typically on the order of 1% of the flow in the main gas path [8] [7]. As a result, the pressure field in the main flow path can be assumed to be fairly insensitive to the details of the rim seal cavity and purge flow itself. This has large implications for modeling. If the main flowpath pressure field can be approximated as insensitive to the details of the purge flow cavity, the two problems can be decoupled. This is the approach taken here, it is assumed that the main flowpath pressure field is essentially set by the design of the flowpath hardware (turbine/nozzle aerodynamics). This fixed pressure field can now be directly used as a boundary condition for the wheelspace flow model.
In eliminating the need to compute the flow through the main flowpath, a great amount of computational resources have been freed up. All of the resources that were previously dedicated to blade/nozzle/flowpath modeling can now be allocated to assessing the wheelspace aerothermal flow physics.. Previous modeling efforts, because they almost universally include explicit modeling of the flowpath, have been limited to small sector models. While a sector model is computationally efficient it has the downside of restricting the periodicity of modes that can be modeled. Modes of longer wavelength than the sector, such as the low order modes which some
S
Or
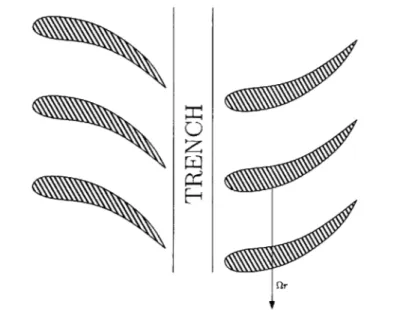
Figure 2-2: Illustration showing trench cavity in relation to rotor and turbomachinery components.
experiments have shown to exist [6], may be important, or modes that do not match the periodicity of the sector can be suppressed. The elimination of the flowpath allows for a full 3600 model without prohibitive computational cost.
Further, the flowpath boundary condition can be decomposed into a superposi-tion of harmonic modes generated by the various flowpath components as shown in equation 2.1.
00 00
p (r, 0, x, t) = E
Q
(r, x) einNbyt-i(kN+nNb)O (2.1)n=-oo k=-oo
While what is shown in equation 2.1 includes only the effects of the blade and nozzle rows depicted in Fig. 2-2, this framework can be extended to include any periodic pressure field, such as that generated by the shedding wakes off of the nozzle, any lower frequency modes such as that caused by casing out of round. This approach fits naturally with the overall research approach of incremental assessment. By re-ducing the flowpath pressure field to a superposition of harmonics, we can assess each contributing factor one by one, building them on top of each other until we reach a pressure field representative of the engine configuration.
2.2
Modal Analysis
One of the primary goals of this research is to identify the role of resonance in
wheelspace cavity flows and its importance in ingestion. To do this a detailed char-acterization of the response to stimuli must be developed. While this could be ac-complished through extensive computational modeling. A simpler direct method for determining the natural frequencies and modes of canonical wheelspace configurations is desired.
To accomplish this a small disturbance flow analysis was carried out to generate a tool capable of identifying the natural modes and frequencies. There are a number of advantages to this approach. First, computational studies can be costly to run in both time and resources and are cumbersome for effective parametric studies. The simplicity of the small disturbance model on the other hand allows it to be useful for effective parametric assessments.
Along with this, the analytical formulation allows the key controlling parameters to become immediately obvious in the equations themselves. Finding these param-eters through computational studies alone would not be as direct. The form of the resulting equations generated can also give insight into the impact of these parameters on the flow physics, something which would be difficult with computational studies alone.
The basic approach consists of developing the equations of motion for a charac-teristic system, linearizing these, and then solving the resulting eigenvalue problem. This is detailed in chapter 4.
2.3
Summary of Research Approach
The approach taken to begin addressing the research questions posed in chapter 1 is based on computational analysis of incremental levels of physical complexity that is representative of turbine wheelspace cavity flow. A computational model is used to map out the parametric dependencies governing ingestion. Through progressive
implementation of complexity into the model, causal relationships can be established. The computational model.is complemented by an analytical small disturbance model for determining the natural frequencies and mode shapes of a canonical wheelspace geometry as well as for directly establishing ingestion criteria.
Chapter 3
Computational Analysis
The rapid advancement of computing technology in the past decade has made detailed unsteady computational modeling an increasingly useful research tool. Described here is the development of a 3-D computational model of a canonical wheelspace and rim cavity seal using the commercial CFD software ANSYS CFX version 14.5.
3.1
Methodology and Setup
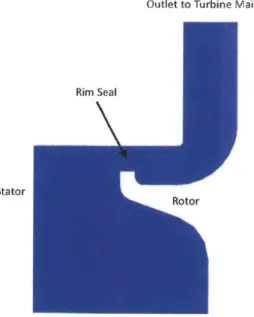
The wheelspace/rim cavity system is a complex system of seals and interrupted cavity geometries containing swirling radial outflow with potentially large rim-bore gradi-ents; as such the resulting aero-thermal environment provides a fertile ground for flow phenomena. In order to model the system efficiently in a way that can tractably be un-derstood it must be reduced to a simpler system. To accomplish this, the wheelspace cavity is represented as a simple smooth walled rotor/stator system with a constant axial gap. A canonical radial seal geometry typical of industrial gas turbines was used. A representative computational domain can be seen in figure 3-1.
In a gas turbine, amount of purge flow supplied is controlled by a seal or series of seals that meter the amount of air bled off of the compressor. These seals are often, though not always at or near choked conditions. To translate this into the compu-tational model, the inlet boundary condition was set as a stagnation pressure (this pressure is essentially fixed by the design of the compressor and the bleed location) at
Outlet to Turbine Main Flow Path
o
0 Lin
Purge Flow Inlet
I
Figure 3-1: Computational domain
Outlet to Turbine Main Flow Path
Stator
Figure 3-2: Close up of the rim seal geometry modeled as a canonical radial seal.
the inlet with a restriction (i.e. a throttle) to meter the flow. In many of the numeri-cal studies in literature the inlet boundary condition is set as a fixed mass flow to give direct control over the amount of purge flow. While this is convenient it is limited
by not allowing the flow rate to respond to changes in the cavity. The stagnation
pressure/restriction area boundary provides a much more physical condition at the inlet which allows the steady and unsteady response of the supplied purge flow rate to react to pressure field changes within the cavity.
The outlet boundary condition is specified as an opening condition with a specified static pressure field along the wheel space flow exit slot. The opening is used in place of an outlet boundary due to the presence of combined inflow/outflow at the boundary. In the analyses shown here any inflow is assumed to enter normal to the outlet (i.e. purely radially). This simplifies the formulation of the boundary condition but does leave out the potentially important impact of ingested swirl from the main flowpath. As one of the goals of the research was to assess the flow response to different imposed pressure fields this simplification was deemed justifiable on a physical basis. This is
an assumption that needs to be further addressed in future work.
The rotor and stator surface boundary conditions are defined as smooth, adiabatic walls with the rotor surface rotating at a specified speed.
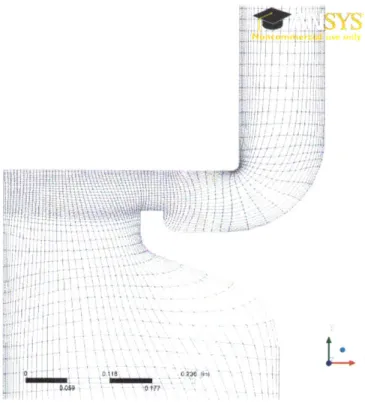
The success of any flow computation is largely dependent on the quality of the mesh used. A baseline structured mesh consisting of approximately 3 million cells was created using Pointwise version 17. This mesh was designed to provide maximum resolution near the rim seal which is the primary area of interest and also the location where the most complex phenomenon are expected. Figure 3-3 shows the mesh in the region of the rim seal.
The boundary layer resolution was designed to be sufficient for a wall-function approach with y+ values of 10 - 30. The steady simulations were run until RMS
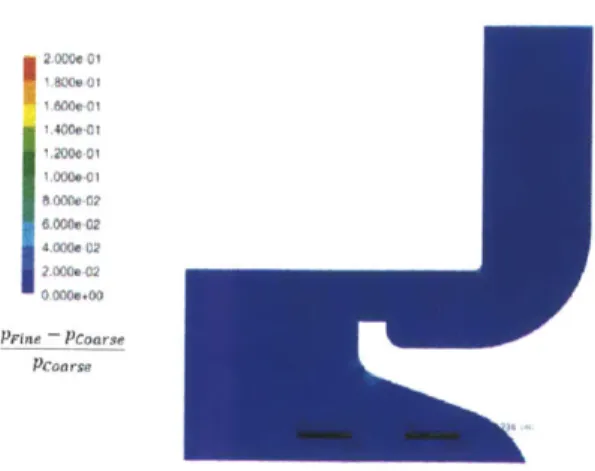
residuals converged to less than 1 x 10⁻⁶. A grid sensitivity study was performed using a mesh of 1.5 times the grid density, and one with half the grid density. This study was performed on the baseline steady simulation and the resulting pressure fields were compared. A contour plot of the normalized difference in pressure between
Figure 3-3: Mesh in the rim seal region
the baseline grid resolution and the fine grid resolution are shown in figure 3-4. This clearly shows that between the baseline grid and the fine grid the pressure field is unchanged over the vast bulk of the domain with only minor differences in regions of high gradients. Based on this the baseline grid was determined to provide sufficient resolution for the purposes of this analysis.
As the focus is on unsteady and resonant response, a number of transient sim-ulations were performed. To ensure the accuracy of the unsteady simsim-ulations the timestep was selected for each case to reach convergence within 2-5 coefficient loop
iterations, and chosen such that the RMS Courant number was approximately equal
to 1. The transient simulations were run using converged steady solutions as initial conditions. Simulations were continued until the transients resulting from the initial conditions had diminished to a negligible level. This was confirmed through monitor-ing test points measurmonitor-ing the pressure field upstream and downstream of the seal, as well as the mass flow rate through the seal.
2.00M 01 0800e 01 I OOe 01 4200O 01 000o041 4,000e 02 2AW4,0002 00000.00 Pine - Pcoarse Pcoarse
Figure 3-4: Results of the grid sensitivity study. Contours of the percent difference in
pressure between the fine and coarse grid. The peak differences occur in regions of rapid transition (sharp corners etc.) where pressure gradients are expected to be high. Maximum difference is less than .1%.
outlet boundary conditions, rotational speed, and select geometrical features on the flow field within the cavity. These studies and their results are described in the following section.
3.2
Results
The following sections discuss the results of a series of assessments on the impact of various design variables on ingestion. The basic flow is in line with the overall research approach, each variable is assessed individually and complexity in the boundary con-ditions is added incrementally. We begin with assessments of the impact of design variables such as rotor speed, purge mass flow, and seal configuration subject to a steady axisymmetric turbine main path pressure field. This provides for the assess-ment of the influence of these parameters alone on ingestion. The turbine main flow path pressure field is then assumed to be circumferentially periodic, but still steady, representative of an NGV row and the impact on ingestion is assessed. This approach is continued with the assessment of the impact of a rotating, circumferentially peri-odic, boundary condition representative of a blade row. The results of these studies
is described in the following.
3.2.1
Steady Axisymmetric
The studies described in this section were performed using a steady, uniform axisym-metric pressure distribution at the outlet (i.e. no axial or circumferential variation). The results contained here are from steady state analyses. The goal of these studies was to assess the parametric impact of rotational speed and outlet pressure level on the wheelspace pressure/flow field and its ingestion characteristics.
Rotational Speed Parametric Study
In this study the rotational Reynolds number was varied from Re, = 0 to Re =
1 x 10⁷ by varying the rotational speed of the rotor. All other boundary conditions and
the geometry remain fixed. The non-dimensional mass flow supply was C, = 7250,
which represents a typical intermediate flow rate corresponding to 0.8% of core flow for the configuration examined.
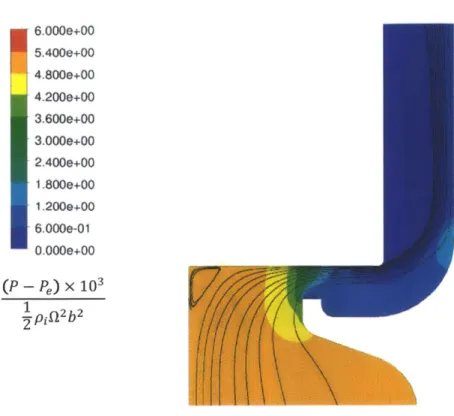
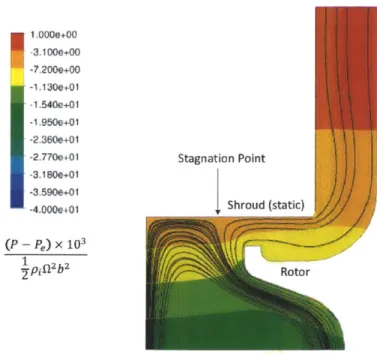
Contour plots of the pressure field with streamlines superimposed at three rota-tional speeds are shown in figures 3-5 through 3-7. From this analysis it was shown that over a range of rotational Reynolds number of interest in gas turbines, ingestion could not be driven under these conditions by varying rotational speed alone. A key feature preventing such ingestion is the formation of a radial stagnation point on the shroud. This results from the impingement of the flow that is pumped up along the rotor onto the shroud, the radial outflow splits at this stagnation point, with a portion of the flow turning aft and going out through the seal, and a portion turning forward and returning as radial inflow along the stator surface. As a result of this stagnation point there is a high pressure zone right at the seal that prevents ingestion. As long as the stagnation point exists and there is a non-zero purge flow entering the wheelspace system ingestion is not possible on a steady basis by continuity.
As the rotational speed is increased, the stagnation point tends to move aft towards the seal. If the flow coming off the rotor were to be fully turned such that it did not
6.000e+00 5.400e+00 4.800e+00 4.200e+00 3.600e+00 3.000e+00 2.400e+00 1.800e+00 1.200e+00 6.000e-01 0.000e+00 (P - Pe) X 103 1 p Afn2b2
Figure 3-5: Streamlines and pressure field contours for Re4> = 0. There is no rotation, and
no stagnation point in the seal region can be seen.
impinge on the shroud surface it would enable ingestion to occur along the top surface. This was not observed in any of the computations to date. The radius of curvature of the streamlines coming off the rotor is set by the ratio of the fluid inertia (i.e. pumping velocity due to rotor) to the pressure drop across the seal. If the resulting radius of curvature is greater than the clearance there would be no stagnation point and one could infer an inflow and hence ingestion as a possibility, this would require a large pressure gradient across the seal however which would tend to oppose ingestion. The variation of loss generation with rotational speed was also assessed. A quan-titative measure of loss generation in terms of entropy generated in the wheelspace is used. The entropy generated due to irreversibilities can be directly linked to a loss in the ability to do useful work. Since the overarching goal of this research is improvement of the efficiency of the machine, this measure of lost work is particularly
1 .000e+01 7.000e+00 4.000+00 1.0000+00 -2.0000+00 -5.0000+00 -8.0000+00 -1.1000+01 Stagnation Point 4. 400e+01 -1.7000+01
2.000e+01 Shroud (static)
(P - pe) x 103
7pifzbz Rotor
Figure 3-6: Streamlines and pressure field contours for Re.1= 2.5 x 10⁶. A radial stagnation
point is formed on the outer surface of the shroud due to the circulatory now structure in the wheelspace. 1.000e+00 -3.1000+00 -7.200e+00 1.130e+01 -1.540e+01 -1.950e+01 -2.360e+01
-2.770e+01 Stagnation Point
-3.180e+01
-3.590e+01
-4.000e+01 Shroud (static)
(P - Pe) X 103
.pi2bz Rotor
Figure 3-7: Streamlines and pressure field contours for Rep = 1.1 x 10⁷. The stagnation
useful.
To determine entropy generation, a control volume is drawn around the system.
If we measure the entropy flux into and out of the system, the generation rate must
be the difference between these two:
m0utsut in m =Sgen (3.1)
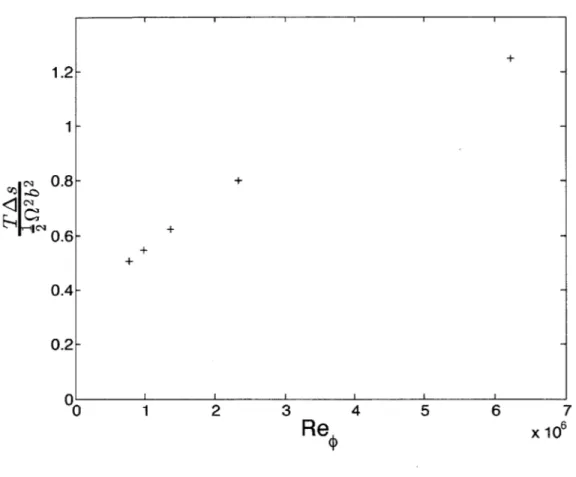
Evaluating this for the rotational speeds examined, the non-dimensionalized entropy generation rate is plotted against rotational Reynolds number in Fig. 3-8. This chart shows a steady increase in entropy generation with rotational speed.
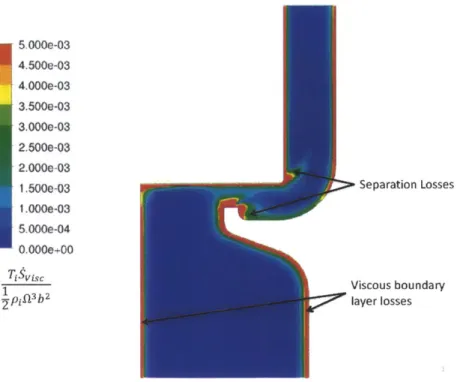
To examine the sources of loss, a plot of local viscous entropy generation rate is shown in Fig. 3-9. This contour plot shows clearly the large entropy generation (read loss) generated in the rotor boundary layer, there is also noticeable generation in the separation zones off sharp edges in the seal region. This finding that the bulk of the entropy generation is contained in the rotor boundary layer is consistent with the findings of Fig. 3-8. The shear stress in the boundary layer increases with rotational speed (as the velocity difference between rotor surface and core increases) and thus the entropy generation due to viscous dissipation would also be expected to increase with rotational speed. This is exactly what is shown in Fig. 3-8.
Response to Varied Mass Flow
The net purge flow rate is the key parameter of interest and as such the impact of varying massflow rates is of interest. To assess this impact the steady, uniform axisymmetric model was run with varying supplied mass flow rates.
The results of this study were similar to those of the rotational speed. As the mass flow was decreased the stagnation point described above tended to move closer to the seal. Still, as in the rotational speed study, no ingestion was observed for any value of supplied mass flow rate, this further implies that rotation alone cannot drive ingestion in a radial seal configuration, some additional driver such as circumferential variation of the flowpath boundary condition must also be present.
1.2- 1-I 0.8 lq 0.6 - 0.4- 0.2-0 1 2 3 4 5 6 7
Re,
x10Figure 3-8: Specific Entropy Flux vs. Rotational Speed. Steady increase in entropy
5.000e-03 4.500e-03 4.000e-03 3.500e-03 3.OOOe-03 2.500e-03 2.00e-03 1.500e-03 1.000e-03 5.000e-04 0.000e+00 1 Tivisc pjinl3b2 Separation Losses Viscous boundary layer losses
Figure 3-9: Contours of viscous entropy generation for Re4, = 2.5 x 10⁶. The primary regions of entropy generation are in the rotor/stator boundary layers and in the seperation zones.
Response to Reduced Axial Overlap of Seal
Another parameter of interest is the axial overlap of the shroud over the seal tooth. To assess the impact of variation in overlap, the flow situation with the minimum overlap, (i.e. the edge of the seal tooth and the edge of the shroud are line-on-line) is analyzed. This geometry is shown in Fig. 3-10.
The results were similar to the baseline case examined (with overlap). As before, a radial stagnation point is formed on the shroud wall preventing ingestion, as the speed increases this stagnation point moves aft along the stator. In no cases among the cases analyzed did the stagnation point move outside of the seal. Streamlines for several rotational speeds are shown in Fig. 3-11, elucidating the movement of the stagnation point as rotational speed is increased.
No Axial Overlap
Figure 3-10: Modified seal geometry: no axial overlap
Vt
(a) Reg = 3.89 x 10⁶ (b) Reg = 5.84 x 10⁶
I-(c) Re0 = 1.18 x 10⁷
Figure 3-11: Streamlines with increasing rotational speed, no axial overlap.
Wheelspace Cavity Flow Response to Externally Imposed Pressure
A quantitative assessment of the response of wheelspace flow to the exit static pressure
level was also performed. In the assessment the outlet pressure is first taken to be uniform and axisymmetric. The steady state model was analyzed for a series of static pressure levels to assess the impact of varying the "DC" pressure level. This study showed that the pressure field inside of the cavity is simply scaled by the outlet pressure ratio. This is true as long as the supply seal remains choked. While the seal is choked, the mass-flow through the system is fixed, regardless of backpressure. The pressure gradients in the cavity itself result from the radial throughflow (which is fixed) and the rotation rate in the cavity, which is independent of the pressure level. For a choked supply seal, the flowfield is therefore independent of the backpressure level. The implication of this is that ingestion cannot be driven by a quasi-steady raising of the backpressure.
Summary of Key Findings for Imposed Axisymmetric Pressure Field
Several specific results of engineering interest can be inferred for flow situations with steady axisymmetric backpressure. First, in a radial seal configuration, a radial stag-nation point is set up where the flow that is pumped up the rotor impinges on the outer shroud. This creates a local high pressure zone at the seal that is ingestion resistant.
Second, with the inlet flow choked, varying external pressure level (on a quasi-steady basis) will not lead to ingestion. The absolute value of the pressure field in the cavity scales up or down with the external pressure but the flow structure remains the same.
3.2.2
Unsteady Axisymmetric
We now proceed to assess the response of wheelspace cavity flow when it is subjected to a uniform, axisymmetric back-pressure that is varying with time. The input fre-quency applied is sinusoidal. The frefre-quency was varied over a range from 0 to several
L AX
k
V
(a) A Helmholtz resonator (b) Analogous spring-mass model Figure 3-12: Helmholtz resonator spring-mass analogy.
times the blade passing frequency.
The wheelspace and rim seal system has a number of characteristics in common with a canonical Helmholtz resonator (Fig. 3-12). A Helmholtz resonator consists of a large open plenum (the wheelspace) with a narrow "neck" (the rim seal). A key assumption of the Helmholtz resonator is that the pressure is uniform throughout the plenum at all times. This requires that the plenum be acoustically "compact", i.e. that the wavelength of the harmonic oscillation be much longer than the characteristic length of the plenum.
An analogy can be drawn between a Helmholtz resonator and a mass spring os-cillator. The capacitance of the plenum provides the stiffness, k, and the air in the neck the mass. A schematic of this analogy can be seen in Fig. 3-12. Writing out the equations of motion yields the familiar mass-spring system equation for simple harmonic motion, equation 3.2.
m.
z
-kx (3.2)Assuming isentropic disturbances, and using the assumption that the pressure inside the plenum is uniform at all times, the capacitance of the plenum (k in equation 3.2)
Table 3.1: Calculated Helmholtz frequencies of the Trench and Wheelspace Cavities Cavity -a Trench 72 Wheelspace 10.7 is given by equation 3.3. p&2 A2 k = A (3.3)
The mass in the neck is simply m - pAL. Combining these in equation 3.2 yields
a second order ordinary differential equation, equation 3.4 describing the Helmholtz resonator.
-2A
LV (3.4)
Solving for the eigenvalues of this equation gives the natural frequency of oscillation as.
wA (3.5)
Equation 3.5 provides a simple means of predicting the natural frequency of a Helmholtz resonator. It is important to note that in actuality the inertia of the "mass" element is greater than simply the mass in the neck. This is because in its oscillation the air must also move the air just inside and outside the neck. This is often corrected using an "effective" length of the neck rather than the physical length. In this analysis the physical neck length is used as the purpose is not obtaining an exact number, but rather identification.
The trench cavity can also be viewed as a Helmholtz resonator. The rim seal again forms the neck, and the outlet of the trench can be considered as being effectively closed by the main-path streamlines. This forms a Helmholtz resonator. The non-dimensional Helmholtz frequencies for the two cavities is shown in Table 3.1.
The results of this study are shown in figures 3-13 and 3-14, which show the pressure response just downstream of the seal, and the massflow response through the
seal respectively. The results in figure 3-13, a plot of pressure amplitude normalized
by the pressure amplitude at the exit vs. frequency normalized by the calculated
Helmholtz resonance frequency of the trench cavity, show that there are several large resonances. One such resonance occurs at the calculated value of trench Helmholtz frequency = 1 and another, smaller amplitude resonance, occurs near the calculated Helmholtz frequency of the wheelspace.
It is clear that the pressure field responds to the cavity natural modes, the natural follow up question is how the flow through the seal responds to this fluctuation in pressure field. Figure 3-14 shows the amplitude of oscillation in massflow rate (essen-tially velocity response) through the seal plotted vs. the reduced frequency of the seal which is defined as L where U U = -PA seal. As can be seen from figure 3-14, there is a strong flow response to the high frequency resonance, and with the reduced frequency lowered from unity to vanishing values the flow response again increases. This be-havior can be explained by examining the role of reduced frequency in unsteady flow in a channel. In essence, the seal can be viewed as an annular duct, for the purposes of this analysis we assume that the upstream (wheelspace) total pressure is fixed. A detailed derivation of equation 3.6 is given in Appendix B.
v' i#3 - 1 -- = 3-(3.6)
P-1+)#2
PU
This is plotted in Figure 3-15. It is clear from this figure that as the reduced frequency is increased, the magnitude of the velocity response to the pressure fluctuation de-creases to zero. In other words at some point the pressure field is oscillating so quickly that the inertia of the fluid cannot respond. At low values of reduced frequency how-ever, the mass flow responds directly (quasi-steadily) to the pressure perturbation. Looking back at figure 3-14, we can see that the high frequency massflow response is minimal except at or near the resonance condition. At reduced frequencies below unity however it begins to increase again, this corresponds to the region where it begins to respond quasi steadily.
10 10 0 10-1 0.10 1.00 W WO,trench
Figure 3-13: Pressure Response to Axisymmetric External Oscillation. The crosses
rep-resent the calculated values. The dashed line reprep-resents the frequency response of an un-damped Helmholtz oscillator corresponding to the wheelspace cavity. Similarly the solid line represents an undamped Helmholtz oscillator at the trench frequency. The CFD results show strong pressure response at both calculated Helmholtz Frequencies.
~I~;
<1<
± CFD Results Trench Helmholtz -- - Wheelspace Helmholtz /I' +4 -++'I
0 0.5 1 1.5 2 2.5 3 3.5 4 4.5
3seal
Figure 3-14: Mass-Flow Response to Axisymmetric External Oscillation
Re
7--1
0
)3
00
03 '3='Im
U -7}
-0.5
Figure 3-15: Velocity perturbation due to fluctuation in the exit pressure for a straight duct as a function of reduced frequency.
Summary
The results of this study demonstrate that unsteadiness can significantly impact seal-ing. At cavity resonance frequencies (such as Helmholtz) amplification of pressure field oscillations can lead to large amplitude oscillations of massflow through the seal (i.e. ingestion). This calls for the need to quantify the role of all the potential cavity modes on hot gas ingestion into the wheelspace.
3.2.3
Steady Circumferentially Periodic Pressure Field
We next assess the response of the wheelspace cavity flow to a steady, circumferentially periodic outlet pressure. This pressure field is representative of the influence of a row of stationary nozzle guide vanes (NGVs). The key parameter of interest in this study is the NGV spacing which defines the wavelength (A) of the disturbance and the amplitude of the pressure variation in the circumferential direction.
Through the study it was found that this pressure disturbance can cause ingestion across the seal if it is strong enough at the location of the seal. In order to drive inges-tion across the seal the maximum pressure disturbance amplitude just downstream of the seal must exceed the dynamic pressure in the seal (i.e. downstream static pressure higher than upstream total pressure). Understanding what sets the strength of the pressure disturbance downstream of the seal is therefore critical.
The key parameter in determining this disturbance was found to be the ratio of the trench depth to the disturbance wavelength. This decay is shown in figure 3-16, and is in accord with the theoretical decay rate based on the solution of the Laplace equation. The pressure disturbance downstream of the seal can therefore be primarily viewed as a function of the parameter L where L is the trench depth.
The impact of this on sealing effectiveness can be seen in Fig. 3-17a and Fig.
3-17b which show contour plots of "hot gas" concentration. This is computed by
creating a tracer property which is convected with the flow and has a value of 1 ("hot gas" only) at the outlet and 0 ("cold gas" only) at the inlet. Intermediate values therefore represent mixes of hot and cold gas. It is clear from these figures that in the
0 0.05 0.1 0.15 0.2 0.25
b
Figure 3-16: Decay of pressure disturbance as a function of the ratio of depth to NGV pitch for three different NGV spacings. By casting in terms of the ratio of depth to NGV pitch, the three curves collapse and exhibit exponential decay.
"deep trench case" corresponding to a value of j A 0.26 there is no hot gas ingested
across the seal whereas with = 0.16 there is. Both cases have the same amplitude
of pressure disturbance at the outlet.
A more comprehensive study combining variation in the amplitude of the outlet
pressure variation as well as the disturbance wavelength was also performed. Three wavelengths (corresponding to 24, 48, and 64 vanes) were examined at 4 values of disturbance pressure amplitude. The results of this study are shown in Fig. 3-18 which shows the ratio of the ingested massflow to net purge flow plotted against an estimate of the pressure amplitude at the seal. Based on the results discussed above, the amplitude of the disturbance is assumed to decay as the solution to Laplace's equation, i.e.
AC, = ACe- r (3.7)
And, recognizing that for a periodic disturbance linked to the NGVs, A = 2, The
HGTracer HGTracer H~ I HGml *1.0000+00 1.0000+00 9.0000-01 9.0009-01 8.000e-01 8.000e-01 7.0000-01 7.000e-01 50000-01 5.0000-01 4.000e-01 M A4.000Le-01 3.000e-01 3.000e-01 2.000e-01 m M2.000e-01 1.0000-01 1.0000-01 0.0000e+1 .00e+00
(a) "Deep" Trench, .26 (b) "Shallow" Trench,
4=.16
Figure 3-17: Contours of "Hot Gas" ingestion for shallow and deep trenches.ACp, = AC. e- (3.8)
Under the assumption that the ingestion ratio is a function of the magnitude of the pressure disturbance just downstream of the seal this is therefore used as the abcissa of figure 3-18. The figure demonstrates that using this method, the data from the three different wavelengths collapses to nearly the same curve. The functional dependence of the ingestion ratio can thus be cast in terms of the pressure variation amplitude immediately downstream of the seal and the ratio of trench depth to the vane pitch. The slight variation is likely due to the effect of swirl and curvature. We have assumed here that L << 1, i.e. a rectilinear (rather than annular) flow domain
with no mean flow.
Summary of Key Findings
Circumferential variation in the external pressure field can lead to ingestion, whether this occurs is dependent on the amplitude of the disturbance pressure and the ratio of the trench depth to the wavelength of the disturbance which sets the magnitude of this pressure disturbance downstream of the seal. In other words, the ingestion ratio is functionally dependent on the disturbance wavelength and the imposed pressure disturbance amplitude.
2.5 + Nv=24 x Nv=48 * Nv=64 2- 1.5-+ 1-x 0.5-* + x 0x* 0 0.5 1 1.5 2 2.5 ACe-*N
Figure 3-18: Ratio of ingested mass flow to net purge flow as a function of pressure amplitude with 24, 48, and 64 vanes