Publisher’s version / Version de l'éditeur:
Journal of Thermal Insulation, 14, July, pp. 43-57, 1990-07
READ THESE TERMS AND CONDITIONS CAREFULLY BEFORE USING THIS WEBSITE. https://nrc-publications.canada.ca/eng/copyright
Vous avez des questions? Nous pouvons vous aider. Pour communiquer directement avec un auteur, consultez la première page de la revue dans laquelle son article a été publié afin de trouver ses coordonnées. Si vous n’arrivez pas à les repérer, communiquez avec nous à [email protected].
Questions? Contact the NRC Publications Archive team at
[email protected]. If you wish to email the authors directly, please see the first page of the publication for their contact information.
NRC Publications Archive
Archives des publications du CNRC
This publication could be one of several versions: author’s original, accepted manuscript or the publisher’s version. / La version de cette publication peut être l’une des suivantes : la version prépublication de l’auteur, la version acceptée du manuscrit ou la version de l’éditeur.
Access and use of this website and the material on it are subject to the Terms and Conditions set forth at
Thermal performance of sprayed polyurethane foam insulation with
alternative blowing agents
Kumaran, M. K.; Bomberg, M. T.
https://publications-cnrc.canada.ca/fra/droits
L’accès à ce site Web et l’utilisation de son contenu sont assujettis aux conditions présentées dans le site
LISEZ CES CONDITIONS ATTENTIVEMENT AVANT D’UTILISER CE SITE WEB.
NRC Publications Record / Notice d'Archives des publications de CNRC:
https://nrc-publications.canada.ca/eng/view/object/?id=2ad99552-26e9-40dc-ad9b-7ab960a7ea5d https://publications-cnrc.canada.ca/fra/voir/objet/?id=2ad99552-26e9-40dc-ad9b-7ab960a7ea5dS e r
T H 1N 2 1 d
National Research Conseil national
n.
1 6 9 5+r(
c.2
'
ouncil Canada de recherches CanadaBLDG.
'
Institute for lnstitut de- - - Research in recherche en
Construction construction
Thermal Performance of
Sprayed Polyurethane Foam
lnsulation with Alternative
Blowing Agents
by M.K. Kumaran and M.T. Bomberg
A N A L Y Z E D :
Reprinted from
Journal of Thermal Insulation Vol. 14
July 1990 p. 43-57
(IRC Paper No. 1695)
NRCC 32365
-
N R C-
C I S T II R C
.'%L I B R A R Y
S
APR ?
1Fr3-! _LAfin d'evaluer la performance thermique B long terme de six mousses de polyurethane fabriquks avec le msme polym&re mais des agents de glonflage differents, on s'est servi d'une methodologie d'essais utilisant des courbes resistance thermique-temps etablies B partir de minces tranches de mousse, ainsi que la technique de mise B echelle visant A determiner le temps de vieillissement en fonction de l'epaisseur de l'echantillon. Les agents de gonflage qui ont Ct6 employes sont : CFC-I1 avec 0, 0,5, 1,O ou 1,5 % d'eau et HCFC-123 ou HCFC-141b.
Sauf dans le cas des mousses fabriquks avec CFC-I1 et 1,O ou 1,5 -- - -. -
-
--
% d'eau,pour lesa---" - "-:t plus grand que
ne peuf mousses de
polyure \u HCFC-141 b
ont affi le A celle des
Thermal Performance of Sprayed
Polyurethane Foam Insulation with
Alternative Blowing Agents
M.
K.KUMARAN
ANDM.
T. BOMBERG
Building Pevfrmance Section Institute for Research in Construction
National Research Council Canada Ottawa, Ontario, Canada K I A OR6
ABSTRACT: A test methodology that uses thcrmal resistance-time curves deter- mined on thin slices of the foam and the scaling technique to relate aging time to the specimen thickness, was applied to evaluate long-term thcrmal performancc of six polyurethane foams manufactured with the same polymer but different blowing agents. The blowing agents employed were: CFC-11 with 0, 0.5, 1.0 or 1.5% water and HCFC-123 or HCFC-14lb.
Except for foams manufactured with CFC-11 and 1.0% or 1.5% of water, for which material inhomogeneity was higher than can be tolerated by the proposed test methodology, polyurethane foams manufactured with CFC-11 and 0.5% water, HCFC-123 and HCFC-141b showed long-term thermal performance similar to that of CFC-11 blown materials.
INTRODUCTION
I
T IS CURRENTLY believed that chlorofluorocarbons (CFCs) used as blow- ing agents in gas-filled cellular plastics (foams) contribute to the depletion of earth's ozone layer. Therefore, as accorded in the Montreal Protocol, foam industry should be prepared to phase out the use of these blowing agents. The industry is left with very few options. As an interim solution the amount of CFC may be reduced by mixing with water ( w h c h reacts with the isocyanate part of the system to produce carbon dioxide as an additional blowing agent). In future, however, blowing agents other than C F C must be used. Two hydrochlorofluorocarbons (HCFC), viz. HCFC-123 and HCFC- 141b have been identified as alternative blowing agents for polyurethanefoarn insulation. lluring the past few ycars a n u ~ n b e r of rcsCarch prc~jects were initiated [ I ] to cvaluatc the c f i c t of blowing agent rcplaccmcnt on selected aspects of pcrfornlanc.~ of gas-illled hanis. O ~ i c such project was jointly undertaken by thC Society of I'lastics Industry and the l~istitiltc for Itcscarch in Construction, NliC Canada 131. The objective of this projcct was to cvaluatc long-tcr~n thermal pcrfc>rmancc of sprayed polyurcthanc foams produced with alternative blowing agents and comparc it to that of products blown with CFC-I 1.
A generic p o l y i ~ r c t h a n ~ sprdy 131 was dcvclopcd to rcprcsc.nt current coni- mcrcial foam systems and six foam products wcrc prepared by changing only the blowing agent. The blowing agents used wcrc: CFC-11, HCFC- 133, HCFC-14lb, CFC-I I with 0.5'%) watcr, CFC-I I with 1.0'%) watcr and CFC-I I with 1.5'X) watcr. The foam blown with CFC-I I alone, i.c., that rcprcscnting a typical, comnicrcial, sprayed polyurctha~ic foam, was called "Uasc 88." To comparc various aspccts of pcrhrmancC of thcsc foams, the following nicasurcnicnts were carried out:
1 . Thermal rcsistancc
3. Change in thcrnial rcsistancc with time
3. Water vapor pcrnzcancc 4. Dinlcnsional stability
5. C o m p r c ~ s i v ~ strength
6. Nitrogen diffusion cocfiiicnt
The findings from the above investigation were presented in detail in a report submitted to the Society of Plastics Industry 131. O n e important aspect of the invcstigation was the application of the slicing and scaling methodology [4,5] that predicts a design thcmial resistance value for any re-
quired long-term period, c.g., 15 or 25 ycars. This paper brictly presents this I
test nlcthodology and the results of its application to foams with the six
1
blowing agents.!
THE TEST METHODOLOGY
1
The tcst niethodology cmploycd in this work comprisc3 two different types of thermal measurements:
1. To establish mean value and variability in the initial thermal resistance of the product
2. To establish time-dependent effects in thermal resistance o f the product The measurements of the first type are performed using the standard ASTM test methods C 518 or C 177 on full boards (or thick material layers) to test a large volume o f the product. The measurements of the second type are performed o n thin material layers (slices) and involve testing o f the same
T h r m a l Pevformancc, 4 S p r a y e d Pulyure~hane Foam insulation 45 specimen over an extended period of time to establish the dependence of thermal resistivity on the aging period. Moreover, thermal resistivity (R- values) determined on these slices as a function of time are presented in rela- tion to the initial R-values of the material (normalized curves).
Initial Thermal Resistivity
Usually the initial thermal resistivity is established from measurements on full thickness of the product using a large (e.g., 61 cm square) Heat Flow Meter (HFM) apparatus. In thls work 25 mm thick test specimens were cut from the sample and tested on an HFM apparatus using ASTM C518 test method. As thls measurement reflects the variability in the manufacturing of the material, appropriate statistical techniques must be applied to ensure that the mean value of thermal resistivity is representative of the product. More- over, care must be taken to ensure that the age and aging conditions of these specimens were similar, e.g., all initial thermal resistivity measurements were, in this work, performed on specimens between 7 and 14 days old.
Slicing and Scaling Technique
Based on the assumption that the sprayed polyurethane foam sample may be regarded as a homogeneous material, one may test thin layers of material and extrapolate results to any desired thickness. Measurements on thin spec- imens shorten the duration of aging tests as well as reduce the variation in material properties within the test specimen. Hence the experimental part of the methodology includes preparation of thin test specimens, measurement of their thickness and determination of the changes in thermal resistivity with time, denoted here as "the aging curve." In the present investigation, ag- ing took place under laboratory conditions.
Then, the aging curve established on a thin specimen can be transformed into that corresponding to the required material thickness by means of the scaling technique [4]. Application of the scaling technique is based on the following argument. Aging process is known to be largely due to the flow of components of air into the test specimens and outflow of the blowing agents. It is assumed that these transport processes are represented by simple diffusion equations; i.e., rate of diffusion is directly proportional to the gra- dient of partial pressure for each gas under consideration. Then, if one has two homogeneous specimens of thickness L, and L2, they will reach the same level of aging at time t , and t2 which are proportional to the second power of these thicknesses. Therefore,
The material thickness in Equation (1) represents the characteristic path OK the diffusion processes and is equal to the geometrical thickness less thC thickness of the open cells at the specimen surface. Thus, two new concepts must be introduced. The "thickness of the destroyed surface layer" (TDSL) denotes an equivalent thickntxs of the open cells at the specinwn surface, and the thickness L, o r L2 in Equation (1) is called "the effective thickness" (ET) of the material layer.
EFFECTIC'E THICKNESS OF T H E .11=1TERIA4L L.-I\'ER
There is a snlall fraction of open cells in cach "closed cell foam." This frac- tion may be increased during the preparation of a thin layer for testing. For this reason, the concept of TDSL was introduced [6] as the difference be- tween geometrical and closed-cell volumes divided by the surface area of the specimen. The E T is then calculated by subtracting twice the TDSL value from the measured average specimen thickness.
REFERENCE THICKNESS
Statistical considerations require that the aging curve representing a prod- uct is established on the basis of thermal resistivity-time curves determined for a number of specimens. The thickness of each of them varies from one another. While Equation (1) may be used to recalculate the aging curves from one thickness to another, it is more convenient to use the reference thickness as the basis of comparisons. Following the international proposal initiated by Sweden [S] the reference E T is chosen to be 10 mm.
REFERENCE AGING CURVE
Though it is assumed that foam samples are homogeneous, in practice this is never achieved. Hence, the aging curves calculated for the reference thick- ness using experimental data on several test specimens from the same Sam- ple, instead of being a unique and well-defined curve, will be a family of curves, with some displacement from one another. One way t o arrive at a reference aging curve for the sample is to average all the calculated curves for the reference ET
In this work, however, the curve with the lowest long-term thermal resis- tivity was chosen as the reference aging curve. This is, as will be evident later on, to guarantee a minimum thermal performance for the sample tested. Furthermore, if one has to compare the thermal resistivity of several foam samples it is convenient to normalize the results.
NORMALIZED REFERENCE AGING CURVE
To normalize the results, cach value of thermal resistivity on the selected aging curve (reference aging curve) is divided by its initial thermal resistiv-
Thermal PruJ;,vmanci, of Sprayed Polyuri,thani~ Foam Insulation 4 7 ity. Since the R-value of a thin slice changes rapidly, for all practical pur- poses, the initial R-values are determined on t h c k specimcns prior to thcir slicing into t h n layers. Thus, while the aging curve is determined on thin slices, the initial R-value which is used for normalization of these curves is determined on a thick slab.
There are two advantages in using the normalized aging curves:
1. In showing the relative significance of the air ingress stage of the aging process [7]
2. In reducing the error due to the so-called thickness effect in measure- ments of thermal resistivity performed on thin and thick specimens In effect, the normalized reference aging curve together with the mean value of the initial thermal resistivity can be used to predict long-term ther- mal performance for any thickness of the foam.
PREDICTION OF LONG-TERM PERFORMANCE
The primary use of the reference aging curve is to recalculate it into an ag- ing curve for material layer with the required thickness. For example, con- sider a spray foam applied to a thickness of 50 m m while the aging curves were experimentally determined over a six month period o n 5 m m thick slices. First, when producing the reference aging curve which is related to 10 m m thick material layer, the time scale will be extended to cover aging for two years [as it follows from Equation (1): (10 mml5 mm)' x 0.5 year = 2 years]. The reference aging curve contains information on aging for 50 years for a 50 mm t h c k foam sample [as it follows from Equation (1): (50 mmllO mm)2 x 2 years = 50 years]. It means that the information contained in the reference aging curve may be used to predict the thermal resistance of this 50 mm thick material layer at any selected time or the average thermal resistance or design R-value over any selected period, e.g., 5, 10, 15, 25 or even 40 and 50 years.
The design R-value (R,) is defined as the average thermal resistance of the material layer over a specified aging period, which for practical purposes is expressed in days. Let the aging period be m days. If R, is the thermal resis- tance on k k day during the aging period, integrating from the first to the last
day (m), one defines R, as follows,
during each of two aging stages, the process of aging call bc experinlentally approximated by Equation (3)
R, = R, - .4 log k (3)
whcrc R , is the R-value o n the first day of the aging pcriod under considera- tion and A is an empirical constant. The above equation can also bc ex- pressed as
R!, - R.,, -- 1 log -(k) ~
R, - R,,, log (111)
whcrc R, is the thermal rc~istanccs o n thc last day ofthe aging pcriod. I t can
be shown (SLY Appendix 2) that the design R-value for the aging pcriod, as
defined by Equation (2), is numerically cqual to the R-value on day t i selected
in such a manner that
For an aging period of 25 years (nr = 9125 days), according to Equation
( 5 ) , the design thermal resistance R, is reached on day d = 3360, i t . , after
approximately nine years. Once again, if a foam sample of thickness 50 mm
is considered, the 3360 days will correspond to (3360 days x (10 mml50
mm)'] = 134 days on the reference aging curve. Thus the thermal resistivity
on 134th day shown by the reference aging curve will correspond to the de- sign thermal resistivity of the 50 mm foam sample for a period of 25 years. This is an invaluable piece of information on the long-term performance of the foam for dtxigncrs and builders.
EXPERIMENTAL METHODS A N D RESULTS
Each foam was sprayed at two industrial laboratories on a plywood sub-
stratum and a sanlplc consisting of four boards with dinlensions of 1.2 m x
1.2 nl x 0.15 m was produced. These san~ples wcrc sent to NRCC where
from each material the following test specimens wcre prepared:
1. 600 mm square and 25 nun thick, four specimens
2. 300 mm square and 5 mm thick, four specimens 3. 300 mm square and 10 nun thick, eight specimcns
These specimens wcre prepared in two stages. First, slabs slightly thicker than the required thickness wcre cut with a horizontal band saw. Then, to ensure smooth and parallel surfaces of the test specimen, both major surfaces
of these slabs wcrc ground with a Carborundum grinder. The thickness of
each specimen was determined as an average from 16 readings on a microm- eter gauge.
Thrrttzal Pc~fi~rrrrnrrcc of Sprayed I-'c~lyrrri*thntrc~ Foam Ittsulation 49 Through volumetric measurements [6] it was shown that the average TDSL was approximately 0.2 mm for all specimens. Hence the effective
thickness was obtained by subtracting 0.4 mm (for two surfaces) from the
measured average thickness of the specimen.
Initial thermal resistance of each material was determined with the help of
a 600 m m square heat flow meter (HFM) apparatus within a few hours of
the specimen's preparation. The results are listed in Table 1.
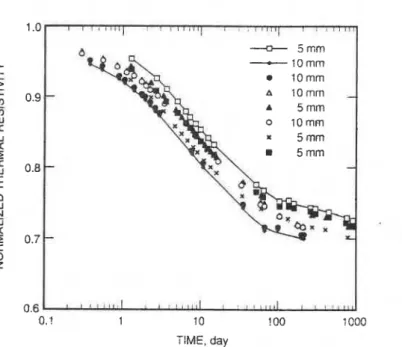
Aging curves for thin material layers were determined with a set of four HFM apparatuses that maintained identical hot and cold plate temperatures. The four 5 mm specimens were tested separately but the eight 10 m m speci- mens were tested as four pairs and each set of data was treated as an average for the pair. The thermal resistances of these thin specimens were continu- ously monitored for the first week. After the first week these specimens were removed from the apparatus and continued to age in the laboratory, up to six months. During this period, their thermal resistances were measured at pre- selected intervals. These measured values were used to establish the aging curve for the effective (corrected with two TDSL) thickness of the specimen. Subsequently, each aging curve was transformed into that for the reference thickness using the scaling technique [see Equation (I)].
Thus for each material eight aging curves were established. These aging curves, normalized by dividing each value by the initial thermal resistivity, are shown in Figures 1 to 6. As indicated earlier, the eight experimental curves for each foam sample form a series of curves. The upper and lower boundaries are marked in the figures and the lower boundary is referred to as the reference aging curve for the foam sample; it is assumed that this ref- erence curve represents the lowest thermal resistivity for the respective foam sample.
Experimental data presented in Figures 1 to 4 clearly show that the refer-
Table I . Average initial thermal resistivities, r,, measured on 25.4 mm thick
specimens and reported for each industrial laboratory separately as well as average for each product.
r, (K-rnW)
Blowing Agent Lab 1 Lab 2 Average
CFC-I 1 65.7 63.8 64.8 CFC- 123 56.8 55.9 56.4 CFC-141 b 57.8 54.5 56.2 CFC-1 I
+
0.5% W a t e r 60.0 57.7 58.9 CFC-1 1+
1 .O% W a t e r 55.3 55.9 55.6 CFC-I 1+
1.5% W a t e r 57.8 54.5 56.2FIGURE CFC-11.
0.6 ' " ' " " ' ' " ' " ' " " " ' I ' " " " L
0.1 1 10 100 1900
TIME, day
Nornuli2c.d aging curvcs o f 5 mm and 10 mm thick sliccs o f SPUF blown
+ 5mm -10rnm 0.9 0.8 0.7 0.6 O.! 1 10 ! 00 : COO TIME, day with
FIGURE 2. Normalized aging curvcs o f 5 mm and 10 ninl thick sliccs of SPUF blown with HCFC-123.
E E E E E E E E E E E E E E E E o V) o o V) m o rn 7 - 7 9 C
2
0 k AlIAIlSIS3tl l V W t i 3 H l Q3ZI-IVWHON. - . - - -
-
---
-
.- &a 3 ?g
0 3 0 L L 0 2 ?, 'a C E E E E E E E E d E E E E E E E E n d 4 .-
-
n 0 E!2
-
u-
-
-
-
m" a -z E L u ' E Z=
I- z-
lr. 'e P n-
L 2 9, ?-
.-
z
-z 3 L .z 2-
-
6 g ;-
92
'g-
7 . 02
X
i:s$
-
hllAllSIS3H lVWkl3Hl a3ZllVWHON d3;
3 72:
-1 a U LO 5 '5
.-g
-
k I I 04 0 1.:
E E E E E E E E 0*
E E E E E E E E - ~ ~ ' 0 ~ ' " ~ ' D ' D - I-
I I I c> a 3 8 .-2
m ,* 3;
.-
-
0 - 0 55
-
?-
? ?-
m"=
D-
2 : k- f-
-
m ,L-
'9 _I 7:
_I-
.-
z
-5 9 '-
0 ? $ 9-
8
z
2
2
-
L-
z
-
AlIAIlSIS3H l V W H 3 H l a3ZllVWUON;:
3 7$ 2
!&u
Tlrc~ntral Pi~uf;~umarrci, cf Spraycpd P~~lyurc~tiinni~ Fonm Irrsulatiorr 3 3
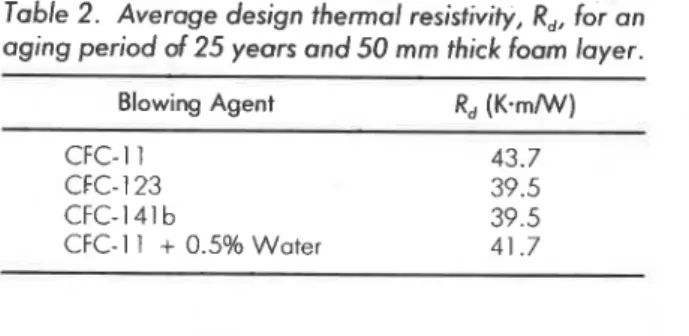
Table 2. Average design thermal resistivity,
R,,
for on aging period of 25 years and 50 mm thick foam layer.Blowing Agent R, (K-m/W)
CFC-I 1 43.7
CFC- 1 23 39.5
CFC-141 b 39.5
CFC-1 1
+
0.5% Water 41.7ence aging curve is a characteristic of the respective material. O n the other hand, the scatter of data in Figures 5 and 6 indicates that the inhomogeneity of the materials is much higher than can be tolerated by the proposed meth- odology. It was also noticed that the densities of the materials in Figures 5 and 6 showed significant variations.
The data obtained on materials represented by Figures 1 to 4 were used to calculate, as outlined earlier [Equations (2) to (5)], the design thermal resis- tivities of those materials for an aging period of 25 years and are listed in Table 2.
CONCLUDING REMARKS
I t was postulated in a review [8] that the evaluation of long-term thermal resistance of cellular plastics must include the overall thermal resistance as a function of time as well as the differences in material properties, which in turn may depend on manufacturing conditions or even on the location from which the sample was taken. It was ensured, therefore, that all foams manu- factured for this research project were homogeneous enough in their cross- section [3] and that the manufacturing conditions were identical for all sam- ples tested.
These measures permitted verification of the proposed slicing and scaling methodology [4] under conditions of material production existing in the in- dustrial R&D facilities. The differences in material properties were assessed with measurements of:
1. The initial thermal resistance measured on large specimens from material .
manufactured, cut and tested in a repeatable manner
2. The normalized aging curve
These measures showed that some materials were homogeneous enough to permit the application of the proposed methodology (Figures 1 to 4), while inhomogeneity of two materials shown in Figures 5-6 precluded use of this technique.
Restricting our discussion to sprayed polyurethane foal11 products for which the selected manufacturing conditions were appropriate, i.c., materials blown with CFC-11, HCFC-123, HCFC-14lb and CFC-I1
+
0.5'X)water, one may conclude t h ~ t slicing and scaling technique appcars fully ap- plicable. The nleas~~rcnlents wcrc pCrformcd o n 5 and 10 mm thick laycrs to establish that use of such thin layers docs not increase test i~nprccision and that the TDSL is correctly determined. I t appcars that use of t w o different slice thickncsscs (such as 5 and 10 mm) should be continued.
It is also ilnportant to underline, as previously postulated [4], that the whole aging curve should be cstablishcd instead of a single thermal resistiv- ity value dctcrnlincd at a prescribed tinlc. The reasons for this requirement arc as follows:
1 . To compare aging on slices with different thicknesses
2. To observe whether air ingress stagc is completed in the considered period of aging [7]
3 . To evaluate the scatter of aging curves dctcrnlincd on separate specimens Comparison of normalized aging curves established o n different specimens will confirm whether the scatter is small enough to permit the assumption of one curve as the material characteristic. This illaterial characteristic may be of great importance for product R&D as it is correlated to gas-diffusion processes through the actual foam structurc
In conclusion, onc.nlay observe that:
1. Slicing and scaling technique appears fully applicable to sprayed polyure- thane foam insulations.
2. Despite the higher initial thernlal resistivity of Base 88, the long-term thermal performance of sprayed polyurethane foams blown with H C F C -
123, HCFC-14lb and CFC-I1
+
0.5'X) water compares favorably withthat of Base 88.
ACKNOWLEDGEMENTS
The authors gratefully acknowledge technical assistance for this work from Mr. J. G. Theriault, Mr. J. C . Lackey, Mr. R. G. Marchand and Mrs. N. Normandin.
APPENDIX 1: DEFINITIONS
CasTfillc,ri cclbrlav yldstic (GFCP)-A prcdonlinantly closed-cell cellular plastic (foam) containing a captive blowing agent with thermal insulating properties better than those of air.
*
.-l,qir!q crrr-r~(.-A dcpc.ndcncc of thcniial rcsistivity (invcrsc of thermal con- ductivity) oil the pcriod of aging. When dinlcnsional changes occur in thespccinicn during the aging pcriod, they shall be disregarded. Original slx.cinicn thickness shall be uscd in the calculations of thcrmal rcsistivity as a fiinction of time. Aging curves may be determined on G F C P that are subjcctcd to different cnvironnlcntal conditions. In this work aging took place under laboratory conditions.
Slicir~~q and scalin'q technique-A methodology to predict long-term thermal resistance of a GFCP layer from an aging curve experimentally deter- mined on a thin material layer.
*
Tlrickrrcss of destroyed sui$acc layer (TDSL)-An equivalent thickness of open cells on the specimen surface determined from a difference between geometric volume and such measured with a buoyancy method divided by the surface area.Ejective thickness (ET) of the closed-cellfoam-An average geometric thick- ness minus twice the TDSL value.
RefPrence thickness for aging curves-An effective thickness of 10 mm. Refkrence aging curve-An aging curve selected from a number of them de- termined on the same GFCP product and recalculated to the reference thickness (10 mm). In this work the aging curve with lowest long-term thermal resistivity was chosen.
Normalized rc.ference aging curve-A reference aging curve divided by the value of the initial thermal resistivity from which this curve has been started, i.e., a dimensionless aging curve starting at 1.
Mean initial thermal resistivity-A mean R-value from a large number of tests (as required by the statistical considerations) on specimens selected during a prescribed initial period of aging. These tests are performed o n specimens with full thickness of the board or at least 25 m m thickness, if the GFCP product was proven to be homogeneous. In this work the mea- surements were performed between the 7th and 14th days of aging, on 25 mm thick specimens.
APPENDIX 2: THE RELmION BETWEEN THE PERIOD OF AGING AND THE DESIGN THERMAL RESISTANCE
Using a natural logarithm and defining the average R-value with the help of Equation (31, one obtains
a n d after integration
further, substituting integration boundaries
a n d using approximation that (m
-
1) is equal t o m, since m is large (long- term thermal resistance), o n e obtainsR-value decays from the initial value-higher than R,,, t o the final value lower-than R,,, there will always b e a day d w h e n the actual R-value (Rd) is equal t o the average R-value. Requesting that R, = R,,, o n e obtains
thus, In (m/d) = 1 and day d = m/e where e = 2.72.
REFERENCES
I . Lichtenberg, F. W., ed. 1989. CFC and Polyurethane Industry: Volume 2. A Compila- tion of Echnical Publications 1988-1989. Lancaster, PA: Technomic Publishing Co., p. 359.
3. Harris, T. 1989. "The SPIINRC-IRC Joint Research Program: Evaluation of Al- ternative Blowing Agents in Sprayed Polyurethane Foams," pp. 107-111 of Refer- ence [I].
3. Bomberg, M. T. and M. K. Kumaran. 1989. "Report on Sprayed Polyurethane Foam with Alternative Blowing Agents," pp. 112-128 of Reference [I].
4. Bomberg, M. T. 1989. "Scaling Factors in Aging of Gas-Filled Cellular Plastics," prcsented at the International Workshop on Long-Term Thermal Performance of Ccllular Plastics, Huntsville, Canada, September 28-29.
5. Isberg, J. 1988. "The Thermal Conductivity of Polyurethane Foam," Publication 88:1, Nr 679, Chalmers University of Technology, Division of Building Technol- ogy, Gothenburg, Sweden, p. 170.
6. Schwartz, N. V., M. T. Bomberg and M. K. Kumaran. 1989. "Measurements of thc Rate of Gas Diffusion in Rigid Cellular Plastics,"]ournal of Thermal Insulation, 13:48-61.
7. Edgcconibc, F. H . 1989. "Progress in Evaluating Long-Term Thcrmal Resistance o f Ccllular Plastics," pp. 17-24 o f Rcfcrcncc [I].
8. Bombcrg, M. and D. A. Brandrcth. 1990. "Evaluation of Long-Tcrm Thcrmal Rc- sistancc of Gas-Fillcd Foanxs: State o f the Art," ASTM Spec. Tcch. Publ. 1030, pp. 156-173.
This paper is being distributed in reprint form by the Institute for Research in Construction. A list of building practice and research publications available from the Institute may be obtained by writing to Publications Section, Institute for Research in Construction, National Research Council of Canada, Ottawa, Ontario, KIA 0R6.
Ce document est distribue sous forme de tir6-A-part par 1'Institut de recherche en construction. On peut obtenir une liste des publications de l'lnstitut portant sur les techniques ou les recherches en matiere de Mtiment en ecrivant A la Section des publications, Institut d e recherche en construction, Conseil national de recherches du Canada, Ottawa (Ontario), KIA