Publisher’s version / Version de l'éditeur:
ACI Materials Journal, 91, 3, pp. 246-255, 1994-05
READ THESE TERMS AND CONDITIONS CAREFULLY BEFORE USING THIS WEBSITE. https://nrc-publications.canada.ca/eng/copyright
Vous avez des questions? Nous pouvons vous aider. Pour communiquer directement avec un auteur, consultez la première page de la revue dans laquelle son article a été publié afin de trouver ses coordonnées. Si vous n’arrivez pas à les repérer, communiquez avec nous à PublicationsArchive-ArchivesPublications@nrc-cnrc.gc.ca.
Questions? Contact the NRC Publications Archive team at
PublicationsArchive-ArchivesPublications@nrc-cnrc.gc.ca. If you wish to email the authors directly, please see the first page of the publication for their contact information.
NRC Publications Archive
Archives des publications du CNRC
This publication could be one of several versions: author’s original, accepted manuscript or the publisher’s version. / La version de cette publication peut être l’une des suivantes : la version prépublication de l’auteur, la version acceptée du manuscrit ou la version de l’éditeur.
Access and use of this website and the material on it are subject to the Terms and Conditions set forth at
Investigation of the rapid chloride permeability test
Feldman, R. F.; Chan, G. W.; Brousseau, R. J.; Tumidajski, P. J.
https://publications-cnrc.canada.ca/fra/droits
L’accès à ce site Web et l’utilisation de son contenu sont assujettis aux conditions présentées dans le site LISEZ CES CONDITIONS ATTENTIVEMENT AVANT D’UTILISER CE SITE WEB.
NRC Publications Record / Notice d'Archives des publications de CNRC:
https://nrc-publications.canada.ca/eng/view/object/?id=f865068f-c383-4e76-93fa-8c6473b160eb https://publications-cnrc.canada.ca/fra/voir/objet/?id=f865068f-c383-4e76-93fa-8c6473b160eb
HU
http://www.nrc-cnrc.gc.ca/ircU
I nve st iga t ion of t he ra pid c hloride pe rm e a bilit y t e st
N R C C - 3 5 1 6 2
F e l d m a n , R . F . ; C h a n , G . W . ; B r o u s s e a u , R . J . ;
T u m i d a j s k i , P . J .
M a y 1 9 9 4
A version of this document is published in / Une version de ce document se trouve dans:
ACI Materials Journal, 91, (3), pp. 246-255, May, 1994
The material in this document is covered by the provisions of the Copyright Act, by Canadian laws, policies, regulations and international agreements. Such provisions serve to identify the information source and, in specific instances, to prohibit reproduction of materials without written permission. For more information visit http://laws.justice.gc.ca/en/showtdm/cs/C-42
Les renseignements dans ce document sont protégés par la Loi sur le droit d'auteur, par les lois, les politiques et les règlements du Canada et des accords internationaux. Ces dispositions permettent d'identifier la source de l'information et, dans certains cas, d'interdire la copie de documents sans permission écrite. Pour obtenir de plus amples renseignements : http://lois.justice.gc.ca/fr/showtdm/cs/C-42
ACI MATERIALS JOURNAL
TECHNICAL PAPER
voltage gradient to force the chloride ions to migrate more rapidly through the porous materials under test. However, this approach is frequently regarded as an indirect way of measuring chloride ion permeability.4 This early work led to AASHTO T 277 and the ASTM C 1202-91 Rapid Chloride Permeability Test. Researchers 12 have carried out experi-ments that examined tIie effect of a) various forms of pre-soaking and prevacuum treatment of the specimens; b) different screen materials; and c) specimen diameter. Other work was directed at a study of factors relating to the repro-ducibility of the results. 13 The rapid chloride test has been used in studies on the effect of pozzolanas and supplementa-ry materials on concrete resistance to chloride ion penetra-tion,14,lS and has been specified increasingly for use in parking garage slab placements and on shotcrete repair jobs.'6
Recently some doubts have been expressed regarding the rapid chloride test. The main criticism is that the measure-ment conditions are severe and may cause both physical and chemical change in the specimen, resulting in unrealistic
val-ues.
The present work was designed to observe how changes in experimental conditions and the specimens affected re-sults. Temperature, AC impedance, DC current, charge passed, and chloride ion profiles were monitored during the application of voltage.
ACI Materials Journal, V. 91, No.2, May-June 1994,
Received March 22. 1993, and reviewed under Institute publication policies. Perti-nent discussion willbepublished in the September-October, 1994 ACI Materials
Journal ifreceivedby September 1, 1994.
RESEARCH SIGNIFICANCE
The rapid chloride penetration test involves determina-tion of the electrical conductance of concrete to provide a rapid indication of its resistance to the penetration of chlo-ride ions. This test is now ASTM C 1202-91 and is applica-ble to types of concrete where correlations have been established between its procedure and long-term ponding procedures, such as those described by AASHTO T 259.
The test is now widely used to assess relative quality of
,ZGセ !:, ."
Title
no.
91-M23by
Rolf F.teldman,
セッイ、ッョ
W.
than, Rejean
jNセッオウウ・。オL
and
ー・エ・イjNセュゥ、。ェsォゥ
High·quality impermeable concrete as cover of reinforcing steel is one of the best methods of preventing chlorides from initiating corrosion.
AASHTO T277and the ASTMC1202-91 Rapid Chloride Permeability
Test were developed because of a need to. rapidly measure permeability of concrete to chloride ions. Some criticisms have been made, mainly con-cerning the factthatconditio1l8under which measurements are made may cause changes to the specimens. This' work was designed to observehow changes inthe testing procedure affect results. Factors such as tempera-ture, AC impedance, initial DC current, charge passed, and chloride ion profiles were monitored during polarization offour different concretes. It was found that simple measurement ofinitial current or resistivity gave the same ranking as conventional tests for the Jour concretes and can replace the rapid chloride test with a considerable time saving.
Keywords: chlorides; concretes;,conductivity; corrosion; durability.
Investigation
of the Rapid
Chloride Permeability Test
Steel reinforcement corrosion is well recognized as one of the main causes of the premature deterioration of such con-crete structures as bridges and parking garages.,,2 Reinforce-ment corrosion is induced primarily by ingress of chlorides into uncontaminated concrete,3 e.g., from deicing salts, that penetrate through the concrete cover to break down the pas-sive oxide film that normally protects the steel.
Preventing the ingress of chlorides to the reinforcement is one approach to improve the durability of a concrete struc-ture. This can be done with thicker concrete cover and, more importantly, with concrete highly impermeable to chloride ions. This explains the need for tests that can be used in the field to rapidly measure the permeability of concretes to chloride ions.4
Much work has been done in measuring concrete perme-ability through the steady-state flow of water under a hy-draulic gradient,S but this test was considered somewhat irrelevantto bridge decks and it presents considerable diffi-culty with regard to its application and reproducibility.6
The main mechanism for transport of chloride ions through crack-free concrete is diffusion. This has been dem-onstrated by several researchers?-ll using the classical diffu-sion cell. However, this method requires considerable time for completion, since steady-state values are required. Therefore, it is not suitable for the purpose of a rapid test.
The need for a rapid test has led to a technique that uses a
RolfF.Feldman has worked in the Materials Laboratory ofthe Institute for Research in Construction for35 years, HeisPrincipal Research Officer and Head of the Con· crete Section of the Laboratory, a Fellow of the American Ceramic Society, andhas
been working on concrete durability and microstructure of hydrated cement pastes, Feldmnn is coauthor of two books, includingConcrete Science,which appeared in three languages, He was recently given an awardfor his contributions to Advancesin
Concrete Science and Technology at an ACI/CANMET conference in Athens, Gordonw:Chanisa Technical Officer in the Materials Laboratory at the Institute for Research in Construction, National Research Council of Canada, He has worked in the Materials Laboratoryfor 12 years, Much ofhis work has been devoted to the study of microstructure of cement past and concrete, and, recently, rapii chloride ion per· meability and diflusivlty,
Rejean J. Brousseau obtained his doctorate in electrochemistry from the University ofOttawa in1989.Since then, he has been working in the Materials Laboratory ofthe Institute for ResearchinConstruction, predominantly in the area ofdurability of rein· forced concrete. He is an active member of the National Association of Corrosion Engineers,
Peter J. Tumidajski obtained his PhD from the University of Toronto in1987,Subse· quently, he spent18months at the A!8"onne National lLlboratory, and3years as Assis-tant Professor of Materials Engineering at the University of Western Ontario in London, Ontario, Canada, He is currently engaged as a Research Assistant in the Materials Laboratory of the Institute for Research in Construction at the National Research Council of Canada, His interests relate to the durability and physicochemi. cal measurements ofcement and concrete properties,
concrete in the transportation sector and is also often speci-fied for use in parking garage slab placements and in the per-formance of shotcrete repair jobs. However, the test takes a relatively long time and the conditioning imposed on the samples (60 volts) is severe, causing, in many cases, heating and physical and chemical changes to the specimen.
This paper studies effects that occur in specimens during the test, and during several modified procedures. Correla-tions are made between the test and greatly simplified proce-dures, which reduce the period of severe conditions and considerably shorten the length of time taken to perform the test.
EXPERIMENTAL Material and specimen preparation
Concrete cylinders approximately 200 mm (7.87 in.) long and 102 mm (4.02 in.) in diameter were cast. The mid-dle 51 mm (2.01 in.) of each cylinder was used as a speci-men. ASTM Type I cement was used (Table I). The concrete was mixed at a water-cement ratio of 0.55 with a cement-sand-coarse aggregate ratio of I:2:3. Maximum aggregate size was 19 mm (0.75 in.). The coarse aggregate used was crushed limestone. Five different maturity levels of concrete were studied: 1,4,6,28, and 68 weeks.
Experiment sequence
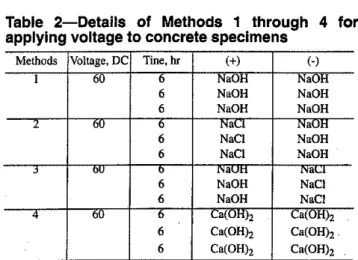
The rapid chloride permeability technique was conduct-ed using different solutions in the electrode reservoirs. These are summarized in Table 2 and referred to as Methods I
through 4. Method 3 follows the conventional AASHTO T 277 procedure, while in Method 4 only, a saturated calcium hydroxide solution is used to fill both reservoirs. In all four methods, the voltage was applied for 6 hr, removed, and the specimens were allowed to cool to room temperature. The voltage was again applied for 6 hr. Three periods of 6 hr each were generally used on each specimen.In the case of the 1-week-old specimen, the sample rapidly became very hot on polarization and the application time had to be reduced to a
ACI Matetials Journal / Mav-Junej994 セ
Table 1-Chemlcal composition of Type 10 cement
Element Percent
,0,
21. AI,O, 5.26 Fe203 2.07 CaO 66.35 MgO 1.55 Na20 0.09 K,O 1.00 C LOI 0.35 SO, 1.42 Free lime 0.94 C3S 65.06 C,S 12.25 C3A 10.44 C,AF 6.30Table 2-Details of Methods 1 through 4 for applying voltage to concrete specimens
Methods Voltage, DC Tine, hr (+) (-)
I 60 b NaOH NaOH
6 NaOH NaOH
6 NaOH NaOH
2" 0lI b Nael NaOH
6 NaCI NaOH 6 NaCI NaOH j bU 0 "avn "alA 6 NaOH NaCI 6 NaOH NaCI "4 -60 b calUHh Ca(OHh 6 Ca(OHh Ca(OH), . 6 Ca(OHh Ca(OHh
3-hr period. AC impedance measurements were recorded be-fore and after each polarization period after the samples cooled to room temperature. In addition, the DC current passing and temperature were measured during the experi-ments. The total charge passed in each test was determined by integration of the current-time curves.
In another experiment, four specimens (concrete cnred for 28 days) were subjected to polarization for 6, 12, 18, and 24 hr, respectively, using Method 3. The voltage was re-moved after each 3-hr period during the fIrst 12 hr. Current and resistivity were measured at room temperature before· and after the voltage was applied; current was also measured throughout the period. The last two specimens were subject-ed to one and two additional 6-hr periods, respectively. Chloride profiles were measured on each of the four speci-mens; average values of three specimens were taken at depths of0to 2 mm (0 to 0.079 in.), 8 to 10mm(0.32 to 0.39 in.), 24 to 26 mm (0.95 to 1.02 in.), and 48 to 50 mm (1.89 to 1.97 in.) from the surface near the cathode.
Impedance measurements
Resistivity values were calculated from impedance mea-surements. These measurements were performed with an
LCR meter at a frequency of 10 KHz. In this frequency range, no significant contribution from the measuring elec-trodes to the total impedance17was recorded. The impedance
6 6 5 5 2 3 • Time,hOllrs 2 3 . TIme.bours 1 1 28weeks
ACI Materials Journal/May-June 1994
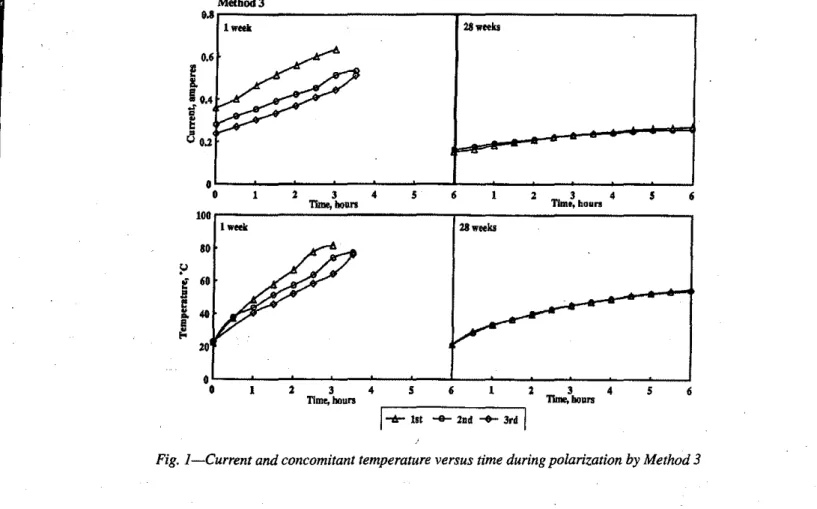
creased to about 55 C.In general, the results showed that dif-ferences between initial and fInal currents and temperatures are greater with lower maturity concretes and decrease with maturity. The total charge passed, along with the initial and fInal currents, all decreased from Cycle I to 3. Measure-ments of initial and fInal current and temperature, and charge passed, on the four concretes using the four methods, are pre-sented for the fIrst cycle only in Table 3. Results are similar for Methods I, 2, and 3, but for Method 4, on 28-week-old concrete, charged passed, fInal current, and fInal temperature are considerably lower than for the other methods, despite the fact that the initial currents are similar.
Measurements of current and resistivity (after cooling) during polarization cycles-Results of the measurement of
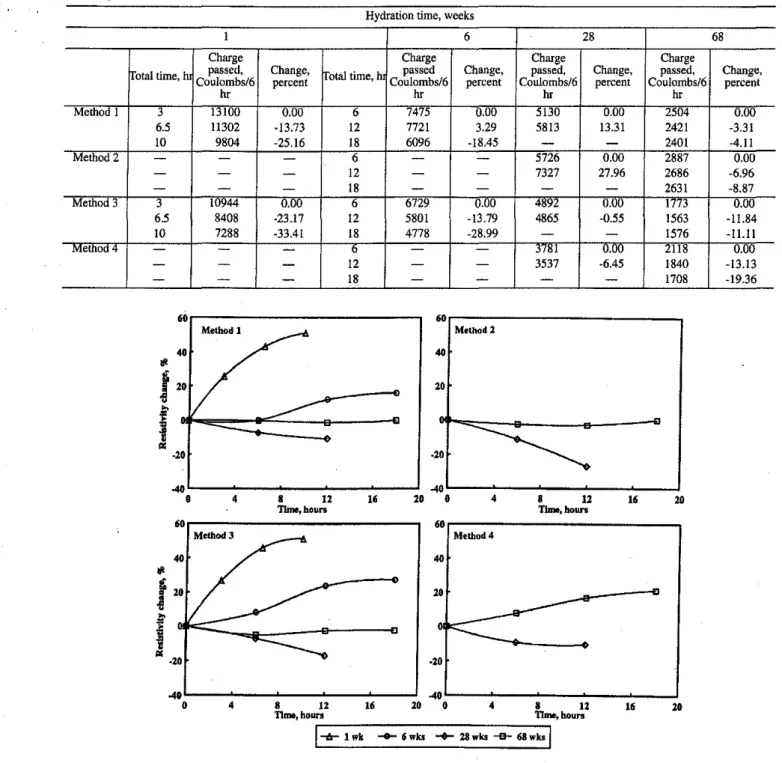
current and resistivity, before and after each cycle, after the specimens had attained room temperature, are presented in Tables 4 and 5, respectively (for the four concretes and four methods). Results for charge passed in each cycle are pre-sented in Table 6. Plots for the change of resistivity of the concretes with time of polarization by the four methods are presented in fig. 2. A decrease in current with total time of polarization occurs by Method I for both the 1- and 6-week-old week concretes (Table 4); this is accompanied by an in-crease in resiSlance for both concretes (Fig. 2), although it is much greater for theiMキ・・ォセッャ、 concrete. The increase in re-siSlance is probably due to the continued hydration with ac-companied decrease in porosity and pore sizes. These processes are accelerated by the elevated temperatures brought on by the passage of the current, but at the same time the conductivity of the pore solution is increased· by the tem-perature increases, resulting in current increases. The charge
6 6 5 o'---'_...Mセ⦅ ...⦅セMNャNNNMMMGセセ⦅セ⦅セ⦅セMMMャ
o
1 2 3 • Time, hours 2& MethodJ &.8 lw.... M!
l1
0.4 Iit
a
&.2 & & 1 2 3•
5 ThDe,boun 10& lw....j-,!r-
1st -e-2nd ... 3rdI
of the samples was measured in two ways.In the fIrst
meth-od,impedance was measnred before the specimens were in-stalled in the permeability equipment. The slices of concrete were sandwiched between two damp cloths and two stainless steel plates (Type 304). Special care was taken to insure that the stainless steel plates were parallel during measurements. In the second method, impedance was measured through the electrodes while the concrete specimens were in the elec-trode solution. A small correction was made for the imped-ance of the electrolyte. The resistivities differed on average by I percent.
Fig. I-Current and concomitant temperature versus time during polarizationby Method 3
RESULTS
Measurements made during performance of rapid
chloride permeability technique
Current and temperature measurement during polariza-tion-Current and temperature measurements taken from the
beginning of the polarization period (using Method 3) are presented in Fig. I for concretes cured for I and 28 weeks. The three cycles were carried out for only 3, 3.5, and 3.5 hr on the l-week-old specimens; currents and temperatures in-creased steadily with time for all three cycles. The current at the beginning of each cycle was considerably lower than for the previous cycle. It was measured at room temperature, and the temperature increased to over 80 C for the fIrst cycle, and almost that for the other two cycles (Fig. I).Final cur-rents were measured at elevated temperatures and were up to 75 percent greater than the initial current; the younger the concrete, the greater the difference. Results for the concrete cured for 28 weeks showed little difference between cycles for the initial or fInal current, although temperatures
Hydration time, weeks
Fig. 2-Resistivity change at room temperature versus time ofpolarization offour con-cretes by Methods 1 through 4
ACI Materials Journal
I
May,June 1994The results for Method 2 involve only the 28- and 68-week-old concretes. They differ from Method 1 only in that the decrease in resistance and increase in current for the 28-day-old concrete is significantly greater for Method 2. These trends continue with the value of the charge passed through the specimen, which is much greater for Method 2 and the 28-day-old concrete specimen.
Results for Method 3 show a more rapid decrease in cur-rent and increase in resistance with time of polarization than for Method 1 for the 1- and 6-week-old concretes. Conse-quently, the charge passed through the specimens is also less over the equivalent time period. This may be due to the
ac-••
Method 1..
Method 2 40 40 II'!
2. 2.f
セ
..
-2. .2....
•
4 8 12...
"
28•
4 8 12 1. 2. Tlme,houra Time,hours••
Method 3..
Method 4 40 40 II'!
2. 2.f
• 0::::::::....
"
·2. ·2....
..
.
•
4 8 12 l' 20•
4 8 12 1. 2. 11mlt, hours TIme,houn Lセ 11ft -e- 6wks ... 28wks -e-68wksI
1 6 28 68Charge Charge Charge Charge
frota! time,h passed. Change, trota! time, h:J passed Change, passed, Change, passed, Change,
Coulombs/6 percent Coulombs/6 percent Coulombs/6 percent Coulombs/6 percent
hr hr hr hr Method 1 3 13100 0.00 6 7475 0.00 5130 0.00 2504 V.OO 6.5 11302 ·13.73 12 7721 3.29 5813 13.31 2421 -3.31 10 9804 -25.16 18 6096 -18.45
-
-
2401 -4.11 Method 2 6 5726 0.00 2887 0.00-
--
12-
-
7327 27.96 2686 -6.96-
-
- 18-
--
-
2631 -8.87 Method 3 3 10944 0.00 6 6729 0.00 4892 0.00 1773 0.00 6.5 8408 -23.17 12 5801 -13.79 4865 -0.55 1563 -11.84 10 7288 -33.41 18 4778 -28.99-
-
1576 -11.11 N.emou. 0 3781 0.00 2118 0.00-
-
-
12 - - 3537 -6.45 1840 -13.13-
-
-
18 --
-
-
1708 -19.36Table 6-Comparison of charge pased for different concretes during application of Methods 1 through 4
passed per unit time is much greater for the 1-week-old crete than the 6-week-01d concrete. The 28-week-old
con-crete, however. showsan,increase in current and decrease in
resistance, while the 68-week-old concrete shows little change in either. For the 28-week-01d concrete, this is prob-ably due to sodium and hydroxyl ions entering the concrete, increasing the conductivity of the pore solution, while the change in pore structure due to further hydration is slight. For the 68-week-old concrete, changes in the pore structure and solution concentrations are probably slight. These re-sults reflect those for the charge passed through the
speci-mens.
251
セ
15 セ Second CS hoursi
12 r=
0.99.-
9=
"
6I
3f
0'"
0 0.1 0.2 0.3 0.4 0.5 I! 15..
セ Third 6 hours•
12 r_l1
9.-=
•
6I
3t
0I'
0 0.1 0.2 0.3 0.' 0.5 「、セ・オセdエ。ュー・セFig. 3-Plot of initial current versus charge passed on polarization offour concretes by Method 1
ments of current, resistivity, and total charge passed were made every 3 hr of polarization at room temperature for the first 12 hr; readings were taken every 6 hr for the final 12 hr. Chloride profiles were measured through the four speci-mens. Current, resistivity, and charge passed are presented in Table 8 and chloride profiles are shown in Table 9. Chloride profiles were determined at depths of 0 to 2 mm (0 to 0.079 in.), 8 to10mm (0.32 to 0.39 in.), 24 to 26 mm (0.95 to 1.02 in.), and 48 to 50 mm (1.89 to 1.97 in.) from the cathodic side of the specimen. The average of three separate cores for each depth is summarized in Table 9.
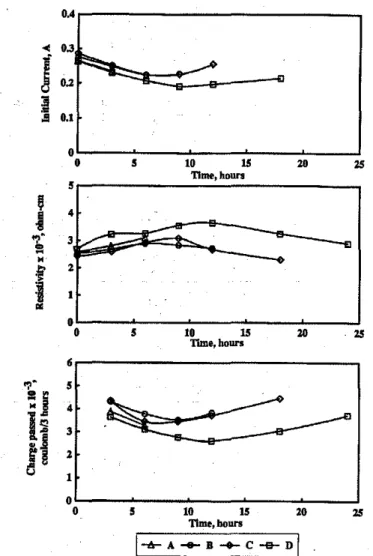
Some of the data presented in Table 8 are plotted in Fig. 7 as initial current, resistivity, and charge passed versus total time. Except for Specimen A, the curves for the specimens display maxima in the resistivity-versus-time plot and mini-ma in the charge passed and current-versus-time plots. The maxima and minima occur at between 6 and II hr for the three parameters.Itmay be observed in Table 9 that, at the surface of Specimen A (6 hr of polarization), adjacent to the anode (sample depth, 48 to 50 mm), the chloride concentra-tion is 0.36 percent by weight of cement compared to 1.14, 0.72, and 1.16 for SpecimensB,C, andD.This confirms that the maximum level of chloride absorption has not been at-tained in 6 hr of polarization, and therefore, beyond this point, the chloride concentration in the solution increases,
re-セ
1 5 r - - - . . . " . . - ,
I
Fint6bouni
12 r_l .- 9=
i :
セ
セ°0!"""'--::---:'::----7::--":":""--J
0.1 0.2 0.3 0.4 0.5celerating influence of the chloride ion on hydration rate, since this ion migrates to the anode in Method 3. In addition, !lydrpxyl ion migration adding to the conductivity of the . pore solution in Methods I and 2 will not occur in this case. In Method 3, for the 28-week-old concrete, a significant in-crease in current, and a significant dein-crease in resistivity, are observed, but to a lesser extent than for Method 2. This re-flects both the increased conductivities of the pore solutions due to the respective migration of chloride and hydroxyl ions, but also the fact that hydroxyl ion is more conductive than chloride ion, and, finally, that part of the latter is immo-bilized from solution by reacting with the aluminate phases in the hydrated cement. Results for the 68-week-old concrete are similar to Methods I and 2 in that no significant changes in current, resistance, and charge passed are observed.
Results from Method 4 also display increases of current and decreases of resistance with time for the 28-week-old concrete when the system is polarized. The charge passed, however, decreases. The decrease in resistance is greater thanfor Method 3, for the first 6 hr, but for the second peri-od, it is much less, and the charge passed is also much less than in Method 3.Itis interesting to recall that the initial cur-rent was not much lower than for the 28-week-old concrete measured in Method 3. These measurements during applica-tion of Method 4 have heen referred to earlier in the secapplica-tion on current and temperature measurement during polariza-tion. The probable explanation is that, initially, hydroxyl and calcium ions migrate into the specimen, increasing the con-ductivity of the pore water; the source of ions' from the ini-tially saturated calcium hydroxide solution is rapidly depleted and there is no further increase of current or de-crease in resistance. The 68-week-old concrete in Method 4 shows an approximately 20 percent decrease in current and charge passed, and an approximately 21 percent increase in resistance. These results may be explained if it is assumed that there is a greater migration of ions from the specimen at the level of impermeability obtained at 68 weeks than diffu-sion intu the samples from the saturated calcium hydroxide solution.
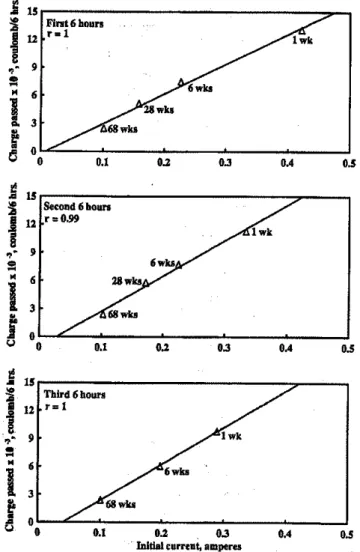
Correlations between initial current, charge passed, and resistivity-Plotsof initial current versus charge passed and conductivity, and conductivity versus charge passed using Methods I and 3, are presented in Fig. 3 through 6.
Results of regression analysis of the data from Methods I and 3 are presented in Table 7.Itcan be seen from the figures that the data is well represented by straight lines.Itmay be observed that the changes in slope for charge passed versus conductivity, and charge passed versus initial current for the three cycles, are significant for both Methods I and 3.In ad-dition, the changes observed are only slightly greater for those of Method I. In the case of the conductivity versus ini-tial current plot, the changes in slope between the three cy-cles are much smaller for both Methods I and 3.
Extended polarizatIon period by Method 3 for 2S-day-old concrete and chloride profiles through specimens
Four concrete specimens were subjected to polarization by Method 3 for 6, 12, 18, and 24 hr, respectively.
suit. It is clear from the plots presented in Fig. 2 that Methods I through 3 give similar results, that is, the I-week-old con-crete increases rapidly in resistivity, the 6-week-old concon-crete increases less rapidly, the 28-week-old concrete decreases in resistivity, While the 68-week-old concrete remains relative-ly constant. More extensive work with Method 3 on 28-day-old concrete confmns that ionic conductivity of the pore so-lution plays an important role (Fig. 7). The measurements of initial current, resistivity, and charge passed, as well as chlo-ride profiles after 6, 12, 18, and 24 hr of polarization (Table 9), indicate that, after approximately 9 hr, the initial current and rate of charge passed increase, resistivity decreases, and chemical absorption of chloride into the specimen is com-plete. These observations imply that the concentration of chloride ioninthe pore solution increases after the 9-hr pe-riod; before this, the concentration would be lower due to the chloride interaction with the cement. Consequently, the ca-pacity of a specimen to pass charge can be increased by the addition of ions, whether chloride or hydroxyl.
The correlations of charged passed with conductivity and initial current show that, with the four concretes used, in the range of 11,000 to 1770 coulombs, resistivity measurements by AC impedance techniques or initial current measurement
ACI Materials Journal I May-June 1994
Fig. 5-Plot ofconductivity versus charge passed on polar-ization offour concretes by Method 1
oセ
..
t! 15Flrst6houn >e Flrst 6 hours
i
OA r=l•
co 12 ,.1 セ"
•
oセ..
..
;
9セ
B oセ B 6J
OJI
3 0R
0 2•
8 00 1 2 3 4 5 6 oセ t!Second 6 bonn
..
>e 15 $eeondI)hoursB
0•• r=!•
co 12 r= 0.99 A セI
oセ•
セ
..
9I
0.2セ
セ
OJI
6 .!I 3 0!o
68wks 0 2•
6 8•
0i5
0 1 2 3•
5 6 OA Third 6 hours t! 15!
OA h,l..
>e ThIrd 6 hours
f
•
co r=l 12 セ•
oセ"
..
E
oセセ
9 B 6wbセ
j
0.1I
6 Ii 0 3 0 2•
6 8/.I
Conductivity :110セ (ohm-em)·1 J! 0 I.l 0 1 2 3 4 5 6 ConductivityJ(104,(obm-cmJ1 DISCUSSIONIthas been shown that polarization of relatively young concrete can cause considerable changes due to large in-creases in temperature that accelerate hydration.Inthe case of Method 3, this acceleration may be enhanced by the in-gress of chloride ion into the pore solution. These phenome-na are compounded because the resistance of the pore solution decreases with an increase of tempemlUre. The net result for the four concretes was an increase in current during the three full 6-hr periods, regardless of the age of the con-crete or the method used; the younger the concon-crete, the great-er these effects on both the current and calculated charge passed.
Measurements of initial current and resistivity at room temperature can remove the effect of temperature on the
re-Fig. 4-Plot ofconductivity versus initial current on polar-ization offour concretes by Method 1
suIting in a lower resistance and increase in current and total charge passed. Results in Table 8 show that changes in cur-rent and resistance can be substantial. For example, for Spec-imen D, a decrease of 27.6 percent in current occurs after 9 hr of voltage application, but an additional 9 hr results in an increase in current. Resistivity decreases of over 28 percent also occur after the maximum resistivity is attained.
·15
253
セエゥカゥエケ cured 'drox-is not v-old :te, re-lassed I pore bility. ,nduc-tyand 6 6s
s
1 wk 6wks 28wks 6wksA 28wks 6 3 6 3 oセMBBMMMセMMセMセMMMGMMMMMio
1 1 3 • Conductivity x 104 ,(obm-cmJ1セQUイZZMMMMMMMMMMMMMMNNNNNNLLNNNMNNNNL
::!! First 6 bours ....=
ral 12"
I
I :
セ 68wks セ ッセMMB\MMセLMMセ⦅セ⦅セ⦅MMMャ (j 0 1 1 3 •] 15
r:--""':':'"---""7--,
olE! Second 6 hours=
12 r=O.99"
J
I
セ 68wks セ 0oセMセBGiMMセQMMMSセMM ...- -...S--....J6 ] tsr=':"'":"::---::,..;,
.l! Third 6 bours ";' ral=
12"
I
I
k
suit.Itis clear from the plots presented in Fig. 2 that Methods I through 3 give similar results, that is, the I-week-old con-crete increases rapidly in resistivity, the 6-week-old concon-crete increases less rapidly, the 28-week-old concrete decreases in resistivity, while the 68-week-old concrete remains relative-ly constant. More extensive work with Method 3 on 28-day-old concrete confirms that ionic conductivity of the pore so-lution plays an important role (Fig. 7). The measurements of initial current, resistivity, and charge passed, as well as chlo-ride profiles after 6, 12, 18, and 24 hr of polatization (Table 9), indicate that, after approximately 9 hr, the initial current and rate of charge passed increase, resistivity decreases, and chemical absorption of chloride into the specimen is com-plete. These observations imply that the concentration of chloride ioninthe pore solution increases after the 9-hr pe-riod; before this, the concentration would be lower due to the chloride interaction with the cement. Consequently, the ca-pacity of a specimen to pass charge can be increased by the addition of ions, whether chloride or hydroxyl.
The correlations of charged passed with conductivity and initial current show that, with the four concretes used, in the range of 11,000 to 1770 coulombs, resistivity measurements by AC impedance techniques or initial current measurement
Fig. 5-Plot ofconductivity versus charge passed on polar-ization offour concretes by Method 1
Acr Materials Journal I May-June 1994
Fig. 4-Plot ofconductivity versus initial current on polar-ization offour concretes by Method 1
0.5
r::-:-:::---"'7--,
Third6 hoursI
0.'
,=1 0.3I
03J
0.1 PセセMBW⦅MMセMMMセMMMMMjo
.2 .. 6 8 Condudlvity x 10セ (ohm-em)-I oAZBBMMMセMMMセMMM⦅MMMャo
1 4 6 8suiting in a lower resistance and increase in current and total charge passed. Results in Table 8 show that changes in cur-rent and resistance can be substantial. For example, for Spec-imen D, a decrease of 27.6 percent in current occurs after 9 hr of voltage application, but an additional 9 hr results in an increase in current. Resistivity decreases of over 28 percent also occur after the maximum resistivity is attained.
DISCUSSION
Ithas been shown that polatization of relatively young concrete can cause considerable changes due to large in-creases in temperature that accelerate hydration. In the case of Method 3, this acceleration may be enhanced by the in-gress of chloride ion into the pore solution. These phenome-na are compounded because the resistance of the pore solution decreases with an increase of temperature. The net result for the four concretes was an increase in current during the three full 6-hr periods, regardless of the age of the con-crete or the method used; the younger the concon-crete, the great-er these effects on both the current and calculated charge passed.
Measurements of initial current and resistivity at room temperature can remove the effect of temperature on the
re-0.5 , - - -
"?_.,
Second 6 boursJ
0•• ,=1 • 0.3I
03J
0.1 oセMMセMMセMMセMMNNNNjo
1 .. 6 8 0.5r:::-":"':':'---""""'--,
First 6holU'llI
0.'
,=1 0.3103
J
OJ252
253
0 0 5 10 15 20 'nme,houn 5 セ 4j
,,-
3:""-:s:
•
F·f
21
1"
0 0 5 10 15 TIme, hours•
,,-
5セェ
4Nセ
Zセ
ISl
3kl
2 1 0 0 5 10 15 20 25 'nme,boursQMVMaセbMKM」M・Mdi
2. During the 60 VDC polarization of older concrete, re-sistivity may decrease and initial current and charge passed
increase due to an increase in concentration of ions in pore
solution, resulting in overestimates of concrete permeability. 3. Good correlation between initial current and conduc-tivity, initial current and charge passed, and conductivity and charge passed were obtained.
4. The same ranking of four concrete specimens (cured at 1,6,28, and 68 weeks) was obtained with sodium hydrox-ide or chlorhydrox-ide in the electrode reservoirs. Chlorhydrox-ide ion is not needed in the rapid permeability test. "
5. Simple measurement of initial current or resistivity
Fig. 7-Electrical properties as time function of28-day-old
concrete by Method3 on 28-day-old concrete
0.5 0.4 lwk
..
0.3"-.
J
0.2セ
,!I 0.1Table 7 Slope
-
and correlation coeffcients for plots of Methods 1 and 3I.
Method 1. hr Method 3,hr
6 12 18 6 12 18
Charge passed versus m(x10') r 3.19 3.31 2.96
..
.,
...
,.
3.U6conductivity 1.00 1.00 1.00 1.00 0.99 1.00
Initialcurrent versus m(x102) r 6.92 7.25 7.00 6.71 6.71 6.63
conductivity 1.00 0.99 1.00 1.00 1.00 1.00
Charge passed versus initial m(xto4)r 3.22 3.77 3.92 3.2U 3.37 3.46
current 1.00 0.99 1.00 1.00 0.98 , 1.00
l'''lumoer or aata pomts
•
•
,
•
•
3i
12 セ First ,hoursl·
8 ,.1,-
Ow..s:
•
•
....
I
3 A 68 ....j
0 U 0 0.1 0.: 0.3i
12 セ Second IS hours•
r=O.98I
•
lwk,-s:
•
28wks.d Ow..•
I
3j
68wu 0 u 0 0.1 0.2 0.4 0.5 Ui
12 セ ThIrd 6 houn•
'.1I
•
,-
wk 0•
セ•
J
3 AJ
0 u 0 OJ 0.: 0.3 0.4 0.5 0••IDltialcurrent, amperes
would have provided the same ranking of concretes. This re-sult is contrary to the findings of other researchers.IS
Resis-tivity or current measurements take very little time to complete, do not change the nature of the specimen, and can be made without the use of relatively concentrated solutions. Correlations with the rapid chloride test should, however, be performed with lower permeability concretes and blended cement concretes.
ACI Materials Journal/May-June 1994
Fig.6-Plot of initial current versus charge passed on polarization offour concretes by Method 3
CONCLUSIONS
I.Application of the rapid chloride permeability test in-duces change in the pore structure and resistivity of the con-crete specimens tested.
ACI Materials Journal/May-June 1994 ehNwNaNセrdMWVセWPL FHWA, U,S. Department of Transportation, Apr,
1976,67 pp.
4, Whiting, D., and Mitchell, T" "History of the Rapid Chloridep・ョョ・セ
ability Test,"Transportation Research RecordNo, 1335, Jan. 1992,pイ・セ
print, pp.55-62.
5. Collins,1.E; Derocher,K. N,; and Karfiatis, G. P., "Permeability of
Concrete Mixtures," 1.Literature Review, Civil Engineering for Practicing
and Design Engineers,V, 5, 1986, pp.UWYセVSXL
6. Hooton, R. D., "Problems Inherent in Penneability Measurement,"
AdvancesinCement Manufacture and Use, E. Gartner, ed., Engineering Foundation, New York, 1989, pp. QTSセQUTL
7: Collepardi, M.; Marcialis, A.; and Tarriziani,R.,"Kimetrics ofp・ョ・セ
tration of Chloride Ions into Concrete,"Journal of the American Ceramic
Society, V. 55. No. 10, 1972. p. 534.
8, Atkinson, A., and Nickerson, A.K..,"Diffusion of Ions throughw。エ・イセ
Saturated Cement,"Journal of Materials Science, V. 19, No.9, 1984, pp.
3068-3078. ReSIStivtty
Charge passed
CWoride content,by weight of cement
Depth· At BI Cl D"
0-0.002m (0 - 0.078 in.) 0.79 0.77 0.68 0.69
0.008 - 0.010 m (0.32 - 0.39 in.) 0.85 0.67 0.58 0.60
0.024 - 0.026 m (0.95 - 1.02 in.) 0.88 0.77 0.68 0.69
0.048 - 0.050 m (1.89 - 1.97 in) 0.36 1.14 0.72 1.16
"::»ample oepm trom negatlve e ectroae lNaLl). m.
A B C D
Change, Change. Change, Change,
Total time,he Current, amps percent Current. amps percent Current, amps percent Current, amps percent
0 0.265 0.00 0.276 0.00 0.286 0.00 0.264 0.00 3 0.233 -11.86 0.247 -10.49 0.251 -12.30 0.230 -13.00 6 -
-
0.226 -18.26 0.223 -21.77 0.207 -21.73 9-
- 0.227 -17.85 0.226 -20.90 0.191 -27.61 12-
--
- 0.255 -10.79 0.197 セRUNSV 18-
--
--
-
0.215 -18.66 24-
-
-
-
-
-
--Charge Charge Charge Charge
passed, Change, passed, Change, passed, Change, passed, Change.
Total time,hr coulombs!3 hr percent coulombs/3hr percent coulombsl3he ー・イ」セョエ coulombs/3 hr percent 0 3 3853 0.00 4297 0.00 4332 0.00 3626 0.00 6 3267 -15.21 3766 -12.36 3433 -20.75 3100 -14.51 9
-
-
3514 -18.22 3442 -20.54 2765 -23.75 12-
-
3820 -11.10 3705 -14.47 2610 -28.02 18-
-
-
-
4433 2.33 3042 -16.12 24-
-
-
-
-
-
3716 2.48Resistivity, Change, Resistivity, Change, Resistivity, Change, Resistivity, Change,
Total time.hr ohm-em percent ohm-em percent ohm-em percent ohm-em percent
0 2576 0.00 2527 0.00 2424 0.00 2674 0.00 3 2793 8.42 2667 5.54 2588 6.77 3214 20.19 6 3103 20.46 2879 13.93 2910 20.05 3257 21.80 9
-
-
2831 12.03 3079 27.02 3546 32.61 12-
-
2712 1.69 2673 10.27 3644 36.28 18-
-
--
2299 -5.16 3245 21.35 24-
-
--
-
- 2901 8.49 Currentgive8 the same ranking for the four concrete 8pecimens (cured at 1, 6, 28, and 68 weeks) tested, and can replace the rapid chloride test for those types of concrete.
6. Correlations with the rapid cWoride test on blended ce-ment concretes have not as yet been attempted.
Table 8-Current parameters as a function of time of polarization by Method 3 on 28·day·old concrete
Table 9-Chloride profiles for 28'daY'0Id concrete specimens (A through OJ after polarization by Method 3
tA = 06hrof polarization. *B=12 hr of polarization. §C = 18 hr of polarization.
-*n=24 hr of polarization,
REFERENCES
1, "Durability of Concrete Bridge Decks-A Cooperative Study, Final
Report,"ReportebセVWNoャeL Portland Cement Association, Skokie, 1970,
76pp.
2. Spellman, D. L., and StratfulI, R. E, "Chlorides and Bridge Deck
Deterioration," Highway Research Record No. 328, HRB, National
Research Council, Washington, D,C" 1970, pp.SXセTYL
3. Clear,K.C., "Perfonnance after 830 Daily Salt Applications,"QQュ・セ
to-Corrosion of Reinforcing Steel in Concrete Slabs, Vol. 3, Report
9. Goto, S.; Tsursetani, M.; Yanagida, H.: and Kondo,R.,"Diffusion of
Chloride Ions in Hardened Cement Paste," Yogyo Kyokoishi,V. 87, No.3,
,1979,W· 126· 133.
to.'Gnto, S., and Roy, D. M., Diffusion of Ions through Hardened
Cement-Paste,"Cement and Concrete Research,V. 11, No.5, 1981, pp.
751·757.
11. Feldman. R; Chan, G. W.; and Brousseau, R.J.,"Chloride Iondゥヲヲオセ
sivity of Blended Cement Mortars: A.C. Impedance and Pore Structurep。セ
rameters," II Cementa,V. 90, No.4, 1993, pp. 207-220.
12. Mobasher, B., and Mitchell, T., "Laboratory Experience with the
Rapid Chloride Permeability Test,"Permeability of Concrete, SP-I08,
American Concrete Institute, Detroit, 1988, pp.QQWセQTTN
13. Mobasher,8., and Mitchell, T., "Precision Data for Test ford・エ・イセ
mining the Chloride Permeability of Concrete,"Report R.R. #C·9·1004,
ASTM, Philadelphia, 1986.
14. Ozyildirim, C., and Halstead, W., "Resistance to Chloride Ionp・ョ・セ
tration of Concretes Containing Fly Ash, Silica Fume, or Slag,"Perme·
ACI Materials Journal/May-June 1994
ability of Concrete, spセQPXL American Concrete Institute, Detroit, 1988, pp.35-61.
15. Plauto, P., and Bilodeau;A.,"Rapid Chloride Ion Permeability Test:
Data on Concretes Incorporating Supplementary Cementing Materials,"
Fly Ash, Silica Fume, Slag, and Natural Pozzolans in Concrete,SP-114, V. I, American Concrete Institute, Detroit, 1988, pp. 625-644.
16. Luther, M. P., "Silica Fume (Micro Silica) Effects on Concretep・イセ
meability and Steel Corrosion," Recent Advances in Concrete Technology:
Concrete Durability and Repair,P. Soroushian and S. Ravanbakhsh, eds., 'Michigan State University, E. Lansing, Feb. 1990, pp.UセQMUMQYN
17. McCarter, W. J., and Brousseau, R. J., "A.C. Response of Hardened
cセュ・ョエ Paste,"Cement and Concrete Research,V. 20, 1990, p. 891. 18. Zhang, M., andgェセイカN O. E., "Permeability ofhゥァィセsエイ・ョァエィ lゥァィエセ
weight Concrete," ACI Materials Journal, V.88, No.5, Sept.-Oct. 1991,
pp. 463-469.