https://doi.org/10.4224/5763149
READ THESE TERMS AND CONDITIONS CAREFULLY BEFORE USING THIS WEBSITE. https://nrc-publications.canada.ca/eng/copyright
Vous avez des questions? Nous pouvons vous aider. Pour communiquer directement avec un auteur, consultez la
première page de la revue dans laquelle son article a été publié afin de trouver ses coordonnées. Si vous n’arrivez pas à les repérer, communiquez avec nous à [email protected].
Questions? Contact the NRC Publications Archive team at
[email protected]. If you wish to email the authors directly, please see the first page of the publication for their contact information.
NRC Publications Archive
Archives des publications du CNRC
For the publisher’s version, please access the DOI link below./ Pour consulter la version de l’éditeur, utilisez le lien DOI ci-dessous.
Access and use of this website and the material on it are subject to the Terms and Conditions set forth at
Simplified Ant Colony System applied to the Quadratic Assignment
Problem
Barton, Alan
https://publications-cnrc.canada.ca/fra/droits
L’accès à ce site Web et l’utilisation de son contenu sont assujettis aux conditions présentées dans le site LISEZ CES CONDITIONS ATTENTIVEMENT AVANT D’UTILISER CE SITE WEB.
NRC Publications Record / Notice d'Archives des publications de CNRC:
https://nrc-publications.canada.ca/eng/view/object/?id=54cbd58d-7f14-4b32-824c-17f81d9d8621
https://publications-cnrc.canada.ca/fra/voir/objet/?id=54cbd58d-7f14-4b32-824c-17f81d9d8621
National Research Council Canada Institute for Information Technology Conseil national de recherches Canada Institut de technologie de l'information
A Simplified Ant Colony System Applied to the
Quadratic Assignment Problem *
Barton, A.
March 2005
* published as NRC/ERB-1123. March 30, 2005. 4 Pages. NRC 47446.
Copyright 2005 by
National Research Council of Canada
Permission is granted to quote short excerpts and to reproduce figures and tables from this report, provided that the source of such material is fully acknowledged.
National Research Council Canada Institute for Information Technology Conseil national de recherches Canada Institut de technologie de l'information
A Sim plifie d Ant Colony
Syst e m Applie d t o t he
Qua dra t ic Assignm e nt
Proble m
Barton, A.
March 2005
Copyright 2005 by
National Research Council of Canada
Permission is granted to quote short excerpts and to reproduce figures and tables from this report, provided that the source of such material is fully acknowledged.
ERB-1123
A Simplified Ant Colony System applied
to the Quadratic Assignment Problem
∗Alan J. Barton
† Integrated Reasoning Group Institute for Information Technology National Research Council CanadaOttawa, Canada, K1A 0R6
[email protected]
ABSTRACT
An attempt is made to solve the Quadratic Assignment Problem through the development of a simplified ant colony system in C. Experiments with the implementation are per-formed and reported.
Keywords
NP-hard, swarm intelligence, stigmergy, emergent behaviour
1.
INTRODUCTION
The Quadratic Assignment Problem (QAP) is a challenge in combinatorial optimization, as it is computationally non-trivial to solve even modest sized problems (e.g. n = 20) [3]. Approaches for attempting to solve QAP include brute-force search, tabu search, and many others [2]. An imple-mentation of a simple form of the Ant Colony System (ACS) (p.46[1]), (based upon the Ant System) as it applies to QAP is investigated.
2.
QUADRATIC ASSIGNMENT PROBLEM
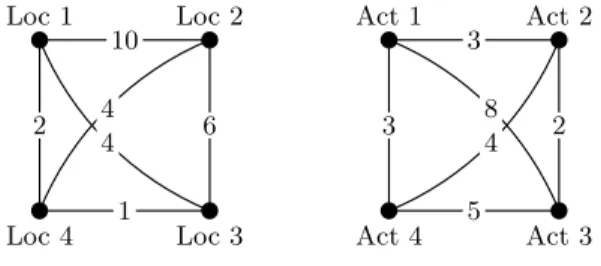
The QAP was first introduced by Koopmans and Beckman in 1957 (p.56[1]) and entails assigning n activities to n lo-cations (or vice versa). The left portion of Fig-1 gives one possible visual representation (graph) of the distance matrix (depicted in (1)), of distances between locations. Such dis-tance measurements may be based on the Euclidean, Man-hattan, or other metrics. Whereas, the right portion of Fig-1 demonstrates a graph for the flow matrix in (2); represent-ing flow of material, people, objects, etc. from one activity to another. This NP-hard problem, of assigning activities to locations in the best way, involves searching through an assignment space of all possible permutations, of size n!. ∗Second Assignment for the course COMP5900Z entitled Swarm Intelligence at Carleton University
†Master of Computer Science (in progress)
Loc 1 Loc 2 Loc 3 Loc 4 10 4 2 4 6 1 Act 1 Act 2 Act 3 Act 4 3 8 3 2 4 5
Figure 1: Left: Distances between locations, Right: Flow between activities
D= 2 6 6 4 0 10 4 2 10 0 6 4 4 6 0 1 2 4 1 0 3 7 7 5 (1) F = 2 6 6 4 0 3 8 3 3 0 2 4 8 2 0 5 3 4 5 0 3 7 7 5 (2)
3.
ANT SYSTEM SOLUTION
The Ant System (AS) solution to QAP was proposed in 1994 by Maniezzo et al (p.57[1]). The solution involves[1]:
1. a graph representation, similar to the Travelling Sales-man Problem (TSP), where the nodes of the graph are locations, and the ants’ goal is to visit all the loca-tions and match an activity to it, forming a bijective mapping from activities to locations.
2. ants memorizing locations that they have visited, so that they never visit them again.
3. ants memorizing the activities that have been mapped to the visited locations.
4. devising a heuristic that allows solutions to be con-structed directly.
A solution may be constructed from Fig-1 by constructing a vector comprised of the potentially best distances, called dis-tance potentials, from (1), and potentially best flows, called flow potentials, from (2) by summing each row yielding (3) and (4), respectively. d= 2 6 6 4 16 20 11 7 3 7 7 5 (3) f= 2 6 6 4 14 9 15 12 3 7 7 5 (4)
An abstract form of the implementation of the algorithm is listed as Alg-1.
Algorithm 1. AS-QAP(α, β, ρ, m, tmax, τ0, Q, seed) 1 a s s i g n i n i t i a l p h e r o m o n e l e v e l s ( ) 2 c o m p u t e d i s t a n c e p o t e n t i a l s ( ) 3 c o m p u t e f l o w p o t e n t i a l s ( ) 4 c o m p u t e c o u p l i n g m a t r i x ( ) 5 p l a c e a n t s o n l o c a t i o n s ( ) 6 f o r ( t ← 1 ) t o ( t max ) do 7 f o r ( k ← 0 ) t o ( num ants −1) do 8 b u i l d s o l u t i o n f o r a n t ( k ) 9 endfor 10 f o r ( k ← 0 ) t o ( num ants −1) do 11 c o m p u t e c o s t o f s o l u t i o n f o r a n t ( k ) 12 endfor 13 f o r ( k ← 0 ) t o ( num ants −1) do 14 i f ( a n t s [ k ] . c o s t o f s o l u t i o n < 15 BEST SOLUTION . c o s t o f s o l u t i o n ) 16 then 17 BEST SOLUTION ← a n t s [ k ] 18 BEST SOLUTION t ← t 19 endif 20 endfor 21 u p d a t e p h e r o m o n e t r a i l s ( ) 22 w r i t e e x p e r i m e n t a l r e s u l t s ( t ) 23 endfor — End of Algorithm —
4.
EXPERIMENTAL SETUP
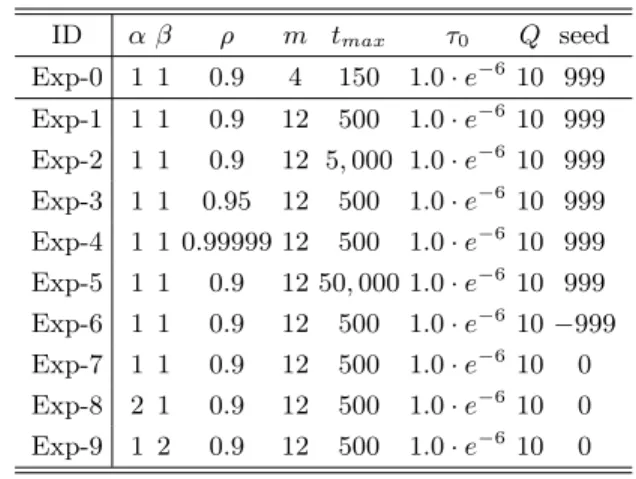
A C language based implementation of AS-QAP was made. 10 experiments were performed using experimental parame-ters listed in Table-1. The experiments focused on two prob-lem data sets, i) the n = 4 case as given in [1] and ii) the n= 12 case as given by Nugent(12) [3].
5.
RESULTS
For n = 4, it can be seen in Fig-2 that pheromone levels have a layered effect of approximately every 0.01 intervals on the z-axis over 150 ticks. One conjecture, is that once
Table 1: Experimental Parameters investigated us-ing a C-based implementation of AS-QAP for two example problems (n = 4, 12) ID α β ρ m tmax τ0 Q seed Exp-0 1 1 0.9 4 150 1.0 · e−6 10 999 Exp-1 1 1 0.9 12 500 1.0 · e−6 10 999 Exp-2 1 1 0.9 12 5, 000 1.0 · e−6 10 999 Exp-3 1 1 0.95 12 500 1.0 · e−6 10 999 Exp-4 1 1 0.99999 12 500 1.0 · e−6 10 999 Exp-5 1 1 0.9 12 50, 000 1.0 · e−6 10 999 Exp-6 1 1 0.9 12 500 1.0 · e−6 10 −999 Exp-7 1 1 0.9 12 500 1.0 · e−6 10 0 Exp-8 2 1 0.9 12 500 1.0 · e−6 10 0 Exp-9 1 2 0.9 12 500 1.0 · e−6 10 0 0 20 40 60 80 100 120 140 160 0 2 4 6 8 10 12 14 16 0 0.01 0.02 0.03 0.04 0.05 0.06 0.07 Pheromone Level Time Step (t) Pheromone Matrix Index
Pheromone Level
Figure 2: Exp-0: Pheromone levels changing over time for each τi,j
a pheromone level is established that is slightly higher than the rest, then other ants continue to follow and more readily deposit pheromone on those activity/location couplings. In terms of the computed solution for QAP, where n = 4, the best result is found after 2 iterations, with a value of 631; the bottom line in Fig-3. It is interesting to notice the com-pression in the variance of the ant solutions after tick 80 to a value of approximately 652. Indicating that the algorithm is incapable of finding further solution candidates after this tick.
For n = 12, it can be seen in Fig-4 that a similar layered effect to Fig-2 is exhibited. It is unclear why this observed effect has occurred. One conjecture is that the number of ants m will lead to m layers, but that is not supported by the facts (Fig-2 and Fig-4). Another conjecture is that because the ants are all randomly walking and depositing pheromone, the equations for pheromone depositing lead di-rectly to this effect. The equation would need to be more closely examined in order to support or dispute this claim.
630 640 650 660 670 680 690 700 710 720 0 20 40 60 80 100 120 140 160 Solution Time Step (t)
Min solution over all ants at time t Max solution over all ants at time t Mean solution over all ants at time t Best solution found until time t
Figure 3: Exp-0: Solution costs changing over time. (Best solution cost = 631)
0 50 100 150 200 250 300 350 400 450 500 0 20 40 60 80 100 120 140 160 0 0.001 0.002 0.003 0.004 0.005 0.006 0.007 0.008 Pheromone Level Time Step (t) Pheromone Matrix Index
Pheromone Level
Figure 4: Exp-1: Pheromone levels changing over time for each τi,j
All experiments were investigated as per the methodology implicit in Fig-5. All of the results portray similar large variance and approximately stable mean values (results not shown). This may indicate that either i) the ants are fol-lowing pheromone too closely, and not properly exploring the search space, or ii) the fitness landscape is very diffi-cult, in that a slight change in a permutation may lead to a large change in the fitness (solution) value, making search very difficult. Fig-6 shows the results for each of the Nu-gent(12) experiments (9 in total) that were performed. The best overall solution (8, 698) was discovered by Exp-5 after 28, 296 iterations, while the second best solution (8, 702) was discovered by Exp-1 and Exp-2 (both) after 448 iterations, indicating that the 10-fold increase in tmax(Table-1) did not
enhance the ant solution discovery process.
8700 8750 8800 8850 8900 8950 9000 9050 9100 9150 9200 0 50 100 150 200 250 300 350 400 450 500 Solution Time Step (t)
Min solution over all ants at time t Max solution over all ants at time t Mean solution over all ants at time t Best solution found until time t
Figure 5: Exp-1: Value of minimum, mean and max-imum per tick solutions constructed by the ants. Fi-nal best solution = 8702
8698 8700 8702 8704 8706 8708 8710 8712 8714 Exp 9 Exp 8 Exp 7 Exp 6 Exp 5 Exp 4 Exp 3 Exp 2 Exp 2 Exp 1 50 100 150 200 250 300 350 400 450 500 Solution Iteration Experiment
Solution Values over Experiments Max solution over all ants at time t
Figure 6: Absolute best solution discovered by each ant experiment for n = 12. Exp-5, with 28, 296 itera-tions, found the best solution value of 8, 698.
6.
CONCLUSIONS
An ant based solution for the Quadratic Assignment Prob-lem has been impProb-lemented and investigated. Good results are exhibited, with high variance, for n = 4 leading to the conjecture that a correct implementation has been per-formed. More detailed analysis of the results of the exper-iments (179MB of data) are necessary in future investiga-tions. Including the possibility of making ρ a function of i) time and ii) the relative change of the mean (or best) solution.
7.
REFERENCES
[1] E. Bonabeau, M. Dorigo, and G. Theraulaz. Swarm Intelligence From Natural to Artificial Systems. Number ISBN 0-19-513159-2 in Sante Fe Institute Studies in the Sciences of Complexity. Oxford University Press, 198 Madison Avenue, New York, New York 10016, 1999. [2] R. Burkard, E. C¸ ela, S. Karische, and F. Rendl.
QAPLIB - A Quadratic Assignment Problem LIBrary. http://www.opt.math.tu-graz.ac.at/qaplib/. Graz University of Technology, Austria., March 2005. [3] R. E. Burkard, S. E. Karisch, and F. Rendl. QAPLIB
-a Qu-adr-atic Assignment Problem Libr-ary. Journ-al of Global Optimization, 10:391–403, 1997.