HAL Id: hal-01208971
https://hal.archives-ouvertes.fr/hal-01208971
Submitted on 5 Jun 2020HAL is a multi-disciplinary open access archive for the deposit and dissemination of sci-entific research documents, whether they are pub-lished or not. The documents may come from teaching and research institutions in France or abroad, or from public or private research centers.
L’archive ouverte pluridisciplinaire HAL, est destinée au dépôt et à la diffusion de documents scientifiques de niveau recherche, publiés ou non, émanant des établissements d’enseignement et de recherche français ou étrangers, des laboratoires publics ou privés.
External Competitiveness
Angela Cheptea, Charlotte Emlinger, Lionel Fontagné, Gianluca Orefice, Olga
Pindyuk, Robert Stehrer
To cite this version:
Angela Cheptea, Charlotte Emlinger, Lionel Fontagné, Gianluca Orefice, Olga Pindyuk, et al.. The Development of EU and EU Member States’ External Competitiveness. [University works] auto-saisine. 2014, 68 p. �hal-01208971�
Highlights
We revisit EU competitveness scores using post-crisis data.
While EU market share were at their 2000 level in 2007, they deteriorated afterwards, even for high-end and high-tech products.
EU exports still embody 85% of value added created in the EU, despite increasing fragmentation of value chains. Therefore European exports are still predominently "Made in Europe".
EU manufacturing exports increasingly include value added in services.
Competitveness in services is an important determinant of future European industry.
This working paper is based on a research commissioned by the Commission of the European Communities (specifi c contract n° SI2.630108). The views expressed herein are those of the authors, and do not represent any offi cial view of the Commission. The paper is complemented by an online appendix replicating the results of the paper taking account of intra-EU trade (not included in the main text), and providing results (with and without intra-EU trade) for individual Member States.
The Development of EU and
EU Member States’ External
Competitiveness
No 2014-06 – March
Working Paper
Angela Cheptea, Lionel Fontagné, Charlotte Emlinger,
Gianluca Orefice, Olga Pindyuk & Robert Stehrer
Abstract
We revisit competitiveness issues using recent data and show that the global fi nancial crisis has taken a toll on European producers that before 2007 were maintaining their market positions. The EU competitiveness in goods has recently deteriorated, even in the upper and high-tech segments of the world market. The decline recorded by European exporters is attributable purely to performance and not to adverse orientation of their exports. However, European exports are predominantly "Made in Europe" and include an increasing share of services. The within Europe advantages in manufacturing seem to have been exhausted and further gains imply moves outside the EU with an enhanced focus on the competitiveness in services as an important determinant of future European industry.
Keywords
Competitiveness, trade in value added.
JEL
F14, F15.
CEPII (Centre d’Etudes Prospectives et d’Informations Internationales) is a French institute dedicated to producing independent, policy-oriented economic research helpful to understand the international economic environment and challenges in the areas of trade policy, competitiveness, macroeconomics, international fi nance and growth.
CEPII Working Paper
Contributing to research in international economics
© CEPII, PARIS, 2014
All rights reserved. Opinions expressed in this publication are those of the author(s) alone. Editorial Director: Sébastien Jean Production: Laure Boivin No ISSN: 1293-2574 CEPII 113, rue de Grenelle 75007 Paris +33 1 53 68 55 00 www.cepii.fr
Press contact: [email protected]
The Development of EU and EU Member States’ External Competitiveness Angela Cheptea*, Charlotte Emlinger**, Lionel Fontagné#, Gianluca Orefice**,
Olga Pindyuk***, Robert Stehrer***
1. Introduction
According to Curran and Zignago (2009) who exploited detailed data up to 2005, European Union1 external competitiveness had been resilient to the emergence of new competitors, contrasting with the deindustrialisation observed in the US and to a lesser extent in Japan. This positive outlook was based on the fact that, on the whole, the EU had managed to exploit its advantage in top quality (and to a much smaller extent technological) products, and had done so by exploiting the diversity of its comparative advantage within the enlarged Union, ranging from low cost producing locations to laboratories at the top of their respective fields in several domains.
The purpose of the present paper is to revisit these issues using up to date data and taking account of new developments in the analysis of Global Value Chains (GVC). We consider the dramatic macroeconomic counter-performances in Europe since 2008, contrasting them with resilient emerging markets and a slightly recovering US economy. How much has the crisis taken its toll on European exporters? Has the market positioning of top products been an advantage in the crisis, or has it penalised export performance? Have emerging markets benefited from a sluggish Europe and destroyed the export positions of weakened European exporters? Have services smoothed or exacerbated these evolutions?
Our analysis uses the most recent data and methods to address these questions. Detailed trade data from BACI (a database developed by CEPII using UN COMTRADE as source data; see Gaulier and Zignago, 2010) are exploited to assess the market positioning of traded products and their technological content.2 The World Input-Output database (WIOD), the new input-output database developed with EU funding, is used to determine how value chains are organised and what this means for specialisation. Finally, CHELEM (another database developed by CEPII) is used to assess trade in goods and services within a common framework. Our methodology relies on shift-share decomposition of the changes in market shares (Cheptea, Fontagné and Zignago, 2014), the measurement of market positioning based on unit values proposed in Fontagné, Gaulier and Zignago, (2008), and the measurement of specialisation in value added (Stehrer, 2012).
*INRA, UMR1302 SMART, F-35000 Rennes, France and IAW, Tübingen, Germany. #PSE (University Paris 1) and CEPII
**CEPII
***The Vienna Institute for International Economic Studies – wiiw
1
EU with 27 Member States.
2
Contrary to Curran and Zignago (2009), goods trade figures used in our paper include mineral products HS25, HS26 and mineral fuels HS27. This has to be kept in mind when looking at the results. The inclusion of these products was motivated by the presence of oil exporting country as Russia, in the sample. However this does not change the overall message because the volatility of mineral prices does not influence dramatically the dynamics of market shares. The main difference is only on the levels of the market shares because of the weight of oil producing countries in total trade.
While export positions have withstood better than might have been feared in the medium run, there has been a shift during the crisis. All EU market share losses recorded since 2000 occurred since 2007. No market segment was sufficiently resilient to the crisis. Overall, though, European trade performance has remained substantial compared to Japan and the US. But recent evolutions to the extent that these are not only due to the economic cycle could pose future challenges. We show clearly that EUthe EU lost 1.3 percentage points of its world market share between 2007 and 2010. This contrasts with a stable market share between 2000 and 2007. This loss corresponds to 8% and the trend of the EU is now similar to that of the US (-8%) and Japan (-7%), which contrasts with the situation before the crisis when European market shares were very resilient compared to US or Japanese shares. All EU Member States except the new Member States are following such trend: during 2007-2010, the largest losses in world market shares (in absolute terms) were posted by Italy, Germany and the UK.3 The picture is similar in percentage terms: Italy lost 14% of its market share over the period 2007-2010, the UK 9%, Germany and France 6% each. European competitiveness was hinging on of top range and high tech products; however, even these two segments have evolved poorly for European producers since 2007 although less than the other segments. In the upper segment of the market, Germany lost 12% market share during 2007-2010; and the corresponding figures are 18% for Spain, 17% for Italy, 15% for Sweden, 14% for France. In high tech products, Finland forfeited is position as the main producer of cell phones losing 49% of its world market share over 2007-2010, while Hungary lost 10%, Germany, Ireland and Sweden 7% each, and the UK 5%. On the other hand, EU products increasingly comprise services. This suggests that competitiveness in services is an important determinant of future European industry. In fact, we conclude also that the pattern of specialisation in European industry is changing due to the break up of value chains. We show in this paper that industry is no longer only about industrial activities: European manufacturing industry relies increasingly on services: services are exported indirectly by the manufacturing sector. However, this means also that European industrial competitiveness is relying increasingly on competitiveness in services. Policies to revamp competition and innovation in services at the European level are at the core of any future revamp of the competitiveness of the manufacturing sector.
The recently developed data on trade in value added show that the international integration of the EU has increased: EU exports embodied less EU value added in 2011 than in 1995 and more foreign value added. However, EU exports still embody some 85% of value added created in the EU, therefore, European exports are still predominantly “Made in Europe”. At the same time, the EU is also providing more inputs to other countries’ exports, indicating that this fragmentation of production is a two-way process.
From the perspective of individual EU members there is a wide range of vertical specialisation across countries, ranging from a domestic content of slightly less than 80% (e.g. UK, Romania, Greece) to close to 50% (e.g. Czech Republic, Hungary, Belgium) and even lower for Luxembourg. Differentiating between intra- and extra-EU vertical specialisation we see that in 2011 the EU share in foreign value added of these countries’ exports ranged from more than 60% (e.g. Luxembourg and Austria) to slightly above 30% (e.g. Greece and Lithuania). Although intra-EU integration is still stronger than integration with extra-EU countries, over time the latter has grown more than the first.
3
Romania, Estonia, Lithuania, Poland posted small gains (0.1 percent of the world market each) over the period 2007-2010; in the remaining New Member States there were no gains.
The rest of the paper is organised as follows.4 Section 2 shows that, during the crisis, trade in services has been more resilient than trade in goods. Section 3 describes the changes in the specialisation of European countries during the crisis. We consider seriously the role of services, the market and technological positioning of European exports, and the role of GVC. The concentration of market share losses since the crisis is analysed in Section 4. Section 5 concludes.
2. Recent evolution of trade in goods and services
As stated in the introduction, this paper aims to analyse changes in the specialisation patterns of the EU with a particular focus on the increasing role of services and the “servitization” of the manufacturing sector. Hence, this section discusses the historical evolution of trade in services since the late 1960s, focusing on the comparison of trade in services and trade in manufactured goods. We show the changing pattern of trade in services and goods during the recent economic crisis.
We start by comparing historical patterns of trade in goods and trade in services. The exponential increase in both trade in goods and trade in services since the early 1960s has not mirrored changes in the domestic economies of advanced countries. Trade in goods still plays a crucial role in worldwide trade patterns (Figure 1) while services now represent the largest share of the domestic economies in advanced countries. The share of trade in services over trade in goods has been continuously increasing since the early 1970s: in 1973 trade in services represented less than 20% of trade in goods; in 2013 it counts for almost 25%.
Two main reasons explain this increase in trade in services. First, new communication technologies have allowed service tasks to be traded internationally and/or relocated abroad (offshoring of services), with an implied increase in the value of trade in services (Amiti and Wei 2005). Second, there has been increasing liberalisation of trade in services: preferential trade agreements (PTAs) in services have proliferated since 2000 (Roy 2011). Before 2000 only five PTAs on services were registered with the World Trade Organization (WTO); since 2000, 85 additional agreements have been notified with others under negotiation and due to be notified.5 Further, the commitments on services usually go beyond those made by governments under the GATS; this suggests an even bigger effort by governments to liberalise trade in services.
4
This paper is complemented by an on-line appendix replicating the paper’s results but taking account of intra-EU trade (not included here), and providing results (with and without intra-EU trade) for individual member states. We refer, for example, to ‘OLA-A1’ to indicate Table A.1 in the on-line appendix.
5
An important feature concerning preferential agreements on services is that they can be negotiated outside the multilateral system.
Figure 1. Historical patterns of trade in goods and services worldwide.
Source: Authors calculations on CHELEM (CEPII)
We can thus conclude that the role of trade in services has increased strong in recent decades, which calls for detailed analysis of EU specialisation in trade in services. We next investigate whether the recent economic crisis has affected the pattern of trade in services and which service sectors have suffered the most.
While trade in goods collapsed in 2008 with the onset of the economic crisis, trade in services was more resilient and suffered to a lesser extent. Figure 1 shows that in 2007 to 2008 the downward trend in trade was more pronounced for goods than services: after 2007 trade in goods collapsed by almost 40% while trade in services fell by “only” 20%.
The economic rationale for the resilience of trade in services during the crisis is its nature compared to trade in goods. Demand for many traded services is less cyclical, and production of services does not depend on the financial sector as the production of goods does (Borchert and Mattoo 2009). This argument is supported by the trend lines in Figure 2 where trade in services is disaggregated by sector.
The volume of trade in services strictly related to trade in goods (i.e. transport sector and financial services sector) shrank consistently after the crisis; while service sectors unrelated to trade in goods (communication and informatics services) have suffered less and have maintained their pre-crisis values.
14 16 18 20 22 24 26 28 30 0 2 000 4 000 6 000 8 000 10 000 12 000 14 000 16 000 18 000 B ill io n s o f US d o llar s
Figure 2. Historical pattern of trade in services – sector disaggregation
Source: Authors calculations on CHELEM (CEPII)
Given its resilience, trade in services represents an opportunity for government to recover from the crisis by driving national specialisation towards those service sectors not badly affected by the economic crisis. This conclusion is based on simple trade in services data and, thus, represents only a part of the complex process of “servitization” of manufacturing exports because such figures hide –the fact that services are mostly embodied in goods and therefore traded indirectly through trade in goods. In next chapter we show that an increasing part of EU trade in goods is actually value added from services. This is driven by the increasing externalisation of services by manufacturing firms and by the increasing service content in many manufactured goods.
Finally, has the recent economic crisis affected world trade patterns by sector (Table 1) and country (Table 2) differently? Figure 1 shows that trade in goods increased over recent decades with a steep rise in 2000-2007 followed by a reduction in 2008-2010. There are several reasons for the rise in 2000-2007, including: (i) China’s entry to the WTO, (ii) the huge number of PTAs signed in this period around the world (WTO, 2011), (iii) increased demand for exports from developing countries (Brazil, China, India and Russia among others). Conversely, there is only one reason for the reduction in trade in goods in 2008-2010: the recent financial crisis and the consequent contraction in demand for exports. This is only a general picture of overall trade in goods, and more detailed (sector specific) analysis is provided in Tables 1 and 2, which show the structure of world trade by sector (NACE classification), and importing market.
Table 1 shows the industry specific shares (over total trade) in 2000, 2007 and 2010 and their changes in (percentage points, p.p.) in the periods 2000-2007, 2000-2010 and 2007-2010. Comparing the periods before and after the crisis (i.e. 2000-2007 vs 2007-2010) we do not observe any important changes: the crisis did not affect the sectoral pattern of trade. Only “Basic Metals and Metal Products” and “Machinery NEC” experienced reductions in the period 2007-2010 greater than changes in the pre-crisis period. All other sectors showing negative changes in 2007-2010 had experienced negative changes in the pre-crisis period.
0 100 200 300 400 500 600 700 800 900 0 50 100 150 200 250 300 350 2002 2003 2004 2005 2006 2007 2008 2009 2010 B ili o n s o f US D
However, the crisis has changed countries’ trade patterns. Table 2 shows country shares in world imports for the same time periods as in Table 1. Contrasting with the pre-crisis period, the EU market was particularly hit by the crisis years (2007-2010). Brazil and the South American countries were less affected and managed to offset pre-crisis losses in market share. Notice also the role of North America and USA, traditionally large destination markets which contracted respectively from 29.2% and 24.4% of word imports in 2000 to 18.6% and 15.4% in 2010. Finally, Asia’s leading position as a destination market was confirmed, increasing from 31% market share in 2000 to 37.5% in 2010 (with a positive change in the 2007-2010 period). This profound reshaping of world trade may have played a role in the redistribution of exporters’ market share: we will investigate this issue below.
The aim of this section was to provide a brief historical context to the worldwide increasing role of trade in services (over trade in goods) and to highlight the role of the recent economic crisis on trade in services and manufacturing goods. We show that the role of trade in services (as a share of trade in goods) increased greatly in the period 1980-1995 and persisted even during the crisis (resilience of trade in services). We also provide descriptive evidence that the crisis did affect less the sector composition of world trade in goods than the geographic orientation of world trade, with Asian countries experiencing increasing market shares after the crisis, and the EU and North America experiencing a reduction in market shares.
In what follows we focus on country specific patterns of trade specialisation (macro sector and within service sub-sector comparisons), to show which countries’ macro specialisation changed during the crisis.
Table 1. The sectoral composition of world trade in goods
NACE industry name
Shares of world imports, % Changes in shares, p.p. 2000 2007 2010 2000-2007 2007-2010 2000-2010 Agriculture, Hunting, Forestry and Fishing 2.82 2.53 2.80 -0.29 0.28 -0.01
Basic Metals and Fabricated Metal Products 7.27 10.03 9.18 2.76 -0.85 1.91
Chemicals and Chemical Products 8.92 9.79 10.40 0.87 0.61 1.48
Coke, Refined Petroleum and Nuclear Fuel 3.16 4.69 5.27 1.54 0.58 2.11
Electrical and Optical Equipment 25.96 20.68 20.27 -5.29 -0.4 -5.69
Electricity, Gas and Water Supply 0.14 0.16 0.15 0.02 -0.01 0.01
Food, Beverages and Tobacco 4.37 4.17 4.56 -0.21 0.39 0.18
Leather, Leather and Footwear 1.24 1.10 1.08 -0.14 -0.02 -0.16
Machinery, Nec 8.15 9.21 8.67 1.05 -0.54 0.51
Manufacturing, Nec; Recycling 3.21 2.91 2.96 -0.30 0.05 -0.25
Mining and Quarrying 10.59 13.94 15.31 3.35 1.37 4.72
Other Community, Social and Personal
Services 0.01 0.01 0.01 0.00 0.00 0.00
Other Non-Metallic Mineral Products 1.07 1.04 0.99 -0.03 -0.05 -0.08
Pulp, Paper, Paper , Printing and Publishing 2.31 1.71 1.59 -0.60 -0.12 -0.72
Renting of M&Eq and Other Business Activities 0.01 0.01 0.01 0.00 0.00 0.00
Rubber and Plastics 2.12 2.17 2.28 0.05 0.11 0.16
Textiles and Textile Products 5.95 4.46 4.21 -1.48 -0.25 -1.74
Transport Equipment 11.71 10.64 9.67 -1.07 -0.98 -2.04
Wood and Products of Wood and Cork 0.99 0.76 0.59 -0.23 -0.17 -0.40
Total (sum of the above) 100.00 100.00 100.00 0.00 0.00 0.00
Table 2. The composition of world trade by destination markets
Importer
Shares of world trade, % Changes in share, p.p. 2000 2007 2010 2000-2007 2007-2010 2000-2010 EU27 18.40 19.31 17.46 0.91 -1.85 -0.93 North America 29.19 21.84 18.64 -7.35 -3.2 -10.55 USA 24.39 18.29 15.46 -6.09 -2.83 -8.92 Latin-Central America 7.16 6.41 7.03 -0.75 0.62 -0.13 Brazil 1.21 1.11 1.55 -0.1 0.44 0.34 Rest of Europe 5.48 7.99 7.38 2.51 -0.61 1.9 Russia 0.87 2.16 1.96 1.29 -0.21 1.09
Middle East and Africa 5.85 8.34 8.80 2.49 0.46 2.95
Asia 31.01 33.33 37.55 2.32 4.23 6.55 Japan 7.34 5.71 5.42 -1.62 -0.29 -1.92 China 3.94 7.42 9.51 3.48 2.1 5.57 India 0.95 2.22 2.48 1.27 0.25 1.52 ASEAN 7.70 7.26 8.03 -0.44 0.76 0.33 South Korea 3.06 3.29 3.46 0.23 0.16 0.4
Source: Authors calculations using BACI data (CEPII).
3. European countries’ specialisation during the crisis
External trade performance and trade specialisation are often presented in terms of market share and its evolution. We conduct such an analysis in Section 4. However, decreasing world market shares for the rich countries is to some extent the natural outcome of the emergence of new competitors. This is not necessarily bad news for the longest industrialised countries since emerging markets increase the size of the pie to be shared among exporters. For this reason we systematically benchmark EU performance against changes in the market shares of the US and Japan, two big economies facing the same challenges.
Essentially, changes in market shares can be seen as the result of two forces: countries’ export abilities (comparative advantages), and international competition (absolute advantages). These are the two levels of analysis addressed in this paper.
The absolute advantage is driven by export composition (destination or sector) and external competitiveness. The comparative advantage of countries is a somewhat different issue. Comparative advantage refers to a country’s relative performance across sectors, regardless of its overall performance. Accordingly, countries specialise and become net exporters (importers) in sectors where they have advantage (disadvantage) in technology, market positioning, or production costs. In relation to specialisation, we investigate not market share, but how the country allocates its resources to alternative sectors, product categories or product ranges. Specialisation in a sector is counteracted by “de-specialisation” in another activity. It is generally acknowledged that a country’s observed specialisation mirrors its comparative advantages, which are not directly observable.
Among the wide range of indices of comparative advantage proposed in literature, we rely on two measures: (i) the CEPII index, and (ii) the RCA or Balassa index (see section 3.B for a description of this index). The CEPII index, used in Section 3.A, compares actual sector specific national trade balances with a theoretical balance assuming an absence of specialisation. This theoretical balance is computed by spreading the overall balance across sectors according to their respective shares in the country’s total trade.
The formula used to compute contributions to the trade balance normalised by total trade (in per thousands), is:
tot tot tot tot tot tot X M M X M X M X M XCEPII sec sec
sec sec
1000
where Xsec and Msec respectively represent the country’s exports and imports in a certain
sector; Xtot and Mtot respectively respect the country’s total exports and imports. Data on trade
in services come from balance of payments data, thus we do have information on partner countries.6 A positive (negative) value of this index shows that the country has a comparative advantage (disadvantage) in the sector analysed, since the actual trade balance is higher (lower) than the expected one in absence of any specialisation.
We use this index of comparative advantage to describe the evolution of EU competitiveness in international markets and to assess whether EU competitiveness has been affected by the recent economic crisis. This section provides measures of trade specialisation for the EU and some benchmark countries at different levels of disaggregation. We also consider trade in value added. Note that, unless otherwise stated, we consider the EU as a single economy, hence we do not consider intra-EU trade.
We examine the recent changes in European specialisation understood as changes in the allocation of resources across activities reflected by trade data, in three stages. First, we compare specialisation in goods and services from a broad sectoral perspective (section 3.A). Second, we focus on goods, taking advantage of highly disaggregated nature of the product classification to investigate specialisation processes within products, in market segments (section 3.B). Third, we investigate the manufacturing sector more deeply and consider the fragmentation of value chains (section 3.C). We then “reconcile” trade in goods and services and show that trade in goods provides indirect benefit to trade in services via trading production factor services.
Although data on trade in services is less detailed than the data on trade in goods, given the crucial and increasing role of services, it is worth taking a broader perspective and addressing EU specialisation in services, before our more detailed analysis of trade in manufactured goods. We examine the EU as a whole and then compare with USA, Japan and the BRIC (Brazil, Russia, India, China) countries, and also individual EU Member States. The results in section 3.A show that EU trade specialisation is moving towards trade in services, but retains comparative advantage in the manufacturing sector. This double comparative advantage is exceptional in a comparison with the USA and Japan, which have single sector specialisations in services and manufacturing respectively.
6
Thus, we cannot remove intra-EU trade in services to compute our index of specialisation and also cannot calculate the traditional Balassa index for the services sector.
Section 3.B discusses the EU comparative advantage in high value added products - high-tech and high value products. However, this advantage was not sufficient to shield against the adverse evolutions in the world market since the crisis.
Section 3.C investigates whether the trade patterns and comparative advantages observed so far change if we take a value added perspective. We focus on the domestic value added content of a country’s exports. We show that EU exports embodied less domestic value added (i.e. value added created in the EU) in 2011, and thus more foreign value added, compared to 1995. International fragmentation of production has been particularly pronounced in high tech manufacturing (where the EU has comparative advantage). Finally, we show that the figure for comparative advantage based on the domestic content of a country’s exports is very similar to the figure obtained using gross exports. More importantly, we show that domestic services account for an increasingly high share of value added in manufacturing exports. In 2011, services accounted for 39% of domestic valued added in EU exports of manufacturing goods – an increase of 4.5 p.p. since 1995. This is an example of so-called “servitization” of EU industrial exports.
3.1. EU specialisation in services versus goods
We start our analysis of EU trade specialisation by focusing on macro-sector specialisation in the EU, compared with other large developed countries (US, Japan) and using the BRIC countries as a benchmark. We replicate the analysis for individual EU Member States (detailed tables for Member States in the OLA A.4- A.5). We compare specialisation in goods and specialisation in services. We adopt a traditional approach that takes account only of direct exports of services. As already noted, we extend this approach in later sections by taking account of indirectly traded services, i.e. services embodied in exported goods. For goods, we distinguish between primary and manufactured products. Overall, this section shows that, for specialisation, the EU differs from both developing and other developed countries.
Figure 3 shows sector specific contributions to the trade balance (CEPII index of comparative advantage7) for three macro sectors (primary, manufacturing, services) in the period 2000-2010; Figure 4 uses the same time span and shows contributions to the trade balance for three within service sub-categories (travel, transport, other services).
In line with the comparative advantage of a high income economy shifting from manufactures to services, the EU shows increasing trade specialisation in services from 2002, and slightly decreasing specialisation in manufacturing and primary sector goods – see Figure 3. Among the three sub-categories in the services sector, the EU seems to be focused on pure service activities (i.e. all services except travel and transport) – see Figure 4. A similar pattern emerges for the USA: in 2000 to 2010 the USA experienced strong comparative advantage in services as a consequence of increased specialisation in travel and other services (i.e. financial, telecommunications, etc.).
However, contrasting with the USA, the EU has managed to keep an industrial base, taking advantage of the diversity of its comparative advantages, ranging from high tech to moderate wages. The main difference between the EU and the USA is accordingly that the EU has
7
developed an advantage in services while maintaining a non negligible advantage in manufacture while the USA shows a negative CEPII index for manufacturing industry across the entire period 2000-2010. Note that this simple approach uses gross exports of goods and services as reported by customs (for goods) or balance of payments data (for services) and does not include indirect exports of services.
The increase in European comparative advantage in the services sector is not a consequence of the recent crisis; Figure 3 shows that EU specialisation in services compared to goods began before the crisis but has not increased since 2007. The evidence is similar for India, which has maintained a positive CEPII index for services in the period 2000-2010.
In contrast to the EU and the USA and to what is expected from a high income country, Japan shows very strong specialisation in manufacturing only, and a negative CEPII index for both the services and primary sectors. However, Figure 4 shows that Japan has been increasing its specialisation in services consistently since 2003, particularly in “other services”, which includes financial and communications services among others.
The structure of comparative advantage for the developing countries such as the BRICs, is peculiar. China shows indeed strong and increasing advantage in manufacturing sector from 2002 to 2010 (perhaps as a consequence of WTO accession in 2001) and a reduction in primary sector specialisation. In the whole period 2000-2010 China’s leading sector measured by the CEPII index was manufacturing. India has experienced an important change in its leading sector: pre-2006 manufacturing had the highest comparative advantage index; after 2006 services became India’s leading sector. Brazil and Russia show clear and increasing specialisation in their primary sectors along the whole period considered.
Finally, the analysis of comparative advantage for single EU Member States (in OLA) shows wide differences in trade specialisation among EU Member States and a trend towards a polarised structure in macro-sector specialisation. Older industrialised Member States have lost their traditional comparative advantage in manufacturing (Belgium-Luxembourg, Germany, France and Italy have decreased CEPII indexes and/or reduced market shares), while new Member States are working towards achieving comparative advantage in services (Estonia, Latvia, Lithuania and Slovakia). The UK stands out for its high and increasing specialisation in services.
This section showed the peculiar double-sector (services and manufacturing) specialisation in the EU and introduces the detailed description/comparison of EU comparative advantages. This section focused on the role of trade in services, which has been shown to be increasingly important for the EU, especially the financial and telecommunications sectors.
Figure 3 International specialisation of the EU and its competitor (CEPII index) – Macro sectors aggregation
Source: Authors calculations using CHELEM data (CEPII).
-4 0 -2 0 0 20 2000 2002 2004 2006 2008 2010 year Primary Manufacturing Services EU27 -5 0 0 50 1 0 0 2000 2002 2004 2006 2008 2010 year Primary Manufacturing Services United States -2 0 0 -1 0 0 0 1 0 0 2 0 0 2000 2002 2004 2006 2008 2010 year Primary Manufacturing Services Japan -1 0 0 -5 0 0 50 1 0 0 1 5 0 2000 2002 2004 2006 2008 2010 year Primary Manufacturing Services China -1 0 0 -5 0 0 50 1 0 0 2000 2002 2004 2006 2008 2010 year Primary Manufacturing Services India -2 0 0 -1 0 0 0 1 0 0 2 0 0 2000 2002 2004 2006 2008 2010 year Primary Manufacturing Services Russia -1 0 0 -5 0 0 50 1 0 0 1 5 0 2000 2002 2004 2006 2008 2010 year Primary Manufacturing Services Brazil
Figure 4. International specialisation of the EU and its competitors (CEPII index) – Within service sub-categories specialisation
Source: Authors calculations using CHELEM data (CEPII). -5 0 5 10 15 2000 2002 2004 2006 2008 2010 year Transport Travel Other Services EU27 0 10 20 30 40 50 2000 2002 2004 2006 2008 2010 year Transport Travel Other Services United States -3 0 -2 0 -1 0 0 2000 2002 2004 2006 2008 2010 year Transport Travel Other Services Japan -1 5 -1 0 -5 0 2000 2002 2004 2006 2008 2010 year Transport Travel Other Services China -5 0 0 50 1 0 0 2000 2002 2004 2006 2008 2010 year Transport Travel Other Services India -6 0 -4 0 -2 0 0 2000 2002 2004 2006 2008 2010 year Transport Travel Other Services Russia -4 0 -3 0 -2 0 -1 0 0 2000 2002 2004 2006 2008 2010 year Transport Travel Other Services Brazil
3.2. EU specialisation by sector, technological level and market segment
In this section we investigate the composition of trade in goods in the EU and its main partners, at a high level of product disaggregation. This analysis is guided by the hypothesis that the EU, as a developed and high income economy, should have and advantage in exporting high value added goods. This should be reflected in good performance for high-tech and top range products. Here, top range products refer to high-priced goods: exporters manage to sell their products in foreign markets despite their high price, which points to the presence of non-price attributes such as brand, high perceived quality, efficient after-sales service, and variety of differentiated products in the same product category.8 It is in this market segment that European exporters perform best. High tech products are defined not by their price, but by their technological content.
First, we consider the breakdown of European exports across main economic sectors using the NACE Rev.1 classification of economic activities detailed in Appendix A.3, and their correspondence with the HS 6-digit classification of traded goods.
EU exports are largely concentrated in four sectors: chemicals, machinery, electrical & optical equipment, and transport equipment.9 The sectoral composition of EU exports has been relatively stable over the 2000-2010 decade with a few notable changes, most of which occurred before the financial crisis in 2008. The exception is chemical products whose share in EU exports increased more rapidly during the crisis (+1.4 p.p.).
We next consider products differentiated according their technological content, using the OECD-Eurostat classification (see Appendix A.3). We distinguish four broad categories of products embedding: high-level production technologies (HT), middle-high technologies (MHT), middle-low technologies (MLT), and low technologies (LT). Since the classification proposed by OECD-Eurostat does not cover all the products traded by countries, we include an additional category for non-classified products.10
8
As detailed below, we split the distribution of world prices for each product into three equal-sized market segments and consider the upper market segment where prices are highest.
9
The sectoral breakdown of EU trade is more uneven on the import side. 40% of European imports consist of mining & quarrying, and electrical & optical equipment.
10
Examples of non-classified products according to the technological content are: live animals, fresh and chilled fish, coal, crude oil, electrical energy. These are mainly primary products categorized as low-tech by alternative classifications (e.g. Lall, 2000).
Figure 5. The composition of EU’ extra-EU exports by main economic sectors (NACE Rev.1)
Note: Results are reported for economic sectors of the NACE Rev.1 classification (see Appendix A.3) for which positive trade flows are observed. Intra-EU trade flows are excluded from computations.
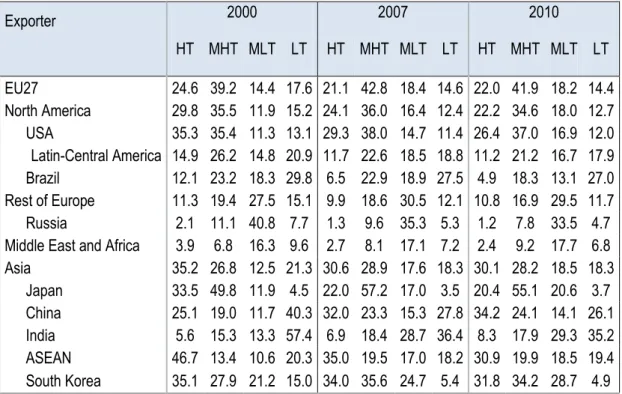
Figure 5 presents the share of exports in each of these five categories for the EU and its main trading partners. As expected for a developed economy, Europe exports mainly high-tech and middle-high high-tech products. These two categories account for two-thirds of Europe’s exports. During the 2000s there was however a slight shift in EU exports towards lower-tech products. Between 2000 and 2007 the share of high-tech exports decreased by 3.5 p.p., while the share of medium-high and medium-low technology exports increased by 3.6 p.p. and 4 p.p., respectively. This evolution was halted during the crisis years (2008-2010) or even reversed for high-tech products (reduction of 3.5 p.p. before 2007 vs. increase of 0.9 p.p. after 2007). At the same time, the share of low-tech exports shrank from 17.6% to 14.4%, although the reduction in the share of non-classified goods (mostly categorised as low-tech under alternative classifications) suggests that this change might have been more pronounced.
In 2000 high-tech products represented more than a third of US and Japanese exports and almost half of exports from ASEAN. By 2010 these shares had dropped by respectively 9, 13, and 16 p.p., pointing to a huge shift in comparative advantage from traditional high-income exporters of high tech goods towards emerging economies benefiting from low wages and increasing technology levels. Note that the technological level of exports from China and India increased. Brazil and Russia, however, suffered a decrease. In 2000 low-tech products accounted for 40% of Chinese exports and 57% of Indian exports.
0 5 10 15 20
Other Community, Social and Personal Services Renting of M&Eq and Other Business Activities Electricity, Gas and Water Supply Manufacturing, Nec; Recycling Transport Equipment Electrical and Optical Equipment Machinery, Nec Basic Metals and Fabricated Metal Products Other Non-Metallic Mineral Products Rubber and Plastics Chemicals and Chemical Products Coke, Refined Petroleum and Nuclear Fuel Pulp, Paper, Paper , Printing and Publishing Wood and Products of Wood and Cork Leather, Leather and Footwear Textiles and Textile Products Food, Beverages and Tobacco Mining and Quarrying Agriculture, Hunting, Forestry and Fishing
The structure of EU27's exports by sector (%)
Consumer products are not “made in” only one country. To some extent, and to borrow from a recent WTO initiative, they are “made in the world”. Different countries contribute to the production of the same good, depending on their individual specialisation in a segment of the value chain. This microeconomic evidence is out of line with how trade statistics traditionally are collected: trade statistics refer to gross trade. The consequences have been profound in China due to its increased participation in the GVC of high-tech sectors. With 25% of world’s exports and 11% of world’s imports in 2010 China remains a net exporter of high-tech products. While the share of high-tech products in Chinese exports increased 9 p.p., between 2000 and 2010, their contribution to China’s imports has been constant (around 24-25%). This discrepancy between in the structure of Chinese exports and imports points to an increased share of domestic value added in Chinese exports of high-tech goods. Thus, 35% of products exported by China in 2010 are high-tech, and only 26% are low-tech products. In the case of Indian exports, the shift has been mainly from low-tech (-22 p.p.) to medium-low tech (+16 p.p.) products. To what extent this shift in comparative advantage is an illusion is investigated below using the WIOD database on trade in value-added.
In addition to the major shift in comparative advantage for high-tech goods, the race for primary products has had a huge impact on primary resources exporters. Brazil and Russia increased their exports of primary products by 20 p.p. and 14 p.p. respectively to the detriment of exports in all other product categories. In both countries this evolution took place mostly after the financial crisis in 2007. Although extraction of primary products may require use of mid-tech or high-tech equipment, they are subject to little technological transformation. Therefore, it is reasonable to associate an increased specialisation in these products to an overall downgrading in the technological content of a country’s exports.
Table 3. Decomposition of exports by technological content (shares in %) Exporter 2000 2007 2010 HT MHT MLT LT HT MHT MLT LT HT MHT MLT LT EU27 24.6 39.2 14.4 17.6 21.1 42.8 18.4 14.6 22.0 41.9 18.2 14.4 North America 29.8 35.5 11.9 15.2 24.1 36.0 16.4 12.4 22.2 34.6 18.0 12.7 USA 35.3 35.4 11.3 13.1 29.3 38.0 14.7 11.4 26.4 37.0 16.9 12.0 Latin-Central America 14.9 26.2 14.8 20.9 11.7 22.6 18.5 18.8 11.2 21.2 16.7 17.9 Brazil 12.1 23.2 18.3 29.8 6.5 22.9 18.9 27.5 4.9 18.3 13.1 27.0 Rest of Europe 11.3 19.4 27.5 15.1 9.9 18.6 30.5 12.1 10.8 16.9 29.5 11.7 Russia 2.1 11.1 40.8 7.7 1.3 9.6 35.3 5.3 1.2 7.8 33.5 4.7 Middle East and Africa 3.9 6.8 16.3 9.6 2.7 8.1 17.1 7.2 2.4 9.2 17.7 6.8 Asia 35.2 26.8 12.5 21.3 30.6 28.9 17.6 18.3 30.1 28.2 18.5 18.3 Japan 33.5 49.8 11.9 4.5 22.0 57.2 17.0 3.5 20.4 55.1 20.6 3.7 China 25.1 19.0 11.7 40.3 32.0 23.3 15.3 27.8 34.2 24.1 14.1 26.1 India 5.6 15.3 13.3 57.4 6.9 18.4 28.7 36.4 8.3 17.9 29.3 35.2 ASEAN 46.7 13.4 10.6 20.3 35.0 19.5 17.0 18.2 30.9 19.9 18.5 19.4 South Korea 35.1 27.9 21.2 15.0 34.0 35.6 24.7 5.4 31.8 34.2 28.7 4.9 Notes: Authors’ calculations using BACI data. NT -high-tech products, MHT - medium-high tech products, MLT - medium-low tech products, LT - low-tech products. Non-classified products (according
to their technology content) are not shown here.
Another important feature of observed trade flows is the market positioning of a country’s exports. Emerging economies have diversified and now export most of the products exported by high income countries. However, this does not mean that the two groups of countries compete head-on, since the market positioning of their exports is different (Fontagné et al., 2008). Many products may be classified under a given heading of customs nomenclatures, but their price and market segments are different. In absence of observed prices, the unit values of the products exchanged between countries can be generally computed and used as to indicate market positioning. Unit values are obtained by dividing the value of a trade flow in monetary terms, by its value in physical terms (quantity). It should be emphasised that market positioning provides a more general indicator than quality. Unit values also reflect costs and market segmentation (Hallak & Schott 2011). There are several features that lead to higher prices, such as preferences for certain “made in” labels, market power of large firms, and other market imperfections. Crucial to this analysis is that consumers agree to pay a higher price for a given variety of the same category of good, exported by a certain country. Unlike price data, which vary across contracts, unit value is unique to each individual trade flow (a product k exported by country i to country j in year t). We divide each product’s world trade into three broad groups (market segments) according to the unit value of individual trade flows: high, middle and low unit-value/market positioning. This procedure relies on the distribution of product-level unit values as developed in Fontagné et al. (2008).
Table 3 summarises the composition of exports by product unit-value/market segment for the EU and its main partners, which is a different categorization than the technological level of product. In 2000 European exports were distributed almost equally across the three market
segments, with 35% in the top market segment. In the decade to 2010, Europe has increased its specialisation in top-range products (which reached 40% of exports by 2010), and reduced specialisation in low-value products. The US, Japan, and the ASEAN countries have also upgraded their products, but have not achieved EU performance. These countries rely considerably more on mid-value products, which account for 41%-43% of their exports. China and South Korea have maintained their specialisation in bottom-range products. Russia and the Middle East and African countries have seen spectacular structural shifts during the financial crisis in the late 2000s.
Table 4. Decomposition of exports by products’ unit-values (UV), shares in %
Country 2000 2007 2010
Low
UV Mid UV High UV Low UV UV Mid High UV Low UV Mid UV High UV EU27 29.7 34.4 35.1 23.8 33.2 42.4 24.7 34.4 40.2 North America 32.1 42.9 23.2 27.0 44.4 24.2 25.1 46.8 25.8 USA 32.8 39.9 25.9 27.0 40.6 28.0 25.7 43.3 28.5 Latin-Central America 42.1 40.7 16.2 39.5 42.5 17.2 32.1 52.5 14.9 Brazil 39.9 41.1 18.8 41.4 44.6 13.9 31.7 53.6 14.6 Rest of Europe 41.8 38.5 17.0 41.6 33.5 24.0 28.0 43.8 27.2 Russia 50.3 34.3 11.6 55.6 34.0 9.9 28.0 51.8 19.8 Middle East and Africa 34.3 44.3 10.6 53.8 27.5 16.2 25.0 59.4 13.7 Asia 36.1 39.8 21.2 37.2 37.0 20.6 36.5 39.7 21.3 Japan 22.4 43.8 32.0 22.6 43.2 30.1 20.7 42.2 34.6 China 44.3 39.9 15.2 48.5 34.9 14.7 46.5 39.1 13.3 India 41.3 30.1 15.8 36.1 41.8 21.6 33.9 37.1 15.3 ASEAN 37.7 40.0 19.1 31.7 36.9 23.1 29.9 41.1 27.5 South Korea 41.1 37.8 20.3 39.3 37.0 23.5 41.7 39.7 18.4
Notes: Authors’ calculations using BACI data. Non-classified products (according to the distribution of unit values) are not shown here.
We should stress that prices reflect production costs (Khandelwal 2010), potentially flawing this measure. Our measure is based on observed trade flows and points to the fact that different producers are exporting the same category of good, in the same year, to the same market, but at very different prices. Since we observe different flows, these products must be (vertically) differentiated. Otherwise, in the presence of a homogenous good, only the cheapest exporter would be observed in the data or the market share of the expensive exporter should shrink. If a country's exports are in the high-price range, but product attributes do not justify this pricing, its market share will shrink. Hallak (2006) defines product quality as a demand shifter that captures all the attributes of a product valued by consumers, and finds that cross-country variation in unit values can be attributed to differences in quality so-defined. In light of this finding, the figures in Table 4 can be considered proxies for quality. Next we analyse the international specialisation of the EU across products by focusing on comparative advantages and disadvantages. Figure 6 displays the EU’s RCA computed at sector level according to the NACE Rev.1 and using the CEPII index. It offers a more detailed insight into the evolution of EU specialisation in manufactured and primary goods, analysed in section 3.3.1. Figure 6 shows that the EU has strong comparative advantage in
machinery (46.3), transport equipment (42.6), and chemical products (41.2). Europe’s main comparative disadvantage is mining and quarrying (-94.1), and electrical and optical equipment (-21.9) and textiles (-20.6). Despite the financial crisis, its advantage in these sectors increased. The recent financial crisis contributed to deterioration in Europe’s position for these sectors (except transport equipment and chemicals). Combining the results in Figures 5 and 6, we can conclude that the EU is exporting products in which it has net comparative advantage relative to other countries. Thus, despite its strong disadvantage in electrical and optical equipment, this is one of the EU’s leading export sectors (Figure 5).
Figure 6. The CEPII measure of RCA for EU, excluding intra-EU flows
Note: Sectors are defined according to the NACE Rev.1 classification. Computations are using the CEPII index and excluding intra-EU27 flows. RCA are expressed in ‰ of extra-EU27 total trade. Sorted by results in 2010. Positive values denote net exports, negative values denote net imports.
Another second RCA indicator, initially proposed by Balassa, computes countries’ specialisation by comparing the share of a given industry in the country’s total exports, with the same share for a benchmark country or reference group. Here we consider the rest of the world as the reference group:
i k k i i k i k k i k i k i X X X X Balassa RCA _where X denotes either gross exports or the domestic content of exports (used to compute the RCA index), k is the sector and i is the country of interest. We use detailed bilateral trade data from the BACI dataset to compute this index. Results for the EU are shown in Figure 7. While the CEPII RCA uses both export and import data and takes account of intra-industry
-100 -75 -50 -25 0 25 50
Mining and Quarrying Electrical and Optical Equipment Textiles and Textile Products Agriculture, Hunting, Forestry and Fishing Leather, Leather and Footwear Manufacturing, Nec; Recycling Coke, Refined Petroleum and Nuclear Fuel Electricity, Gas and Water Supply Other Community, Social and Personal Services Renting of M&Eq and Other Business Activities Basic Metals and Fabricated Metal Products Wood and Products of Wood and Cork Rubber and Plastics Other Non-Metallic Mineral Products Pulp, Paper, Paper , Printing and Publishing Food, Beverages and Tobacco Chemicals and Chemical Products Transport Equipment Machinery, Nec
Revealed comparative advantages for EU27, by sector
trade, the Balassa indicator of comparative advantage relies on export data only. The CEPII RCA indicator adjusts for the size of each sector, but unlike the Balassa indicator, makes no reference to the structure of trade at the global level. The value range of the two indicators is also different. The CEPII RCA measure is expressed as a percentage (here per thouthands for sake of presentation) of the country’s total trade and can take positive and negative values. The Balassa RCA measures the structure of a country’s exports relative to the structure of world trade and, therefore, can take only positive values. A value close to 1 means that the contribution of the considered sector to the country’s overall exports is very close to its share in global demand. A Balassa RCA indicator larger (lower) than 1 points to the country’s specialisation in (disengagement from) specific products. This indicator ignores the fact that a leading export sector may also rely heavily on imported parts and components, which downgrades the country’s performance in that sector. Thus, the strong EU comparative advantage in pulp and paper products and other non-metallic minerals (Figure 7) is considerably weakened if we control for intra-industry trade (Figure 6). Nevertheless, the overall ranking of sectors according to the RCA computed by the two methods is quite similar.
Figure 7. The Balassa measure of RCA for EU, excluding intra-EU flows
Note: Sectors are defined according to the NACE Rev.1 classification. Computations using the Balassa index and excluding intra-EU27 flows. Sorted by results in 2010. Positive values denote net
exports, while negative values denote net imports.
0 0.25 0.5 0.75 1 1.25 1.5 1.75 2
Mining and Quarrying Textiles and Textile Products Agriculture, Hunting, Forestry and Fishing Other Community, Social and Personal Services Electrical and Optical Equipment Renting of M&Eq and Other Business Activities Manufacturing, Nec; Recycling Coke, Refined Petroleum and Nuclear Fuel Leather, Leather and Footwear Basic Metals and Fabricated Metal Products Rubber and Plastics Food, Beverages and Tobacco Wood and Products of Wood and Cork Other Non-Metallic Mineral Products Pulp, Paper, Paper , Printing and Publishing Transport Equipment Chemicals and Chemical Products Machinery, Nec Electricity, Gas and Water Supply
Revealed comparative advantages for EU27, by sector
3.3. EU specialisation and global value chains
The proliferation of GVC in recent years has changed the landscape of global trade significantly, particularly in sectors such as transport equipment and electronic products. This increasing importance in global production linkages suggests we should re-examine traditional trade statistics based on gross value of trade. The value added content in exports should be split according to the location of production: not all intermediate products (or even intermediate services) are produced domestically. In what follows we obtain two important results. First, there is intra-European fragmentation of production processes. Most products exported by the EU are truly made in Europe. Second, services are indirectly exported through trade in goods.
A first glance at the positioning of exporters along the value added chain is provided by the classification of products traded according to their level of transformation. This is achieved here using the Broad Economic Categories (BEC) classification.11 According to this classification, trade in final products represents two-thirds of global trade. Indeed, descriptive evidence on GVC can be obtained only by considering Tables 5 and 6 together.
Tables 5 and 6 show the breakdown of exports and imports, for individual traders, into final and intermediary products. A country heavily engaged in GVC will import more intermediate products (hence a larger share of these products in its total imports) and export a disproportionate share of final products. With 78% of exports and 63% of imports, the EU is exporting (relatively) more final products than the US (69%), Japan (68%) or ASEAN (63%). On the other hand, the EU is importing (relatively) more intermediate products than the US, pointing to the role of value chains for European producers.
However, this is indeed in Asia that the presence of GVC is captured by this data, pointing to the role of the so-called ‘Factory Asia’, with China leading this group in terms of share of intermediate products in imports (50%).
11
The correspondence between each BEC product category and product usage (final/intermediate) is shown in the Appendix, Table A.4.
Table 5. Decomposition of exports by product usage (shares in %)
Exporter 2000 2007 2010
Final Intermediate Final Intermediate Final Intermediate
EU27 76.0 24.0 78.2 21.8 77.8 22.2 North America 64.4 35.6 66.6 33.4 66.9 33.1 USA 63.0 37.0 67.6 32.4 68.7 31.3 Latin-Central America 62.2 37.8 60.5 39.5 57.1 42.9 Brazil 72.6 27.4 67.1 32.9 56.2 43.8 Rest of Europe 64.7 35.3 64.5 35.5 63.2 36.8 Russia 56.9 43.1 48.4 51.6 46.0 54.0
Middle East and Africa 34.8 65.2 34.7 65.3 36.5 63.5
Asia 69.0 31.0 70.7 29.3 70.5 29.5 Japan 66.6 33.4 69.5 30.5 68.4 31.6 China 82.3 17.7 80.3 19.7 78.7 21.3 India 82.4 17.6 82.1 17.9 83.3 16.7 ASEAN 59.5 40.5 61.4 38.6 63.0 37.0 South Korea 75.1 24.9 71.2 28.8 70.9 29.1
Source: Authors’ calculations using BACI data.
Table 6. Decomposition of imports by product usage (shares in %)
Country
2000 2007 2010
Final Intermediate Final Intermediate Final Intermediate
EU27 61.1 38.9 63.8 36.2 62.6 37.4 North America 67.8 32.2 68.3 31.7 68.3 31.7 USA 68.8 31.2 68.2 31.8 67.8 32.2 Latin-Central America 69.3 30.7 73.5 26.5 73.0 27.0 Brazil 62.2 37.8 64.1 35.9 68.6 31.4 Rest of Europe 78.4 21.6 79.7 20.3 78.6 21.4 Russia 78.5 21.5 84.3 15.7 79.9 20.1
Middle East and Africa 74.0 26.0 78.0 22.0 78.3 21.7
Asia 59.8 40.2 56.5 43.5 56.3 43.7 Japan 62.7 37.3 57.6 42.4 59.2 40.8 China 62.6 37.4 51.9 48.1 50.3 49.7 India 54.2 45.8 55.9 44.1 56.7 43.3 ASEAN 53.8 46.2 58.2 41.8 61.8 38.2 South Korea 56.4 43.6 56.9 43.1 56.4 43.6
Source: Authors’ calculations using BACI data.
As already mentioned, to account for the effects of GVC and global production linkages we need indicators for domestic and foreign value added content of exports derived from international input-output tables. This allows country and industry-specific usage of intermediates by partner countries and industries to be tracked, as well as deliveries of specific industry intermediates from a specific country to other industries and countries and to final users. Combining data on value added created in each sector disentangles the
foreign value added content of a country’s exports that enter the product via imports of intermediates. This value added content in a country’s exports in gross terms can be split further into the contribution of individual sectors (e.g. services) and partners. This section reports some important developments in EU manufacturing and services exports in value added terms over the period 1995-2011, using the WIOD. The WIOD combines information from national suppliers and use detailed trade data to construct global input-output tables. The database covers 41 countries and about 85% of world trade for the period 1995-2011. For a more detailed description see Appendix A.2.
3.3.1. Vertical specialisation of the EU
A first important question from a value added trade perspective is to what extent a country’s exports embody domestically created value added and to what extent exports are used as intermediates from other countries and, therefore, embody value added created in foreign economies. Specifically, the concern is how much of the extra-EU manufacturing exports embody value added created in the EU referred to as the ‘domestic content of exports’ and how this has changed over time, given the tendency of increasing international fragmentation of production and the rise of emerging countries such as China and India. To examine this we use a widely used indicator, domestic and foreign value added content of trade, which is similar to Hummels, Ishii and Yi’s (2001) measure of vertical specialisation (the ‘import content of exports’), but refers to value added. 12
As argued above, a country’s exports embody both value added created in the domestic economy and value added originally created in a foreign economy which is imported via intermediate inputs; an important example is raw materials or parts and components imported from other regions in the world. It has been argued that this type of trade in intermediates has increased in recent decades and national domestic shares in national exports have decreased. Figure 8 presents the share of domestically produced value added in a country’s exports for the EU (including only extra EU exports) compared to the US, Japan and China. National exports include both intermediate and final goods exports since the interest is in the domestic value added content of these exports irrespective of whether they are used for final consumption or further production in the other countries (see Koopman, Wang and Wei (2013) for a further decomposition in this respect). In this figure exports are further split into manufacturing and services since the former might have different international sourcing structures.
12
Figure 8. Share of domestic value added in gross exports for selected countries, in %
Note: Manufacturing comprises sectors NACE Rev. 1 15 to 37; Services include NACE Rev. 1 50 to 95.
Source: WIOD data; wiiw calculations
We consider total exports first. The share of domestically produced value added in the EU in 1995 was at the level of 92% and decreased to 85.3% in 2011. Thus, although most EU exports are “Made in Europe”, this has decreased by about 8 p.p. due to increasing international fragmentation of production. The trends are similar in other countries.13 In the US, the domestic share declined from 90% to 85.1% whereas the decline in Japan was even stronger from almost 94% to 83%. China started at a somewhat lower level of 84.2% which declined to 78.2% in 2011. As manufacturing constitutes the bulk of these exports these patterns do not change much if we consider only manufacturing (defined as NACE Rev. 1 15 to NACE Rev. 1 37). However, if we focus on services exports (NACE Rev. 1 50 to NACE Rev. 1 95) then domestic shares are slightly larger. For the EU, the domestic share in services exports declined from 95% to 91% which is by about 2 p.p. lower than the US, but similar to the figures for Japan. China has a smaller domestic value added content in services compared to the advanced economies (88% in 2011).
Finally, the decline in the domestic shares in services exports is smaller than for manufacturing exports, evidence that services are less tradable, and international production fragmentation is relatively more pronounced in the manufacturing and transport sectors as shown below. The arguments related to country level apply to individual sectors. What is argued at the level of countries can of course be argued at the level of individual industries. Figure 9 shows the domestic shares in exports (both intermediate and final goods) by sector for the EU.14 With the exception of coke, refined petroleum and nuclear fuel, the manufacturing sectors show quite high shares of domestic value added in their exports. Again, the trend is decreasing across all industries, which is in line with increased
13
Results for all countries included in the WIOD database and years 1995, 2000, 2007, and 2011 are presented in Appendix Table A.19.
14
international fragmentation. During 1995 and 2011, the share in most sectors fell by 5-9 p.p. and in fuel by 15 p.p., which reflects fuel price changes.
Figure 9. Share of domestic value added in EU27 manufacturing gross exports by sector, in %
Figure 10. Share of domestic value added in EU27 commercial services gross exports by sector, in %
Source: WIOD data; wiiw calculations.
Figure 10 provides the same information for commercial services. As already indicated, the domestic content embodied in services is generally larger than in manufacturing, and this holds for most individual services sectors. The pattern for water and air transport differs, with lower domestic content around 90% in 1995 and 80% in 2011. However, the general trend is again that the domestic value added content of services exports was declining over the period considered. Note also that the corresponding increase in foreign value added content in exports of services might be due to the manufacturing inputs, which are characterised by increased foreign sourcing (as described above) and inter-industry linkages.
Next we study in more detail the extent to which individual industries have been affected by the ongoing fragmentation of production. Figure 11 presents the changes in domestic value added shares in EU exports by industry, which allows comparison between manufacturing and services. In line with the information presented in Figures 9 and 10 above, the manufacturing industries with the greatest increase in international fragmentation of production apart from coke and refined petroleum, are chemicals and chemical products, electrical and optical equipment, basic metals, and transport equipment. It is interesting that these are mostly high tech or medium-high tech industries where trade in parts and components is important or which rely on foreign inputs in the form of raw materials. With respect to services, the industries showing the biggest reductions in domestic content are air
and water transport and electricity, gas and water supply, probably driven by price movements for inputs such as energy and oil.
Finally, we investigate whether the observed patterns and changes are common to or different across countries. This can be inferred from the detailed information provided in OLA Table A.20. Here we highlight four sectors that show interesting patterns (Figure 12).
The selected sectors are textiles and textile products where we find increasing domestic content in exports from China indicating that this country will likely take on more and more intermediate production stages of this industry. Next is electrical and optical equipment where increased domestic content in US exports contrasts with rapidly declining share in all other countries, particularly the EU. The relatively low domestic shares for China are in line with the role of China as an assembler of electrical products. In transport equipment the EU and Japan show relatively large though declining (especially in the EU) domestic content. In this case the domestic share is much lower and declining much faster. Finally, for renting and other business activities figures for China show much lower (though slightly rising) domestic content compared to the more advanced countries where domestic content is still above 95% although showing a slight (1-2 p.p.) decline.
Figure 11.Change in domestic value added content of EU exports by sector, in p.p., 1995-2011