HAL Id: hal-01322828
https://hal.archives-ouvertes.fr/hal-01322828
Submitted on 30 May 2016
HAL is a multi-disciplinary open access
archive for the deposit and dissemination of
sci-entific research documents, whether they are
pub-lished or not. The documents may come from
teaching and research institutions in France or
abroad, or from public or private research centers.
L’archive ouverte pluridisciplinaire HAL, est
destinée au dépôt et à la diffusion de documents
scientifiques de niveau recherche, publiés ou non,
émanant des établissements d’enseignement et de
recherche français ou étrangers, des laboratoires
publics ou privés.
Distributed under a Creative Commons Attribution - NonCommercial - NoDerivatives| 4.0
International License
Modelling Chemical Vapour Infiltration in C/C
composites: numerical tools based on µ-CT images
Gerard Vignoles, Olivia Coindreau, William Ros, Ivan Szelengowicz,
Christianne Mulat, Christian Germain, Marc Donias
To cite this version:
Gerard Vignoles, Olivia Coindreau, William Ros, Ivan Szelengowicz, Christianne Mulat, et al..
Mod-elling Chemical Vapour Infiltration in C/C composites: numerical tools based on µ-CT images.
HT-CMC 7 – 7th International Conference On High-Temperature Ceramic-Matrix Composites, W.
Krenkel; J. Lamon, Sep 2010, Bayreuth, Germany. pp.598-606. �hal-01322828�
“Modelling Chemical Vapour Infiltration in C/C
composites : numerical tools based on µ-CT images”
,
G. L. VIGNOLES, O. COINDREAU, W. ROS, I. SZELENGOWICZ,
C. MULAT, C. GERMAIN, M. DONIAS,
pp. 598-606
in
“Proceedings of HT-CMC 7 –
7
thIntl. Conf. On High-Temperature Ceramic-Matrix Composites »,
Bayreuth, Germany, September 20-22, 2010
W. Krenkel & J. Lamon eds. (2010)
AVISO Verlagsgesellschaft mbH, Berlin
Modelling Chemical Vapour Infiltration in C/C
composites: numerical tools based on µ-CT images
G. L. Vignoles1, O. Coindreau1, W. Ros1,2, I. Szelengowicz1, C. Mulat1,2, C. Germain2, M. Donias2
1Univ. Bordeaux 1, LCTS, Pessac, F33600, France 2Univ. Bordeaux, IMS, Talence, F33405 Cedex, France
Keywords: C/C composites, Chemical Vapour Infiltration, modelling.
Introduction
The matrix of Ceramic Matrix Composites (CMCs)[1] and Carbon-Fibre Reinforced Carbons (CFRCs)[2] is often deposited by Chemical Vapour Infiltration (CVI). This process gives the best matrix quality, but it is expen-sive and difficult to control. Experimental determination of the optimal condi-tions is time-consuming and expensive. That is why modelling of CVI is of great interest to optimize the final density and homogeneity of the compo-sites [3-5]. The keys of a CVI model are: (i) the determination of geometrical characteristics and transport properties of the preform at various stages of infiltration [6], namely: the effective gas diffusivity, either in continuum or in rarefied regime, the gas permeability to viscous flow in the case of pressure-driven CVI [7], and the heat conductivity, in the case of thermal-gradient modifications of CVI [8], (ii) the knowledge of chemical reaction rates, and (iii) the simulation of the infiltration itself.
This paper presents a 3D image-based modelling approach for isother-mal, isobaric CVI (also known as I-CVI). The architecture of the reinforce-ment, in which fibres are frequently grouped into bundles or tows, requires that the study pay attention to at least two length scales: inter-bundle and intra-bundle. Numerous past works have treated I-CVI modelling at both scales [9]; the specificity of the work presented here is the ability to account for precise geometric details of the preform structure, as obtained from high-resolution X-ray tomographic imaging (µ-CT) or equivalent methods, and to deal with two different scales inside the material with two distinct random-walk techniques. We will describe here the procedures (tomography, numer-ical techniques) and discuss some results of the simulations.
Materials and experimental procedure
Details on the experimental procedure have been given in [10,11]. The samples were raw (73% porosity) and partly infiltrated (50% porosity, 23%
porosity) C fibre preforms made of stacked satin weaves held together by stitching; they have been scanned with a 0.7 µm voxel edge size resolution, using the setup of the ESRF ID 19 beam line. Lower resolution scans (7.46 µm/voxel) were also made on the same samples, in order to connect with a maximal confidence the fibre-scale and a larger scale, the Representative Elementary Volume (REV) scale. Figure 1a) displays a lower resolution im-age of the whole sample, the upper part of which has been scanned with higher resolution (Fig. 1b).
a)
b)
Figure 1. 3D renderings of µ-CT scans of a partly infiltrated C/C sample
shaped for CT acquisition at 2 distinct resolutions. a) Low-resolution scan. b) High-resolution image, after segmentation from an edge-detection mode scan.
Fibre-scale algorithm
CVI model equations are distinct according to the considered character-istic length. The present part is intended to recall them briefly, according to the following hypotheses: (i) isothermal process, (ii) steady-state situation for the gas, and (iii) a single precursor gas species is followed, with one linear heterogeneous reaction, and possibly one homogeneous reaction.
At fibre scale, CVI is like CVD on a somewhat complex substrate: the solid grows by heterogeneous reaction with the gas. So, one expects to have a simulation domain comprising a gas phase and a solid phase, with mass transfer in the gas, plus a deposition reaction and the growth of the solid phase.
In this work, the fibre-scale infiltration simulation is based on a simplified representation of gas kinetics in a gas/solid binarized medium (Figure 2a). The discretization of the gas/solid interface follows a Simplified Marching Cube scheme [12,13], which is a compromise between the accuracy of the Marching Cube and computational resource savings.
An important point is that the rarefaction degree of the gas (measured by the Knudsen number) is often far from being negligible, and one has to ac-count for free-molecule flow. In this case, one has to solve the Maxwell-Boltzmann equations for the molecular position and velocity distribution [14,15]. Monte-Carlo Random-Walk algorithms are particularly adequate for a fast solution of these equations. The random walk scheme used here is inspired from Burganos & Sotirchos [16], allowing for rarefied regime, transi-tion regime and ordinary diffusion. It simulates the trajectories of molecules according to the gas-kinetic theory.
The heterogeneous reaction is described by sticking events with a stick-ing probability Pc which depends on the diffusion/reaction rate ratio. When
this number becomes appreciable with respect to unity, bulk gas transfer begins to limit the effective process intensity. In this case, some gradients of gas concentration are expected to occur; as a consequence, infiltration be-gins to be non-uniform.
The simulation of the surface alteration is carried out by a discrete VOF technique, in which the amount of deposited solid is stored in the non-solid node closest to each sticking event position; when this amount exceeds a threshold, the node is converted to solid and the local interface is modified on-the-fly. A percolation test is performed regularly and the closed porosity is eliminated. The surface evolution scheme has been validated against analyt-ical solutions in the case of composite materials ablation [17], and in the slit-pore geometries for deposition simulations [18,19].
The evolution laws for the effective diffusion and reaction coefficients as infiltration proceeds are taken as inputs for the large-scale model, which is described next.
Large-scale algorithm
Averaging over a large volume of fibrous preform (i.e. a large number of fibres) gives effective laws of a distinct nature. Indeed, it is not any more possible to consider a binarized gas/solid domain, but rather a porous medi-um with average geometrical quantities, such as the pore volmedi-ume fraction and internal surface area. Also, gas transfer obeys usual diffusion laws with an effective diffusivity, possibly tensorial, which contains a contribution of the resistance offered by the solid phase and depends on the Knudsen number. Another point is that the gas consumption becomes apparently
homogene-ous, the magnitude of the source term depending on the local value of the internal surface area.
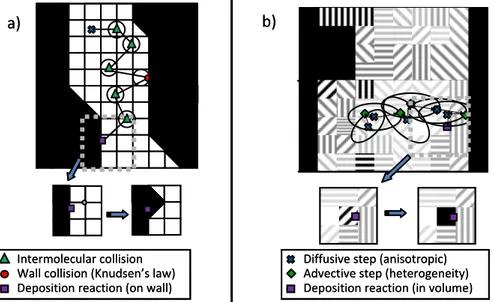
Intermolecular collision Wall collision (Knudsen’s law)
a)
Deposition reaction (on wall)
b)
Diffusive step (anisotropic) Advective step (heterogeneity) Deposition reaction (in volume) Intermolecular collision
Wall collision (Knudsen’s law)
a)
Deposition reaction (on wall)
b)
Diffusive step (anisotropic) Advective step (heterogeneity) Deposition reaction (in volume)
Figure 2. Comparative sketch of the two random-walk algorithms. a)
Gas-kinetic random walk interacting with pore walls; b) Brownian motion in a het-erogeneous, anisotropic continuum.
The large-scale computer code is based on a distinct random-walk method (Figure 2b). Here, sharp gas/solid interfaces are not usual; instead, every voxel contains a certain fibre density which can be associated to a given diffusivity tensor. A preliminary processing step of the program is to determine the direction of the fibres by image processing, namely, finding the eigenvectors and eigenvalues of the structure tensor, i.e. the Hessian of the image [20]. The applied filter was based on a gradient mask optimized with respect to cylinder detection [21]. Then, every voxel is associated to a full local diffusivity tensor, the amplitude of which is given by the greyscale level and the principal directions of which are given by the detected fibre orientation.
For the resolution of the large-scale transport problem, it has been cho-sen to implement a particle solver, through an Itō-Taylor random walk nu-merical scheme, totally distinct from the fibre-scale gas-kinetics solver. The solver is inspired from advection-dispersion solvers [22]; it allows accounting for the local anisotropy of the medium in each voxel by biasing the orienta-tion distribuorienta-tion according to the local fibre orientaorienta-tion. The code also ac-counts for local heterogeneities of the diffusion tensor by adding to the
diffu-sive step an advective step in which the drift is computed from the image gradient.
The program has been validated against various cases in which analyti-cal solutions are available: homogeneous diffusion tensor aligned with the image axes or off-axis, linear gradient of the diffusivity; image with a discon-tinuity of the diffusion coefficient. All results were excellent with a moderate number of walkers (approximately 800).
In addition to transport, the program has to simulate deposition inside the fibre bundles. This is achieved by the computation of a survival probabil-ity at each time step, related to the local internal area value and to the heter-ogeneous reaction constant. A random number is sampled from a uniform distribution in [0;1]. If it exceeds the survival probability, then the walker is swallowed, and the local infiltration progress variable is incremented. The program has been validated against a 1D diffusion-reaction case for which the traditional hyperbolic cosine is the solution of the concentration field [19].
The analysis of the large-scale equations brings out a dimensionless number Φ, the Thiele modulus, which will be a measure of the competition between diffusion and reaction inside the porous medium. This number al-lows to evaluate the possibility of concentration gradients throughout the preform, and consequently of density gradients in the final part. It relies on the Knudsen number, the sticking probability, and the fibrous arrangement.
Results and discussion
b)
0 1 2 3 4 5 6 7 0 0.2 0.4 0.6 0.8 1Pore volume fraction (-) Scaled Thiele Modulus (-) X direction Y direction Z direction Analytical
a)
z
y
x
b)
0 1 2 3 4 5 6 7 0 0.2 0.4 0.6 0.8 1Pore volume fraction (-) Scaled Thiele Modulus (-) X direction Y direction Z direction Analytical
a)
z
y
x
Figure 3. a) Rendering of a simulated matrix with parameters Kn = 0.035
and Pc = 0.16. Volume fractions: Fibres: 28%, matrix: 36%. b) Typical evolu-tion of the scaled Thiele modulus.
An example simulation is shown in Figure 3. A 400x400x350 voxels image (0.28×0.28×0.245 mm3) has been infiltrated in continuum regime (Kn
= 0.035), with constant volume source and a sticking probability equal to 0.16. From the rendering of the deposited matrix, it is clearly seen that the thickness is not constant: indeed, fibres lying close to a bundle periphery receive a much larger deposit than in the bundle centre.
The evolution of the composite may be monitored through the evolution of the relative Thiele modulus as the pore volume decreases. This quantity is roughly proportional to the inverse square root of the average pore diameter. It is prone to increase when infiltration proceeds [23], which renders a further infiltration more and more difficult. Figure 3b) displays such an evolution. The increase is firstly linear; then, it accelerates when getting closer to the percolation threshold, which in this case is extremely low.
The results of the small-scale infiltrations have been cast into evolution laws, in the form given by Rikvold & Stell [24] for unidirectional beds of par-tially penetrable random cylinders, for which an excellent agreement has been found [11,25].
Figure 4a displays an example infiltration with a low initial value of the global Thiele modulus (Φ0 = 0.05). The fibre bundles are becoming progres-sively denser while the inter-bundle space (containing some isolated fibres) evolves in a much slower fashion. The final simulated porosity histogram matches satisfactorily the measured one [21], as shown in Fig. 4b.
0 10 20 30 40 50 60 Measured Simulated
Pore volume fraction classes Frequency (%)
b)
a)
1 mm
Figure 4. Example of a large scale infiltration with a low Thiele modulus. a)
Rendering of the structure at four infiltration times. b) Porosity histograms at 20% residual pore volume.
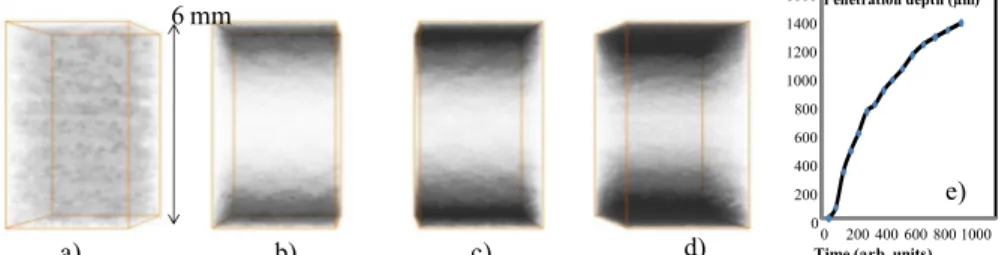
Figure 5 refers to an example infiltration of a larger sample, with faster deposition kinetics; the gas precursor arrives by the top and bottom part of the image. Figures 5b-d illustrates the build-up of the density gradient; a more quantitative account is given on figure 5e, which displays the
progres-sion of the penetration depth with time. This depth is defined as the length at which the deposited matrix thickness is 10% of the surface deposit thick-ness. Obviously, this is a case where the sample will never be correctly infil-trated, since the penetration depth tends to a limiting value not superior than ¼ of the sample height.
6 mm a) b) c) d) 0 200 400 600 800 1000 1200 1400 1600 0 200 400 600 800 1000 Penetration depth (µm)
Time (arb. units)
e)
Figure 5. Example of large scale infiltration with a high Thiele modulus (Φ =
8.5). a) Rendering (in half-transparency) of the initial texture. b-d) Rendering of the deposited matrix at various stages. e) Penetration depth vs. time.
Conclusion
Two numerical tools have been developed for CVI modelling: they are based on distinct random walk methods, adapted to simulating gas dynam-ics and deposition reactions in large, complex 3D images. They have been numerically validated, and examples of application to actual samples scanned by X-ray CMT are shown. More detailed post-processing of the simulation output and application to various materials are the next objectives of the work program. The codes constitute a toolbox for multi-scale model-ling adapted to real composite material architectures; moreover, they can also be used on ideal images and help the materials engineer to design fi-brous arrangements with better infiltration capabilities.
References
[1] W. Krenkel: Ceramic Matrix Composites, published by Wiley-VCH, Weinheim (2008).
[2] E Fitzer and L. Manocha: Carbon reinforcements and carbon/carbon
composites, published by Springer, Berlin (1998).
[3] T. L. Starr, A. W. Smith: MRS Symp. Proc, 1992, 250, 207-214
[4] R. Naslain, F. Langlais, G. L. Vignoles, R. Pailler: Ceram. Eng. Sci. Procs. 2006, 27(2), 373-386.
[6] J. Y. Ofori, S. V. Sotirchos: J. Electrochem. Soc. 1996, 143, 1962-1973. [7] T. L. Starr: J. Mater. Res. 1995, 10, 2360-2366.
[8] G.L. Vignoles, J.-M. Goyhénèche, P. Sébastian, J.-R. Puiggali, J.-F. Lines, J. Lachaud, P. Delhaès, M. Trinquecoste: Chem. Eng. Sci. 2006, 61, 5336-5353.
[9] G. L. Vignoles: Adv. Sci. Technol. 2006, 50, 97-106.
[10] O. Coindreau, P. Cloetens, G. L. Vignoles, Nucl. Instr. and Meth. in Phys. Res. B 2003, 200, 295-314.
[11] O. Coindreau, G. L. Vignoles, J. Mater. Res. 2005, 20, 2328-2339. [12] G. L. Vignoles: J. Phys. IV France 1995, C5, 159-166.
[13] M. Donias, G. L. Vignoles, C. Mulat, C. Germain: submitted to Comput. Mater. Sci. (2010).
[14] G. L. Vignoles, C. Preux, P. Charrier, B. Dubroca, Transp. In Porous Med. 2008, 73, 211-232.
[15] G. L. Vignoles, C. Preux, P. Charrier, B. Dubroca, Transp. In Porous Med. 2008, 75, 295-317.
[16] N. Burganos, S. V. Sotirchos: Chem. Eng. Sci. 1989, 44, 2451-2462 [17] J. Lachaud, G. L. Vignoles: Comput. Mater. Sci. 2008, 44, 1034-1041. [18] G. L. Vignoles, C. Germain, O. Coindreau, C. Mulat, W.Ros: ECS
Trans. 2009, 25, 1275-1284.
[19] G. L. Vignoles, I. Szelengowicz, W. Ros, C. Mulat, C. Germain: Ceram. Eng. Sci. Procs, in press (Sept. 2010).
[20] F. Michelet, J.-P. Da Costa, O. Lavialle, Y. Berthoumieu, P. Baylou, C. Germain: Signal Processing 2007, 87, 1655-1669.
[21] C. Mulat, M. Donias, P. Baylou, C. Germain, G. L. Vignoles: Signal, Image and Video Processing 2008, 2, 51-58.
[22] E. M. LaBolle, G. E. Fogg, A. F. B. Thompson: Water Res. Res. 1996, 32, 583-593.
[23] G. L. Vignoles, O. Coindreau, C. Mulat, C. Germain, J. Lachaud: Adv. Engng. Mater. in press (2010)
[24] P. A. Rikvold, G. Stell: J. Coll. Int. Sci. 1985, 108, 158-162.
[25] G. L. Vignoles, O. Coindreau, A. Ahmadi, D. Bernard: J. Mater. Res. 2007, 22, 1537-1550.