HAL Id: hal-00124154
https://hal.archives-ouvertes.fr/hal-00124154
Submitted on 24 Mar 2020HAL is a multi-disciplinary open access archive for the deposit and dissemination of sci-entific research documents, whether they are pub-lished or not. The documents may come from teaching and research institutions in France or abroad, or from public or private research centers.
L’archive ouverte pluridisciplinaire HAL, est destinée au dépôt et à la diffusion de documents scientifiques de niveau recherche, publiés ou non, émanant des établissements d’enseignement et de recherche français ou étrangers, des laboratoires publics ou privés.
Water experiments related to the “Von Kármán
Sodium” Dynamo Project
L. Marié, M. Bourgoin, F. Pétrélis, J. Roy, J. Burguete, A. Chiffaudel,
François Daviaud, S. Fauve, P. Odier, J.-F. Pinton
To cite this version:
L. Marié, M. Bourgoin, F. Pétrélis, J. Roy, J. Burguete, et al.. Water experiments related to the “Von Kármán Sodium” Dynamo Project. 6th Experimental Chaos Conference, Jul 2002, Potsdam, Germany. pp.622, 453-461, �10.1063/1.1487565�. �hal-00124154�
Water Experiments Related To The
"Von Karman Sodium" Dynamo Project
L M .
. ane , "1M B
. ourgo1n , . etre . 2 F P" "1. 3 IS,
J R
. oy ,1 J. Burguete1, A. Chiffaudel1, F. Daviaud1,S.
Fauve3, P. Odier2, J.-F. Pinton21SPEC, CEA I SA CLAY, 91191 Gif-su.r-Yvette Cedex, 2ENS Lyon, 46 allee d'ltalie, 69364 Lyon
3ENS, 25 rue Lhomond, 75005 Paris
Abstract. The purpose of the "Von Karman Sodium" (V.K.S.) experiment is to study the "Dynamo Effect", namely the spontaneous generation of magnetic field in a flow of electrically conducting fluid. The device has been built at CEA I Cadarache, in collaboration with CEA I
Saclay, Ecole Normale Superieure de Lyon and Ecole Normale Superieure de Paris. It consists of a cylindrical vessel, filled with liquid Sodium, in which two coaxial rotating disks induce a Von-Karman type flow. Several experimental runs have taken place since June 2000. In order to optimize the V.K.S. set-up, a half-scale water prototype has also been built. It has allowed us to measure mean velocity profiles, as well as pressure fluctuations and mechanical power dissipa tion. We have observed that under certain circumstances the mean component of the turbulent flow can undergo a global bifurcation.
INTRODUCTION
The generic term "Von Karman flows" designates the class of flows induced by the rotation of two coaxial impellers located at both ends of a cylindrical vessel. These flows have been studied in the past both experimentally[6,7,9] and numerically. They are supposed to be good candidates for the realization of an experimental homogene ous fluid dynamo. In particular, k inematic dynamo simulations in a sphere[2] and di rect numerical simulations of the Taylor-Green geometry[3] have shown that these flows can lead to self-excitation for accessible values of the magnetic Reynolds num ber R m
:::::
f..LCJLV.The "Von Karman Sodium" (V.K.S.) experiment uses liquid sodium as a working
fluid in a cylindrical vessel with diameter 40 em. Two co-axial counter-rotating im pellers driven by two 75 k W motors generate the flow. The magnetic Prandtl number of liquid metals being extremely small
(P,,
= 11av::::: w-5 ), one can expect any flow of liquid metal having a strong magnetic Reynolds number to also have a very large ki netic Reynolds number. In order to characterize the flow, extensive preliminary stud ies have been performed on a half-scale water prototype. Mean velocity profiles have been obtained and introduced in k inematic dynamo simulations of the induction equation[ 4,5]. In the following, we present torque and pressure fluctuationmeasure-ments obtained in the water experiment. We have observed in particular a global bi furcation of the flow topology in experimental conditions where the integral k inetic Reynolds number is of the order of 106.
WATER EXPERIMENTS
Experimental Setup
a) b)
FIGURE 1. Sketch of a) the Von Karman Apparatus b) the impellers. When the motor rotation rates are set to positive values, the impellers are rotated counter-clockwise.
The experimental setup is shown in figure 1. It consists of a cylindrical container, whose radius and height are Rc = 100 mm, Hc=200 mm. Four 10 mm high baffles can be mounted on the cylinder wall, parallel to the axis. The impellers, located at the ends, consist of 185 mm diameter plates, each fitted with 16 blades. Eight of the blades stop at r=30 mm from the plate center, while the others stop at r=lO mm. All the blades have a 50 mm curvature radius. A central hole, 15 mm in diameter, allows for securing to the motor shaft. Blades 10 mm high and 20 mm high have been used. The distance between the plates has been kept equal to Hd = 180 mm. The impellers are driven by two 2 kW ac motors. The angular velocities can be varied independently between-25Hz and 25Hz. The variable frequency drives are used to monitor torque and angular velocity values. A Kistler 6031 acceleration-compensated piezoelectric pressure sensor, mounted in the mid-plane of the apparatus, measures the fluctuations of the dynamical pressure. The signal is low-pass filtered at 1 kHz, then recorded at a sampling rate of 3 kHz on a PC, using a Data Translation DT3001 board.
Torque Measurements
Dimensional analysis indicates that the torque exerted by the fluid on the impellers can scale either as T ex pL'vQ or, in the limit of very large kinetic Reynolds numbers, as T ex plJQ2 • In these expressions, p z I OOOkg. m -J is the density of the fluid,
v :::10-6m2 ·s-1 is its kinematic viscosity, L=Rc =O.lm is a typical length-scale of
the flow, and Q is a typical frequency of the flow, which we have chosen to be equal to
(Q12 +Q/)112•
UsingQRL'
as a typical value of the velocity, one can define the inte gral kinetic Reynolds number asRe= QL2
/v . Even for a moderate rotation rate of 2 Hz, this yields a value of Re well in excess of 105. Figure 2 shows a typical example of the variation of the torque exerted by motor 1 with Q. One observes a very good agreement with theT
ocpL�Q2
scaling. This has prompted us to study the dimension less coefficientsC1
=T1 I pCQ2
andC2 = T2 I pL5Q2
rather than the actual torques ex erted by the motors, T, and T2 .9�---� 8 7 6 'Es � .4 1-3 2 ·� Experimental value
-o.247 + o.o129 o'·
10 15 20
O[Hz] 25 30
FIGURE 2. Variation of the torque exerted by the motor on the fluid, as a function of
n = (Q12 + Q2 2)1'2• Here both impellers were rotated in the counter-clockwise (positive) direction, at the
same rotation rate. The solid line represents the best fit obtained for a function with shape a + [3QY. The value of the exponent, L .94, is in good agreement with the expected value of 2. Friction torque in the bearings and seatings accounts for the 0.25 N.m offset. This value will be substracted from the torque data in all the subsequent graphs.
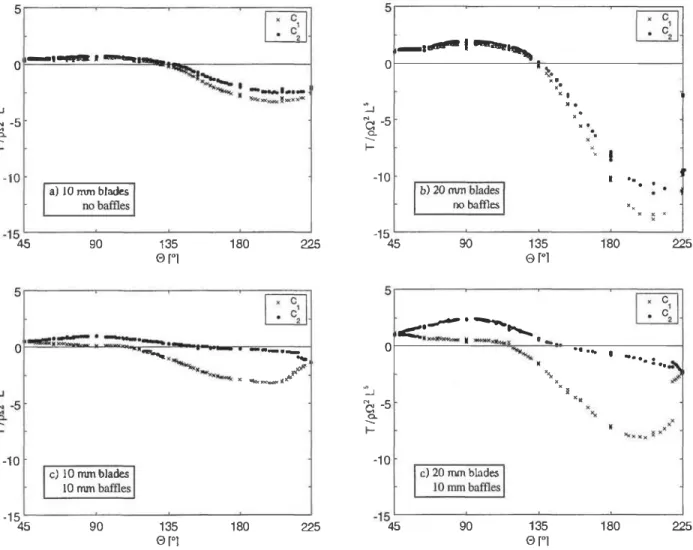
On Figure 3, we have represented the values of C1 and C2, as a function of the polar coordinate angle 8 such that (Q1, Q2) = (Qcos(8), Q sin(8)). The torque ex erted by a motor is counted positive if its natural effect would be to rotate the impeller in the positive direction.
A striking feature of the graphs of figure 3 is the good collapse on a single curve of values obtained at very different values of Q , in the range 4 Hz to 30 Hz. This proves that the scaling shown on figure 2, which was obtained in the case Q1 = Q2, is indeed quite general. Another interesting point is that, while changing the blade height only seems to introduce a (non-trivial) scaling factor in the y-direction, mounting the baf fles in the vessel changes vastly the shape of the curves. One can actually see that in the range of angles included between 160° and 225°, mounting the baffles reduces the mechanical power dissipated by the flow. A common feature of all the curves is that the strongest torque values are measured when both impellers are rotated in the nega tive direction. A last point that we find noteworthy is that on figures 3a, 3b and to some extent 3d, the two curves do not intersect at e = 225° . This means that, though the two motors operate at the same speed, the torque they exert on the fluid is signifi cantly different. This has prompted us to perform further measurements in that region,
which are presented in the next paragraph. 0_,...,.. ... _ ':J a a. -5 ... 1--10
I
a) 10 mm blades I nobaffies I -15 �..---__ __._ ___ _._ ___ ..__ __ __,1 45 90 135 180 225 er·1 0 -.... --·-. , .._ -10I
c)10 mm blades I 10 mm baffiesl ·-... . ...._./
-15 45 '---'---'---'----___J 90 135 180 225 er•1 5�--�--�--���
�2�
-·---·--,
0 • �.. .. xI ':J a -5 .. .· .. . a. ... 1- . . -10 • ••I
b) 20 rom bladesI
no baffles .. . . • : I( -15 '---'---'---'---l 45 90 135 180 225 0[•] 5�--�--�--���
���
.c::·--. -..._..._ ':J · - · --· ... 0"""'
. • •• ... • 'Is. . C: -5 • • .. a. ... 1--10I
c) 20 mm blades 1 10mmbaffiesl •... : .. _, "' ,1--15 �.--__ ___._ ___ _._ ___ _.__ __ __j 45 90 135 180 er·1 225FIGURE 3. Variations of the two dimensionless coefficients c, and c2 as functions of the angle e , for
the different flow configurations. e =45° corresponds to Q1 = Q2 > 0. For values of the angle between
45° and 90°, the two impellers move in the positive (counter-clockwise) direction. For values between
90° and 180°, impeller I moves in the negative (clockwise) direction and impeller 2 moves in the posi
tive direction. Fore =135° , we have -Q1 = Q2, Q2 > 0. Values between 180° and 225° correspond to
the case where both impellers move in the negative direction. e =225° means Q1 = Q2 < 0.
Global Bifurcation
We have seen on figure 3a and 3b that when the two impellers are rotated at the same speed in the negative direction, they do not exert the same torque on the fluid. More measurements have been performed using the 20 mm high blades, without baf fles. The results are shown on figure 4, together with sketches of the various flow con figurations observed. Seeding the flow with air bubbles, we have been able to visual ize three distinct flow configurations for
e =225°. If one first starts motor
1, then brings motor 2 to the same (negative) rotation rate, one gets to the value e =225° from below. The measured torques follow the two curves on the left part of figure 4. The flow observed in this case has only one poloidal recirculation cell. The central columnof fluid flows from impeller 2 to impeller 1. tO _J C\1 c: Cl. ..._ 1-5 .---�----�--�----�--�----� 0 -5 -10 175 200 225 250 e rol 275 300
FIGURE 4. Values of C1 and c2 as functions of the angle e , in the vicinity of e =225°(Q1 = Q2 < 0 ).
The drawings represent the various flow configurations that can be observed.
If one then goes on increasing the value of
e , either by decreasing the rotation rate
of motor 1 or by increasing that of motor 2, the flow relaxes, after a stretch of time of the order of one minute, to the mirror-symetric situation, where the central column of fluid flows from impeller 1 to impeller 2. The torques start following the curves on the right part of figure 4. If one then brings the value ofe back under 225°, the flow re
sponds in the symmetric manner, relaxing after a while to its original state. This hys teretic behaviour has also been observed with the 10 mm high impeller blades, and is apparent on the curves of figure 3d, obtained with baffles. The flow in that last situa tion being less easy to visualize with air bubbles, we are not yet able to describe the different configurations.The third configuration is obtained when the rotation rates of the two motors are kept equal all the way from standstill to their final value. The flow obtained in that case has two po1oidal recirculation cells of roughly equal size. The torques exerted on the fluid by the two motors are equal, and their value is much smaller than the ones observed in the previous cases. This situation corresponds to the data points situated immediately below the sketch in the middle of figure 4. This flow configuration is meta-stable, in that it spontaneously relaxes, after a stretch of time that can be as long as one or two hours, in one of the other two configurations. We have never observed the converse evolution.
Pressure fluctuation measurements
Pressure root-mean-squared values
pV 2 ::::: p0.2 R2 . Figure 5 shows the variations of the root-mean-squared value of the pressure fluctuations divided by p0.2 R2 , in the case of 20 mm high blades and no baf fles. Once again, the collapse of the points on the curve is quite good, except near the two end points, where the large values obtained for Prms suggest that statistical conver gence may not have been achieved.
5.---�----�----��----. 4 1 •
.,
= ... : .. :--I ... ,... I • • :... . ... .
Q L-----�----
�----
�----
� 45 180 225FIGURE 5. Variation of �>,,.,! pD.!Rl as a function of 8 , in the case of 20 mm high impeller blades,
without baffles.
One can see that the pressure fluctuations amplitude depends strongly on the value of e
.
Seeding with air bubbles allowed us to connect modifications of the flow struc ture to some of the features of figure 5. At e =45°, which is the case of balanced counter-rotation (n. = n2 > o),
we have observed two poloidal recirculation ceJls, sepa rated by a vigorous mixing layer, in which very powerful vortices evolve. Between 45° and 60°, this mixing layer is gradually shifted towards the slower impeller, while the pressure fluctuations measured in the mid-plane diminish. Between 60° and 90°, the mixing layer stays confined between the impeller blades, where it remains quite active. The pressure fluctuations remain at a nearly constant level. After 90°, the two impellers start moving in the same direction in the laboratory frame. The pressure fluctuations gradually get smaller, until e reaches 135°(-
n. = 02, Q2 > o)
. Here thetwo impellers move at the same speed in the laboratory frame, and the fluid is nearly in solid body rotation. The flow is very quiet, as can be seen from the pressure fluc tuations level. For values of
e
between 135° and 225°, the flow seems to have a single poloidal recirculation cell, in which a "bubble packet" rotates in a periodic fashion. Here the pressure fluctuations gradually increase, and reach their most important val ues ate
=225°.Pressure time series and power spectral density
We have displayed time series and power spectral densities of three examples of pressure signals on figure 6. All of them have been obtained with 20 mm high impeller blades, without baffles.
Figure 6a and 6b have been obtained in the case of counter-rotation with both im-6
pellers rotating at 20 Hz
(
8 =45°). As we have mentioned above, the flow has two dis tinct poloidal recirculation cells, separated by a mixing layer. The time series exhibits strong downward peaks. Such events have been studied in the past [6,7], they are usu ally associated with regions of very concentrated vorticity. The power spectral density exhibits two distinct scaling regions. At low frequencies, the spectrum decays alge braically with a slope -1.2. At high frequencies, the spectrum slope is -3. 1.5 �--�----�----�----�--� 4 3 2 -2 -3 -4 -5�--�----�----�----�--� 0 20 40 60 80 100 nt 5 �--�----�----�----�--� 4 3 -3 -4
I
c)Ot=OHz �=20Hz -5�--�----�----�----�--� 0 20 40 60 80 100 Ut 5 .---�----�----�----�--� 4 3 2 ':.11�
0 "") Cl. -1 -2 -3 -4I
e) Ot=-6 Hz �=-6Hz -5 L__ __ ___. ____ __._ __ __ __._ ____ __ __, 0 20 40 60 80 100 UtI
d)Qt=OHz Qr20HzI
f)Ut=-6 Hz �=-6Hz 104 �----�---�----�---� 10� 10� 10° 101 102 f/QFIGURE 6. Time series and power spectral densities of typical pressure signals. The time has been
Figure 6c and 6d have been obtained with only one impeller rotating at 20 Hz (
e
=90°). The time series has a very different ("whiter") texture. The power spectmmis flat at low frequencies for two and a half decades, roughly until f z 40. At high
frequencies, it displays an algebraic decay, with exponent -3.9. This value is reminis cent of the - 1 1/3 exponent predicted by [8] for the spatial spectmm of pressure fluc tuations. However, it is not clear that the very high amplitude of the velocity fluctua tions we observe in the flow permits the use of a Taylor hypothesis to translate from the temporal to the spatial domain.
Last, figure 6e and 6f have been obtained with both impellers rotating at -6 Hz
( e
=225°). This quite low rotation rate is actually the largest our motors can sustain, since the torques values involved are already as high as 15 N.m. The flow studied in that particular run is one of the flows that have only one peloidal recirculation cell. Both the time series and the power spectral density show that the flow has a very strong periodic component at a frequency f z 0.20 . Seeding the flow with air bub bles, we have seen them concentrate in a diffuse "packet" located near the cylinder wall, roughly in the midplane, which precesses in the azimuthal direction. No such things can be observed in the case of the symetric, meta-stable flow.CONCLUDING REMARKS
We have performed systematic torque and pressure fluctuations measurements on a fully turbulent Von Karman flow induced in a cylindrical container by two impellers. We have studied in particular the influence of the height of the impellers' blades, as well as the influence of baffles mounted on the cylinder walls. This allowed us to ob serve and characterize the strongly hysteretic behaviour of the mean flow structure, as well as a global bifurcation of its topology.
Quantitative Laser Doppler Velocirnetry measurements are underway to study the different flow structures. Particular attention is paid to the cases where the perturba tions induced by the baffles preclude good visualization using air bubbles.
ACKNOWLEDGMENTS
We thank Vincent Padilla for actually building the experimental apparatus, and Ce cile Gasquet for helping us in setting up the various instruments and the programs as sociated with them. We thank D. Ericher, P. Meininger, D. Bonamy and B. Dubrulle for fruitful discussion. J. B. thanks the Ministerio de Educaci6n y Ciencia (spanish government) for a post-doctoral grant when working at the CEA.
REFERENCES l. Zandbergen P.J., Dijkstra D., Ann. Rev. Fluid Mech. 19,465 (1987). 2. Dudley N.L., James R.W., Proc. Roy. Soc. Lond. A425, 407 (1989).
3. Nore C., Brachet M.-E., Politano H., Pouquet A., Phys. Plasmas 4, 1 (1997).
4. Marie L.,Burguete J., Chiffaudel A., Daviaud F., Ericher D., Gasquet C., Petrelis F., Fauve S., Bourgoin M.,
Moulin M., Odier P., Pinton J.-F., Guigon A., Luciani J.-B., Namer F., Leorat J., "M.H.D. in Yon Karman swirling flow, development and first run of the Sodium experiment" in Lecture Notes in Physics. Dynamo and
Dynamics, A Mathematical Challenge. Cargese (France), 2000 edited by P. Chossat, D. Armbruster, J. Oprea,
NATO ASI series, Kluwer Academic Pub!., 2001.
5. Burguete J., Daviaud F., Leorat J., Marie L., "Homogeneous dynamo: numerical analysis of
experi-mental von Karman type flows", preprint, (200 1 ).
6. Fauve, S., Laroche C., Castaing B., J. Phys. II, 3, 271, (1993).
7. Cadot, 0., Douady, S., Couder, Y., Pys. Fluids A7, 630-646 (1995).
8. George W.K., Beuther P.D., Arndt R.E.A., J. Fluid Mech. 148, 155-191 (1984). 9. Mordant N., Pinton J.-F., Chilla F., J. Phys. ll, 7, I (1997).