HAL Id: hal-02080797
https://hal-amu.archives-ouvertes.fr/hal-02080797
Submitted on 27 Mar 2019
HAL is a multi-disciplinary open access
archive for the deposit and dissemination of
sci-entific research documents, whether they are
pub-lished or not. The documents may come from
teaching and research institutions in France or
abroad, or from public or private research centers.
L’archive ouverte pluridisciplinaire HAL, est
destinée au dépôt et à la diffusion de documents
scientifiques de niveau recherche, publiés ou non,
émanant des établissements d’enseignement et de
recherche français ou étrangers, des laboratoires
publics ou privés.
Experimental, numerical and theoretical investigation of
the converging Richtmyer-Meshkov instability in a
conventional shock tube
Marc Vandenboomgaerde, Pascal Rouzier, Denis Souffland, Christian Mariani,
Laurent Biamino, Georges Jourdan, Lazhar Houas
To cite this version:
Marc Vandenboomgaerde, Pascal Rouzier, Denis Souffland, Christian Mariani, Laurent Biamino, et al..
Experimental, numerical and theoretical investigation of the converging Richtmyer-Meshkov instability
in a conventional shock tube. 16th International Workshop on the Physics of Compressible Turbulent
Mixing, Jul 2018, Marseille, France. �hal-02080797�
converging Richtmyer-Meshkov instability in a conventional
shock tube
M. Vandenboomgaerde, P. Rouzier, D. Souffland
CEA, DAM, DIF, F-91297 Arpajon, France marc.vandenboomgaerde@cea.fr
C. Mariani, L. Biamino, G. Jourdan, L. Houas
Aix Marseille Univ, CNRS, IUSTI, Marseille, France georges.jourdan@univ-amu.fr
Abstract
Since several years, the CEA/DAM and the IUSTI laboratory investigate the Richtmyer-Meshkov instabil-ity [1, 2] at the interface between two fluids in cylindrical geometry while still using a conventional shock tube. Two configurations have been studied: the heavy-to-light case where the incident shock wave goes from SF6to air, and the light-to-heavy case where the incident shock wave goes from air to SF6. The effects of compression, geometrical convergence, and the subsequent deceleration of the flow on the perturbed interface, i.e. the Bell-Plesset (BP) effects [3, 4], are quantified for these two configurations.
I.
Introduction
Converging shock waves are involved in several fields of high-energy physics, such as astrophysics and inertial confinement fusion. These shock waves interact with material interfaces, and generate deleterious hydrodynamic instabilities known as the Richmyer-Meshkov (RM) instabilities [1, 2]. In order to identify and quantify the different processes at play in these instabilities (geometry, deceleration, compressibility, and nonlinearity), models are needed. The accuracy of these models must be estimated by comparison with experiments or numerical simulations. In this study, we have undertaken an experimental and numerical cross-checking on the two configurations of the RM instability: when the incident shock wave goes from the heavy fluid to the light fluid, and the opposite case. This cross-checking confirms the accuracy of our numerical simulations. Second, simulations have been run to provide reliable reference test cases for the theoretical models. The discrepancies between the reference results and the model predictions are used to discriminate between the different effects which drive the cylindrical RM instability.
II.
Experimental set-up
The experiments are carried out using a conventional shock tube with a square inner cross section of 80 mm by 80 mm. At the shock tube end, a three-fluid three-zone convergent system has been added to study the cylindrical RM instability. The half apex angle of the test cell is equal to
θ0=15◦. For the heavy-to-light configuration, the three fluids are air/SF6/air. The first interface
(air/SF6) transforms the planar incident shock wave into a cylindrical one [5]. The second interface
(SF6/air) is the interface where the RM instability is studied. A single mode perturbation is
imposed at this interface, and its polar shape reads as: r(θ) =0.1−0.0015(1−cos(2πθ/θ0)).
M. Vandenboomgaerde et al. 0.04 0.02 0.00 -0.02 -0.04 0.04 0.02 0.00 0.06 0.08 0.10 0.12 0.14 (m) (m) Air SF6 Air 0.04 0.02 0.00 -0.02 -0.04 0.04 0.02 0.00 0.06 0.08 0.10 0.12 0.14 (m) (m) He Air SF6 (a) (b)
Figure 1:(a) Schemes of the heavy-to-light configuration (top), and the light-to-heavy configuration (bottom). (b) Photograph of the stereo-lithographied support grids and membranes
the cylindrical shock wave. The perturbation shape at the interface of interest (air/SF6) reads as:
r(θ) =0.07−0.0015(1−cos(2πθ/θ0)). In both configurations, the Mach number of the incident
planar shock wave is equal to 1.15. The reference of time, t=0, is the time when the shock wave
hits this first interface. Figure 1-a displays the schematics of the two cases. The materialization of the interfaces is obtained using double layers of 0.5 µm thick nitrocellulose membranes combined with stereo-lithographied support grids. As shown in Fig. 1-b, the geometry of the grids is two-dimensional (2D). However, the crossbars of the grids lead to three-dimensional (3D) features. To visualize the flow patterns, a Z-type Schlieren system is used.
III.
Shape of the perturbation
i.
Comparisons between experimental data and numerical simulations
In Ref. [6], we have shown that the grid must be taken into account in the 2D numerical simulations in order to understand the experimental shape of the studied interface. To compute the overall flow with the grid effects, the multimaterial hydrocode Hesione [7] is used. The hydrodynamic package is a Lagrangian remap using a cartesian grid, and a BBC scheme with a spatially staggered method. The grids are considered as stationary areas. Let us note that our simulations do not take the membrane into account.
The Fig. 2 presents a superimposition of the experimental images, and the numerical interfaces at t = 0.74 ms and t = 0.475 ms, for the heavy-to-light and the light-to-heavy configurations, respectively. The experimental perturbed interfaces which are sharp at t = 0 due to the membrane, appear blurry after the shock passage. Different causes can be proposed to explain this widening of the interfaces: the nitrocellulose remnants generated by the rupture of the membrane, and 3D effects due to the grid. In the first configuration (Fig. 2-a), the interface which is obtained with
(a) (b)
Figure 2:Superimposition of experimental images and numerical interfaces. (a) Heavy-to-light configuration at t = 0.74 ms. (b) Light-to-heavy configuration at t = 0.475 ms
2D simulations matchs with the left side of the blurry experimental interface. For the second configuration (Fig. 2-b), the numerical interface appears within the blurry area.
ii.
The effects of the grid crossbars
In order to assess the effects of the grid crossbars on the interface dynamics, the 3D RM instability development has been computed by the Hesione code for a single 3D pattern of the grid. As seen in Fig. 3, the crossbar leaves a 3D imprint on the 2D interface. In the heavy-to-light configuration (Fig. 3-a-c, left side), the amplitude of the perturbation reverses. The 3D imprint reverses faster than the 2D perturbation. It quickly overruns the main perturbation which remains 2D. In the other configuration (Fig. 3-d-f, left side), there is no reversal of the perturbation. The 3D imprint trails behind the mainly 2D interface. In order to estimate the discrepancies between the effects of a 2D and a 3D grid, we compare the extent of density gradients which are obtained by the corresponding simulations. In the heavy-to-light configuration, the interface which is obtained by 2D simulations rapidly superimposes with the left side of the 3D interface (Fig. 3-a-c, right side). This is due to the quick reversal of the 3D imprint. This superposition also indicates that the 3D effects have little influence on the overall 2D dynamics of the interface. For the other configuration, the interface which is obtained by 2D simulations superimposes with the right edge of the 3D interface (Fig .3-d-f, right side). This is consistent with the direct growth of the perturbation. The negligible effect of the 3D imprint on the 2D dynamics is confirmed.
In the light of these conclusions, Fig. 2 can be understood as follows. In the heavy-to-light case, the 2D numerical interface matches with the left side of the blurry area: the 3D imprint, and membrane remnants overrun the mainly 2D interface. In the light-to-heavy case, the 2D numerical interface is within the blurry area: the 3D imprint trails behind the interface, but the membrane remnants overrun it.
iii.
Growth of the perturbation
As we have hereabove shown that 3D effects do not affect the overall development of the instability, we now only consider 2D numerical simulations. Figure 4 presents the time evolution of the
half peak-to-valley amplitude of the perturbations, a(t). For the heavy-to-light configuration, the
growth of the left edge of the experimental interface is roughly linear with time (Fig. 4-a). The growth which is obtained from the numerical simulation correctly fits the experimental data. For the light-to-heavy configuration, the growth of the perturbation saturates, and after t = 0.5 ms, the amplitude even decreases (Fig. 4-b). This behavior is also found by the Hesione code. Let us note that the growth which is obtained by the code fits between the growths of the perturbed left and
M. Vandenboomgaerde et al. SF6 x (m) 0.01 0.005 0. z (m) t = 615µs t = 415µs 0.01 0.005 0. z (m) x y-integrated 3D interface 2D interface SF6 Air 2D grid bar 2D grid bar x 0.01 0.005 0. z (m) t = 515µs SF6 Air SF6 Air SF6 Air z y x a) b) c) Interface Crossbar wake 3D grid bars Von Karman vortex street Interface Interface SF6 Air z y x Interface Crossbar wake 3D grid bars SF6 Air Interface SF6 Air Interface y-integrated 3D interface 2D interface SF6 Air y-integrated 3D interface 2D interface SF6 Air t = 275µs 0.01 0.005 0. z (m) x y-integrated 3D interface 2D interface Air 2D grid bar 2D grid bar SF6 t = 375µs 0.01 0.005 0. z (m) y-integrated 3D interface 2D interface Air x SF6 t = 475µs 0.01 0. z (m) y-integrated 3D interface 2D interface Air d) e) f)
Figure 3:(a-c) Heavy-to-light configuration. (d-f) Light-to-heavy configuration. Left side: 3D pattern of the grid and interface. Right side: Comparison between the interface from the 2D simulations, and the area of the density gradients in the 3D simulations
8 0 1 2 3 4 5 6 7 9 10 0.20 0.25 0.30 0.35 0.40 0.45 0.50 0.55 0.60 0.65 a) b)
SF
6Air
Air
SF
6 0.35 0.40 0.45 0.50 0.55 0.60 0.65 0.70 0.75 0.80 0 -8 -7 -6 -5 -4 -3 -2 -1 1 2Figure 4:Growth of the perturbation. Symbols and lines represent the experimental data, and the numerical simulation, respectively. (a) Heavy-to-light configuration. (b) Light-to-heavy configuration
right edges of the experimental interface.
As the Hesione code does not take into account the membrane, the good agreement between the experiments and the numerical simulations strengthens the assertion that the membrane remnants do not affect the global dynamics of the instability [6, 8] when the Mach number of the incident shock wave is high enough. For the heavy-to-light and the light-to-heavy configurations, the Mach numbers of the converging shock waves when they interact with the perturbed interface are 1.27 and 1.32, respectively.
IV.
Theoretical study of the instability growth
i.
Method and models
Most theoretical models which are derived to study the Bell-Plesset (BP) effects in cylindrical geometry deal with a canonical single-mode perturbation at a sharp interface. Furthermore, grids are not considered in these models. The accuracy of the Hesione code has been checked through the comparisons with the experimental data in the previous section. Therefore, results of the 2D Hesione simulations on the canonical test case will be used as references in the following. The initial conditions for the interfaces and flows are those defined in Sec. II.
Our method to assess the BP effects goes through several steps:
• The linear growth of the planar RM instability is estimated for incompressible fluids. • This growth rate is used as initial condition for the linear growth of the Rayleigh-Taylor
(RT) instability [9, 10] in cylindrical geometry for incompressible fluids. In this case, the amplitude of the perturbation follows Eq.(1) which has been derived in Ref. [11]:
d2a dτ2+2 ˙ R R da dτ− (n A−1) ¨ R R a=0 (1)
where n=2π/θ0, R is the radius of the unperturbed interface, A the Atwood number, and τ
the time. For the RT instability, the Atwood number is defined as A= (ρSF6−ρair)/(ρSF6+
ρair) in the heavy-to-light configuration. The reference time for τ, i.e. τ = 0, is when the
interface starts moving.
• The role of compressibility is estimated in the linear phase using a dedicated model [6]. The amplitude of the perturbation now follows Eq.(2):
d2a dτ2 +C1(τ) ˙ R R da dτ−n A(τ) ¨ R R a+C2(τ) ˙ R2 R2 a=0 (2)
where C1and C2are functions depending on densities and velocity profiles at the interface.
• The range of validity of the previous linear theories is (n a/R) < 1. In order to get the
trend of the nonlinear growth, a P20Padé approximant is build using the linear growth for
compressible flows, and a weakly nonlinear theory [12] for the RT instability in cylindrical geometry. The Pade approximant reads as:
aNL(τ) = aL(τ)
1+R(0)1 2[n2(3A2+1) −A n−9]a2
L(τ)
(3)
M. Vandenboomgaerde et al.
Fit of Hesione simulation Coasting trajectory r (m) τ(ms) 0.075 0.08 0.085 0.09 0.095 0.1 0 0.1 0.2 0.3 a) -8. -6. -4. -2. 0.10 0.20 0.30 a (mm) τ(ms) numerical simulation linear incompressible theory linear compressible theory nonlinear compressible model theoretical limit of the linear theory
n a R = 1 b)
Figure 5:Heavy-to-light case. (a)Trajectory of the unperturbed interface from the Hesione simulation without any grid. (b) Growth of the amplitude. Continuous curves are obtained by the linear theories. The dotted curve is obtained by the nonlinear model. The dot-dashed curve gives the range of validity of the linear theories. Symbols represent the results which are obtained by the Hesione code
ii.
The heavy-to-light case
Figure 5-a presents the trajectory of the unperturbed interface. A slight deceleration occurs for
τ>0.2 ms. Figure 5-b presents the growth of the perturbation which is obtained by the different
models, and the simulation. The Hesione code predicts a linear growth with time. This kind of growth is typical of the linear phase of the planar RM instability, where no convergence or deceleration effects occur. However, the linear incompressible theory in cylindrical geometry predicts an increase of the magnitude of the perturbation amplitude due to the BP effects (red
curve). This can be explained by geometrical effects, and by the fact that SF6 (heavy fluid) is
slowed by air (light fluid). As seen in Fig. 5-b, the compressibility leads to a slight stabilization of the perturbation (blue curve). When the nonlinear cylindrical model is used, the linear growth with time is recovered (dotted curve), and is in good agreeement with the Hesione results. Let us note that the nonlinear model would fail to keep this linear growth much further. This failure
is embeded in the P20expression which can only go to zero when the linear amplitude goes to
infinity.
In conclusion, the peculiar linear growth which is found in this heavy-to-light configuration is explained by the nonlinear saturation of the growth increase due to the BP effects.
iii.
The light-to-heavy case
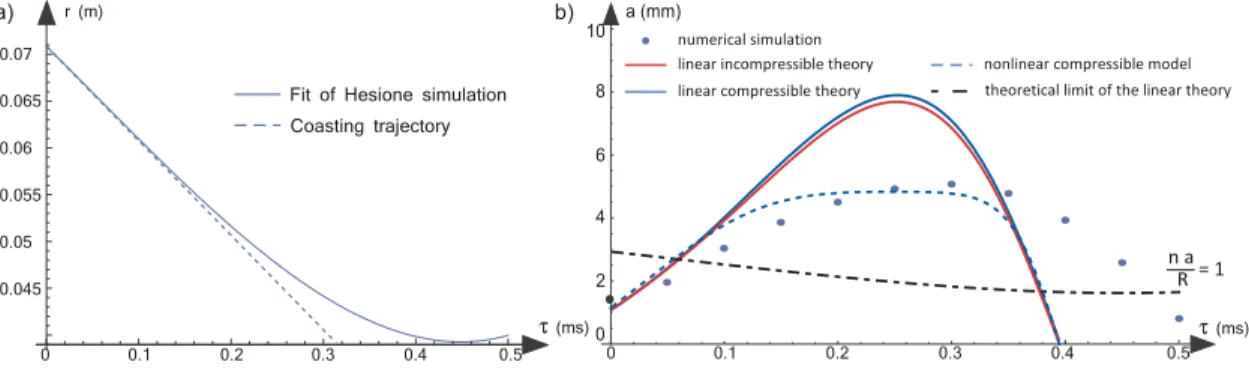
Figure 6-a presents the trajectory of the unperturbed interface. A strong deceleration occurs for
τ>0.2 ms. Figure 6-b presents the growth of the perturbation obtained by the different models,
and the simulation. The Hesione code predicts a saturated growth of the perturbation, which is followed by a decrease of the amplitude of the perturbation. This can be explained by the strong
stabilization of the convergent effects due to the fact that air (light fluid) is slowed by SF6(heavy
fluid). The linear models predict such a trend (solid curves). In this light-to-heavy configuration, compressibility slightly increases the growth. These linear models strongly overestimate the maximum amplitude that the instability can reach. This is consistent with the fact that the nonlinear regime occurs early in time. Indeed, there is no phase reversal of the perturbation, and the amplitude directly grows once the interface moves. The nonlinear model (dotted curve) recovers the correct maximum amplitude, but fails to correctly describe the perturbation dynamics
for τ>0.35 ms. This failure is embeded in the P20expression which can only go to zero when the
linear amplitude is null.
In conclusion, the saturated then decreasing growth of the perturbation in this light-to-heavy case 120
0.045 0.05 0.055 0.06 0.065 0.07 0 0.1 0.2 0.3 0.4 0.5
Fit of Hesione simulation Coasting trajectory r (m) τ(ms) a) 2 4 6 8 10 a (mm) 0 0 0.1 0.2 0.3 0.4 0.5τ(ms) numerical simulation linear incompressible theory linear compressible theory
nonlinear compressible model theoretical limit of the linear theory
n a R = 1 b)
Figure 6:Light-to-heavy case. (a)Trajectory of the unperturbed interface from the Hesione simulation without any grid. (b) Growth of the amplitude. Continuous curves are obtained by the linear theories. The dotted curve is obtained by the nonlinear model. The dot-dashed curve gives the range of validity of the linear theories. Symbols represent the results which are obtained by the Hesione code
is explained not only by the nonlinear regime of the instability, but also by a strong stabilization at the interface.
V.
Conclusion
A study of the Bell-Plesset effects on the RM instability in cylindrical geometry has been un-dertaken. The heavy-to-light and the light-to-heavy configurations have been compared in the nonlinear regime. In the first case, the saturation due to nonlinearity counteracts the increasing growth of the perturbation which is fueled by the RT instability. This leads to a perturbation growth which is linear with time. In this case, theoretical model also shows that compressibility tends to stabilize the perturbation. In the second case, the perturbation amplitude quickly stops growing, and even decreases. The saturation due to nonlinearity is supported by RT stabilization at the interface. In this case, theoretical model also shows that the compressibility tends to destabilize the perturbation.
In both cases, the precise knowledge of the background flow is paramount in order to correctly estimate the deceleration of the interface which determines the RT part of the growth. The compressibility is also at play but, in our experimental configurations, its role is only marginal. For higher Mach numbers or higher convergence ratios, compressibility effects could be more
important. Finally, this study shows that nonlinearity occurs ealier than the condition n a/R=1.
The present work underlines the need for new nonlinear models which are not derived from expansion series and Padé approximants, since their late time behavior is questionable.
Acknowledgements
This work is supported by CEA, DAM under Contracts No. 13-31-C-DSPG/CAJ, No. 14-48-C-DSPG/CAJ, and No. CAJ-16-69.
References
[1] R.D. Richtmyer (1960) Taylor instability in shock acceleration of compressible fluids Commun. Pure Appl. Math., 13, 297
M. Vandenboomgaerde et al.
[3] G.I. Bell (1951) Taylor instability on cylinders and spheres in small amplitude approximation Los Alamos Scientific Laboratory Report, No.LA-1321
[4] M.S. Plesset (1954) On the stability of fluid flows with spherical symmetry J. Appl. Phys., 25, 96
[5] M. Vandenboomgaerde and C. Aymard (2011) Analytical theory for planar shock focusing through perfect gas lens and shock tube experiment designs Phys. Fluids, 23, 016101
[6] M. Vandenboomgaerde, P. Rouzier, D. Souffland, L. Biamino, G. Jourdan, L. Houas and C. Mariani (2018) Nonlinear growth of the converging Richtmyer-Meshkov instability in a conventional shock tube Phys. Rev. Fluids, 3, 014001
[7] F. Bonneau, P. Combis, J.L. Rullier, J. Vierne, B. Bertussi, M. Commandre, L. Gallais, J.Y. Natoli, I. Bertron, F. Malaise and J.T. Donohue (2004) Numerical simulations for description of UV laser interaction with the gold nanoparticles embedded in silica Appl. Phys. B: Lasers Opt., 78, 447
[8] M. Vandenboomgaerde, D. Souffland, C. Mariani, L. Biamino, G. Jourdan and L. Houas (2014) An experimental and numerical investigation of the dependency on the initial conditions of the Richtmyer-Meshkov instability Phys. Fluids, 26, 024109
[9] Lord Rayleigh (1950) Investigation of the character of the equilibrium of an incompressible heavy fluid of variable density Proc. London Math. Soc., s1-14, 170
[10] G.I. Taylor (1950) The instability of liquid surfaces when accelerated in a direction perpendic-ular to their planes Proc. R. Soc. London Ser. A, 201, 192
[11] K.O. Mikaelian (2005) Rayleigh-Taylor and Richtmyer-Meshkov instabilities and mixing in stratified cylindrical shells Phys. Fluids, 17, 094105
[12] L.F. Wang, J.F. Wu, W.H. Ye, W.Y. Zhang and X.T. He (2013) Weakly nonlinear incompressible Rayleigh-Taylor instability growth at cylindrically convergent interfaces Phys. Plasmas, 20, 042708