HAL Id: cea-02509259
https://hal-cea.archives-ouvertes.fr/cea-02509259
Submitted on 16 Mar 2020
HAL is a multi-disciplinary open access
archive for the deposit and dissemination of
sci-entific research documents, whether they are
pub-lished or not. The documents may come from
teaching and research institutions in France or
abroad, or from public or private research centers.
L’archive ouverte pluridisciplinaire HAL, est
destinée au dépôt et à la diffusion de documents
scientifiques de niveau recherche, publiés ou non,
émanant des établissements d’enseignement et de
recherche français ou étrangers, des laboratoires
publics ou privés.
Implementation of a new gamma spectrometer on the
MERARG loop Application to the volatile fission
products release measurement.
B. Cornu, S. Bernard, Yves Pontillon, B. Gleizes, E. Hanus, G. Ducros, C.
Roure
To cite this version:
B. Cornu, S. Bernard, Yves Pontillon, B. Gleizes, E. Hanus, et al.. Implementation of a new gamma
spectrometer on the MERARG loop Application to the volatile fission products release measurement..
ANIMMA 2015 - International Conference on Advancements in Nuclear Instrumentation,
Measure-ment Methods and their Applications, Apr 2015, Lisbonne, Portugal. �cea-02509259�
Implementation of a new gamma spectrometer on the
MERARG loop: Application to the volatile fission
products release measurement.
S. Bernard, B.
Gleizes
, Y. Pontillon, E. Hanus, G. Ducros, C. Roure, B. CornuAbstract– The MERARG facility initially aims at the annealing
of irradiated fuel samples to study the gaseous fission products release kinetics. In order to complete the evaluation of the source term potentially released during accidental situation, the MERARG experimental circuit has been enhanced with a new gamma spectrometer. This one is directly sighting the fuel and is devoted to the fission products release kinetics. Because of the specificities of the fuel measurements, it has been dimensioned and designed to match the specific requirements. The acquisition chain and the collimation system have been optimized for this purpose and a first set of two experiments have shown the good functioning of this new spectrometry facility.
I. INTRODUCTION
Until a recent past, the MERARG experimental loop implemented in a hot cell (C7) at the LECA facility was devoted to study the gaseous fission products release [1], [2]. More precisely, it has the ability to heat an irradiated fuel sample up to temperature levels that allow total or partial extraction of the fission gas initial inventory and to measure their release kinetics.
For this purpose, the MERARG loop is composed of several parts. The first one, placed inside the hot cell, is the induction furnace in which the sample will undergo the annealing test. A specific filter which is placed downstream of the furnace retains the fission products aerosols inside the hot cell. The second part, i.e. the experimental circuit, is connected to the filter and leads the gaseous fission product to a gamma spectrometer located outside the hot cell. This one is dedicated to record the fission gas kinetics release and allows the identification and quantification of the measured gas. The gamma spectrometer is followed by a glove box which contains a micro gas chromatograph and in the near future à mass spectrometer [3] and two capacities to store the gas released during the sequence. A second separated gamma spectrometer is devoted to the quantitative measurement of aliquot taken from the experimental gas flow inside the glove box during the different phases of the thermal sequence. Finally, a gamma spectrometry bench placed inside the hot cell completes the examination capabilities of the MERARG loop up to its ability to quantitatively characterize the sample before and after the thermal sequence.
S. Bernard, B. Gleizes, Y. Pontillon, E. Hanus, G. Ducros are with CEA, DEN, DEC, SA3C, F-13108 Saint Paul lez Durance, France (telephone: + 33 4 42 25 38 13, e-mail: sebastien.bernard@cea.fr).
C. Roure, B. Cornu are with CEA, DEN, DTN, SMTA, F-13108 Saint Paul lez Durance, France.
Recently, a new measurement detector, presented below, has been developed to enhance the capabilities of the MERARG loop by the evaluation of source term potentially released in accidental situation such as LOCA. This new device, directly sighting at the furnace crucible, allows therefore the measurement of the volatile fission products release kinetics. It is thus possible to estimate the released fraction of both gaseous and volatile fission products.
Because most of the fission products of interest are gamma emitters, the high resolution gamma spectrometry has been chosen as the most powerful technique to follow their behavior. Nevertheless, the specificities of the irradiated high activity fuel sample involve specific developments [4] such as a long distance between the sample and the detector (around one meter or more), complex collimation systems composed of pre- and post-collimator to correspond to the sample dimensions and activity, high counting rate (more than 100.000 c/s) data acquisition units to ensure good quality measurements.
II. GAMMA SPECTROMETRY FACILITY
This new gamma spectrometry device, also called “gamma station”, can be separated in two parts according to their functions as follow.
A. The acquisition chain
The measurement of the fission products release kinetics imposes several specificities for the data acquisition chain.
The first concerns the high activity level of irradiated fuel samples and its decrease during experimentation. Due to the FP release the incoming count rate (ICR) recorded by the electronics, which is related to the measured activity, will strongly decrease. In order to achieve acquisition frequency greater than the physical fluctuation (faster than one spectrum per minute) and accurate measurements the ICR should be maintained as high as possible by mean of collimators adjustment (see below). This imposes fast acquisition electronics able to operate at a high count rate (upper than 100 kc/s) without count loss. Classic digital signal analyzer (DSA) usually met in gamma spectrometry can answer to this problem when properly set.
The second specificity of FP release kinetics measurement is the fast fluctuations of the ICR. The classic dead time correction method based on live time extension does not correct properly count losses as it averages the dead time fluctuations encountered during a spectra acquisition.
Moreover, it drastically increases the total acquisition time at extreme count rates which is thus not compatible with measured fluctuations. On the MERARG loop, this method is replaced by the virtual pulse generator (VPG) method [5] based on the real-time correction of the spectra. Instead of extending the total acquisition time, this method adds to the ADC channel corresponding to the energy of the treated event an integer number of counts incremented by a weighting factor. This factor is statistically determined based on the number of lost events during the processing time of a pulse using the Virtual Pulse Generator technique implemented in the counting system [6].
The third aspect that has to be taken into account is the complexity of the γ spectra of freshly irradiated fuel. The presence of short lived FPs in the fuel involves complex spectra including numerous γ-ray lines often overlapping each other. In order to minimize this overlap and facilitate the unfolding process, the detector performances have to be specified to match the resolution requirements.
The data acquisition chain is based on the following hardware to correspond to all the specificities of the measurement of FPs release kinetics from freshly irradiated fuel.
• The gamma detector is a CANBERRA high purity germanium coaxial detector. It has been dimensioned at 10% of relative efficiency to correspond to the high activity level of the studied fuel samples. The FWHM (Full Width at Half Maximum) has been specified to be better than 1.8 keV at 1332 keV to ensure the good unfolding of the expected complex spectra of freshly irradiated fuel. The gamma detector is electrically cooled (Cryo-Pulse 5 type) to respect the technical constraint of rear part of the hot cell where it is installed (no need of liquid nitrogen supply).
• The data acquisition electronics is a CANBERRA LYNX digital signal analyzer which includes all the main functions of typical gamma spectrometry electronics. It contains a DC power stage to supply the detector preamplifier (PA), a high-voltage power supply (HVPS) to bias Ge crystal, the trapezoidal digital filtering functions for the PA detector signal shaping, an analog-to-digital conversion (ADC) stage and the communication features (TCP-IP protocol) with the acquisition computer. The LYNX also includes the specific loss free counting (LFC) acquisition mode for real–time dead time correction.
• The data acquisition is controlled with the homemade software PEGASE-2 written with the VisualBasic 6 code and installed on a classic personal computer. PEGASE-2 uses the main libraries of Genie2000 to communicate with the LYNX module, display and pre-analyze the acquired spectrum.
The performances of the acquisition chain have been optimized using the well-known “two source method” [7]. In this method the spectrum of reference fixe source (152Eu) is progressively perturbed by a set of three mobile sources (two
60Co and one 137Cs). For each step of perturbation,
corresponding to an increase in terms of ICR, a spectrum is recorded. The dead time correction is monitored calculating the ratio of the surfaces of the 152Eu γ-ray lines in the perturbed and the unperturbed spectra. The ICR rate has been increased in four steps ranging from 23 kc/s to 90 kc/s. The results can be illustrated by the following where the deviation of the reference peaks surfaces is plotted as a function of the total ICR.
Using this method, the dead time correction allows measurement deviation that never exceeds 2.5% in our range of count rates.
Fig. 1. Dead time correction of the LYNX module using the VPG method. Deviation calculated on 4 γ-lines of the 152Eu covering the energy range of
interest.
B. The collimation set
The application of gamma spectrometry to irradiated or freshly irradiated fuel samples involves some facility constraint. Because of the high activity of the samples, typically 1012 Bq per cm of fuel rod, experimentation takes place in hot cells. These conditions lead to geometrical specificities of the gamma station such as long distance between the detector and the sample and collimation system adapted to the measurement requirement. On the MERARG facility, the collimation set is composed of five separated parts:
• The pre-collimator is installed inside the hot cell in the furnace structure to be as close as possible of the fuel sample. It is composed of a tungsten alloy block (10 cm x 10 cm x 10 cm) with a 12 mm high and 20 mm large aperture. These dimensions correspond to a fuel pellet height centered in the furnace crucible. The axis of the aperture has been geometrically pre-aligned with the expected middle of the pellet before being installed in the hot cell. The collimator can be removed by mean of guided table to be replaced by another one with different aperture dimensions. The vertical position of the collimator can also be corrected if needed.
• The collimation plug placed in the hot cell’s wall. It defines a 30 mm x 30 mm aperture through which the detector sights the sample in the furnace. It includes an alignment system which allows horizontal and vertical movements of the aperture
-5,00 -2,50 0,00 2,50 5,00 0 10 20 30 40 50 60 70 80 90 100 d e v ia ti o n o f th e 1 5 2E u p e a k s ( % )
Incoming count rate (kc.s-1)
121.8 keV 344.3 keV
axis to be co-aligned with the one of the pre-collimator. The collimation plug can also rotate on its axis for the horizontal alignment of the post-collimator.
• The post-collimator set is placed in the rear part of the cell and is supported by the collimation plug. It is composed of four independent tungsten alloy blocks. Three of them present a 30-mm wide aperture which heights are 2 mm, 5 mm and 10 mm respectively. The fourth does not exhibit any aperture and is used as a biological shielding during maintenance operations. The post-collimators are motorized by mean of a Newport/Microcontrol linear translation table driven by an XPS motion controller of the same producer. The selection of one post-collimator can be controlled either automatically by mean of the PEGASE2 software or manually with the linear table remote control.
• The fourth part, called “optical plug”, is a special system composed of a rotating plug fixed on the inner wall of the cell. It comports two discrete positions. The first is used during the experimental sequence and interposed a 1-mm thick stainless steel window to minimize gamma attenuation in the collimation axis. The second position comport a glass window to allow optical alignment of the independent parts of the collimation system placed inside and outside the cell.
• The last part of the collimation set is the biological shielding. It is composed of a lead block which thickness has been dimensioned to allow the presence of operators during experimentations, i.e. when an open post-collimator is selected. This lead block is supported by a mobile carriage to be completely independent of the collimation system.
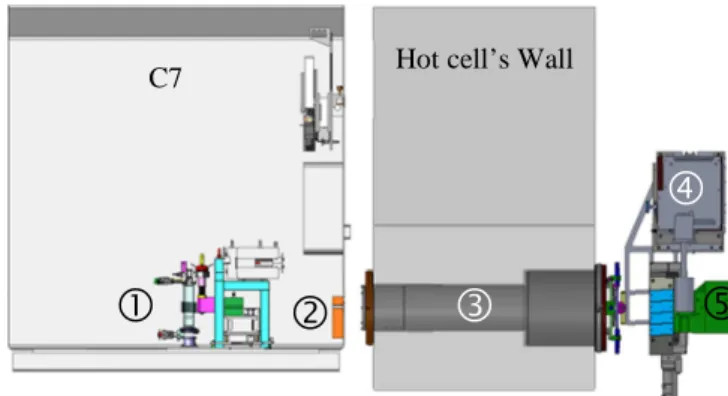
Fig. 2: new gamma spectrometry facility implemented in the C7 hot cell with: (1) the furnace and the pre-collimator (green), (2) the optical plug, (3) the collimation plug, (4) the detector and (5) the post-collimators (blue) and the biological shielding (green).
The different parts of the collimation system have been optically and mechanically aligned to ensure the collinearity of there axis. First, the axis of the pre-collimator and the
collimation plug have been aligned using a precision laser. This laser has been introduced in the collimation plug through an interface piece precisely adjusted. Thus, the laser reproduces the collimation plug axis and penetrates in the cell through the glass window of the optical plug. The axis of the collimation plug has then been aligned with the pre-collimator axis using its horizontal and vertical settings. Secondly, the axis of the post-collimator and the collimation plug have been mechanically aligned using an adjusted interface piece inserted in these two parts.
III. RESULTS AND DISCUSSION
A. Samples
A first set of two experiments has been performed on two fuel samples. They have been extracted from the same father fuel rod coming from PWR of the EDF’s nuclear power plants. These samples are both composed of two neighbor pellets kept in their original cladding.
B. Experimental sequence
The samples have been successively placed in the furnace crucible in order to be heated in conditions initially defined to differentiate the fission gas release mechanism. The experimental sequence consists in a first phase of thermal conditioning of the loop at 400°C followed by a succession of ramps and plateaus up to 1500°C. During the experimental sequence, the furnace has been swept by a mixture of argon and hydrogen. The gaseous fission products were led out of the cell and their release kinetics measured on the dedicated gamma spectrometry facility station and finally stored in capacities. Meanwhile the release kinetics of the volatile FP has been recorded by mean of the new on-line gamma spectrometer sighting the fuel sample in the furnace.
C. Gamma spectrometry measurement
Due to the total activity of each sample, only the wider post-collimator, i.e. 30 mm wide x 10 mm high, has been used and the total ICR rated 36 kc/s at the beginning of each experiment. Though this rate is relatively low it allows spectra measurement frequencies compatible with the fastest kinetics recorded (1 spectra per minute) that ensure satisfactory statistic error (about 10%) for radionuclides (RN) of interest. At the end of the thermal sequence, the remaining ICR rated 23 kc/s. The spectra duration were typically 300 s when no release was detected to reach 100 s and 60 s during fast transient and coming back to 300 s when the release stop.
During the test, PEGASE-2 pre-analyzes the spectra to calculate and plot on-line the released fraction of each detectable radionuclide of interest. This one uses the basic functions of Genie2000 to extract the surface of peaks contained in predetermined region of the spectra. A second post-test analyze is then processed using the home-made code LINA developed to unfold complex spectra from freshly irradiated fuel. It contains more specific functions to detect, unfold and correct gamma-ray lines included in the spectra. C7 Hot cell’s Wall
D. Results
The measurements of release kinetics are relative measurement; there is no need to quantitatively calibrate the gamma station. The determination of the released fraction is calculated as the ratio of the activity contained in the sample at the beginning and at each moment of the thermal sequence. Because no quantitative calibration is necessary, the activities of the RN of interest are followed by the count rate in their characteristic peaks (surface under the peak divided by the acquisition time).
In the case of the two first samples, only long-lived RNs have been measured. Two types of FPs have been followed: volatile and non-volatile. The first class of volatility is characterized by the behavior of two isotopes of the cesium, i.e. 134Cs and 137Cs. The cesium is well known as a volatile FP and is the most detectable RN in fuel spectra. It is thus the better tracer of the volatile FP release. The second class of volatility is characterized by the measurement of the 154Eu. Because it is a non-volatile FP, it is used to follow the change in the fuel sample like movements or collapse. Under nominal condition no change is expected in its signal, it can then be used to correct the release profile in case of fuel movement. The last RN that is followed is the 60Co which is not contained in the fuel but in a monitoring source placed near the detector. It is thus not characteristic of the fuel itself but can be used to monitor the proper functioning of the electronics. The 60Co signal should be constant as function of the ICR during the entire test attesting of the good dead time correction. It can be used to correct electronics drift.
The results of the two first experiments led on this new spectrometry facility are shown on the following Fig. 3. On the chart are simultaneously plotted: the thermal sequence and the gaseous and volatile FP releases respectively characterized by the 85Kr and the 137Cs profiles.
Fig. 3: simultaneous measurement of gaseous (85Kr) and volatile (137Cs)
FP release kinetic for the first sample.
IV. CONCLUSION
These first results show that this new gamma station properly works and its performances match the FP release kinetics requirements. The release profiles have been followed with frequencies fast enough to record the fast transient observed on the 137Cs signal. This new gamma station upgrades the MERARG loop capability to characterize the
fuel behavior by measuring the volatile FPs release kinetics simultaneously with the gaseous FPs. In the future, a quantitative correction of the volatile release profile will be applied using the gamma spectrometry bench also implemented in the C7 hot-cell.
REFERENCES
[1] Y. Pontillon et al. “ADAGIO technique: from UO2 fuels to MOX fuels”,
Journal of Nuclear Materials 385 (2009) 137-141.
[2] P. Menegon et al. “Evidence of two gas release kinetics during the oxidation of an irradiated PWR UO2 fuel”, Journal of Nuclear Materials
378 (2008) 1-8.
[3] Y. Pontillon et al. “Increasing of MERARG experimental performances: online fission gas release measurement by mass spectrometry”, paper #93 – ANIMMA International conference, 20-24 April 2015, Lisboa, Portugal.
[4] G. Ducros et al., “Use of gamma spectrometry for measuring fission product releases during a simulated PWR severe accident: application to the VERDON experimental program”, Paper #107 – ANIMMA International Conference, 7-10 June 2009, Marseille France
[5] G. P. Westphal, "Real-time correction of counting losses o, nuclear pulse spectroscopy," Journal of Radioanalytical Chemistry, vol. 70, no. 1-2, pp. 387-410, 1982.
[6] CANBERRA user’s Manual - Model 599 – Loss Free Counting Module [7] G. Gilmore, “Practical gamma-ray spectrometry”, Second edition, John
Wiley & Sons, 2008, pp. 292-293.
0 200 400 600 800 1000 1200 1400 1600 0 20 40 60 80 100 120 140 160 180 200 220 240 T e m p e ra tu re ( °C ) R e le a s e d f ra c ti o n ( A U )
Elapsed time (minute)
Released 85Kr Released 137Cs Temperature
137Cs