HAL Id: inserm-00864642
https://www.hal.inserm.fr/inserm-00864642
Submitted on 28 Mar 2014HAL is a multi-disciplinary open access archive for the deposit and dissemination of sci-entific research documents, whether they are pub-lished or not. The documents may come from teaching and research institutions in France or abroad, or from public or private research centers.
L’archive ouverte pluridisciplinaire HAL, est destinée au dépôt et à la diffusion de documents scientifiques de niveau recherche, publiés ou non, émanant des établissements d’enseignement et de recherche français ou étrangers, des laboratoires publics ou privés.
Genetic relationship between five psychiatric disorders
estimated from genome-wide SNPs.
Hong Lee, Stephan Ripke, Benjamin Neale, Stephen Faraone, Shaun Purcell,
Roy Perlis, Bryan Mowry, Anita Thapar, Michael Goddard, John Witte, et al.
To cite this version:
Hong Lee, Stephan Ripke, Benjamin Neale, Stephen Faraone, Shaun Purcell, et al.. Genetic relation-ship between five psychiatric disorders estimated from genome-wide SNPs.. Nature Genetics, Nature Publishing Group, 2013, 45 (9), pp.984-94. �10.1038/ng.2711�. �inserm-00864642�
Genetic relationship between five psychiatric disorders estimated from genome-wide SNPs
Cross-Disorder Group of the Psychiatric Genomics Consortium Correspondence to
Naomi R. Wray
The University of Queensland, Queensland Brain Institute, Brisbane, QLD, 4067 Australia. naomi.wray@uq.edu.au
Summary paragraph
Most psychiatric disorders are moderately to highly heritable. The degree to which genetic variation is unique to individual disorders versus shared across disorders is unclear. We use genome-wide genotype data from the Psychiatric Genomics Consortium (PGC) of cases and controls for schizophrenia (SCZ), bipolar disorder (BPD), major depressive disorder (MDD), autism spectrum disorders (ASD), and attention deficit hyperactivity disorder (ADHD). We apply univariate and bivariate methods for estimation of genetic variation within and covariation between disorders. SNPs explained 17-29% of the variance in liability. The genetic correlation calculated from common SNPs is high for SCZ/BPD (0.68±SE 0.04), moderate for SCZ/MDD (0.43±0.06), BPD/MDD (0.47±0.06), ADHD/MDD (0.32±0.07), low between SCZ/ASD (0.16±0.06), and non-significant for other pairs of disorders as ell as ith the negati e ontrol of Crohn’s Disease. This empirical evidence for a shared genetic etiology between psychiatric disorders can inform nosology and encourages investigation of common pathophysiologies for the related disorders.
Text
Current classification of psychiatric disorders reflects clinical syndromes with largely unknown etiology and is based on historical descriptions provided by prominent clinicians over the last 125 years. Family (including twin and adoption) studies provide consistent evidence that genetic factors are involved in these syndromes1. In principle, family studies allow quantification of shared genetic etiology, through estimation of heritability (the proportion of variance in liability attributable to additive genetic factors) of disorders and the genetic correlation between them. However, difficulties in ascertaining samples of sufficient size mean that estimates of genetic correlations are few. Nonetheless, family studies suggest correlated familial-genetic liabilities to BPD and SCZ2,3, BPD and MDD2,3 and ASD and ADHD4-6 (Supplementary Table 1). Phenotypic and genetic overlap has also been suggested for ASD and SCZ7-11, ASD and BPD9, BPD and ADHD12 and MDD and ADHD13
.
Some of these relationships have been supported by recent evidence of shared molecular risk factors14-16, but the extent of these relationships remains unclear given the small proportion of risk associated with these individually identified variants.The genomics era provides new opportunities to explore the shared genetic etiology of disorders. Genome-wide association studies (GWAS) assess common genetic polymorphisms (e.g., SNPs) at several hundred thousand positions in the genome. The experimental paradigm of GWAS is identification of individual variants associated with case-control status17. However, these data can be used to estimate the total variance in liability explained
“NPs “NP-herita ilit , SNP-h2
) through estimation of genetic similarities (relationships) between cases and controls using SNP genotypes18,19. The pair-wise genetic relationships that contribute to the estimate are very small, but the large number of pairwise relationships in a case-control sample generates estimates with reasonable precision. The
SNP-h2 is an estimate of the total variance in liability to disease explained by the SNPs together. Genetic variation is estimated when case-case pairs and control-control pairs are, on average, more similar genome-wide than case-control pairs. The SNP-h2 is a lower bound for the total narrow sense heritability, as the former cannot include contributions from causal variants not tagged by the measured SNPs, mostly less common and rare causal variants. A bivariate extension20 of these genome-wide methods estimates the genetic correlation (SNP-rg) explained by SNPs between case-control samples collected independently for two disorders (see online Methods). The correlation is positive when the cases of one disorder show higher genetic similarity to the cases of the other disorder than to their controls. A negative correlation is possible if the cases of one disorder are less similar genome-wide to the cases of the other disorder than they are to controls. A genetic correlation of zero is estimated if the genome-wide relationship between cases of one disorder is the same with cases as with controls of the other disorder. As a correlation, a high SNP-rg is achieved when the covariance term between the traits is similar in magnitude to the variance terms. Therefore, we also report the SNP-coheritability between pairs of disorders, which is the covariance between disorders on the liability scale and allows comparison of the shared liability attributable to SNPs on the same scale as the SNP-h2. Here, we apply the univariate and bivariate methods to the five disorders of the PGC: SCZ21, BPD22, MDD23, ASD24,25 and ADHD26 analysed in the PGC cross-disorder group association study25, together with additional ADHD data sets27-30 (Table 1).
RESULTS
SNP-heritabilities for the five disorders
In our linear mixed model we estimate the variance in case-control status explained by SNPs18 (heritability on the observed scale, CC in Table 1). Cases in case-control samples are highly ascertained compared to in the population, and since the different disorder cohorts
have different proportions of cases, the CC estimates are difficult to interpret and compare. For this reason, we report SNP-h2 on the liability scale, in which a linear transformation18 is applied based on a user-specified estimate of the disorder risk of the study-base population (disorder risk, K). For each disorder we consider three values of K (Table 1) and we convert the SNP-h2 to a predicted risk to 1st-degree relatives (SNP-1st) given K. We benchmark the
SNP-1st risk to risk to 1 st
-degree relatives (1st) consistent with estimates of heritabilities
reported from family studies given K. Our estimates of SNP-1st are robust, and of SNP-h
2 are reasonably robust, to the likely range of K and show that an important part of the heritabilities or familial risk estimated from family studies are associated with common SNPs. Twice the standard error of estimates approximates the magnitude of parameter that is possible to detect as significantly different from zero given the available sample sizes31.
SNP-coheritabilities and SNP-correlations (SNP-rg) between all pairwise combinations of disorders
The relationships between disorders are expressed as coheritabilities (Fig. 1). The SNP-rg is high for SCZ/BPD 0.68 (s.e. 0.04), moderate for SCZ/MDD 0.43 (0.06), BPD/MDD 0.47 (0.06), ADHD/MDD 0.32 (0.07), low between SCZ/ASD 0.16 (0.06), and non-significant for other pairs of disorders (Supplementary Table 1). The SNP-rg correlation is expected to be equal to the rg from family studies only if the genetic correlation is the same across the allelic frequency spectrum and if the linkage disequilibrium between genotyped and causal variants is similar for both disorders. The sample size for ASD is the smallest but still can detect correlations of > |0.18| to be different from zero in bivariate analyses with all other disorders.
Our results provide empirical evidence that SCZ, BPD and MDD have a shared genetic etiology. Since some SCZ and BPD cohorts were collected in the same clinical environments,
we investigated possible impact of non-independent collection of SCZ/BPD samples sets but found no significant change in the estimates (Supplementary Table 2). The correlation between SCZ and ASD is significant but small (0.16 s.e. 0.06, p = 0.0071). In general, our analyses suggest that while common genetic variants contribute to both childhood-onset disorders (ASD, ADHD) and disorders usually diagnosed after childhood (SCZ, BPD, MDD), the sharing of common variants between them is modest.
The pattern of our results (i.e., which pairs of disorders demonstrate genetic overlap) is consistent with the polygenic profile score32 results from the PGC cross-disorder analyses25. The profile score method uses SNP associations from one disorder to construct a linear predictor in another disorder. The profile scores explained small but significant proportions of the variance25, e pressed as Nagelkerke’s R2 (maximum of 2.5% between SCZ and BPD). To achieve a high R2 requires accurate estimation of effect sizes of individual SNPs and depends on the size of the discovery sample. In contrast, our approach uses SNPs to estimate genome-wide similarities between pairs of individuals, resulting in unbiased estimates of the relationships between disorders, with larger sample sizes generating smaller standard errors of the estimates. Our estimates are on the liability scale, allowing direct comparison to genetic parameters estimated in family studies, whereas a genetic i terpretatio of Nagelkerke’s R2
is less straightforward33.
Genomic partitioning of SNP-heritabilities and SNP-coheritabilities
The heritabilities explained by SNPs can be partitioned according to SNP annotation by estimation of genetic similarity matrices from multiple, non-overlapping SNP sets. For the five disorders, and the five disorder pairs showing a significant SNP correlation, we partitioned the SNP-h2 and SNP-coheritabilities explained by functional annotation, allocating SNPs to one of three sets: i) in genes preferentially expressed in the central nervous system (CNS+)34,35, ii) in other genes and iii) not in genes, with genes defined with
50kb boundaries from their start/stop positions. The SNPs in the CNS+ gene set represented 0.20 of the total set, both in number and megabases. However, the proportion of the variance explained by SNPs attributable to this SNP set is significantly greater than 0.20 for SCZ (0.30, p = 7.6 e-08) and BPD (0.32,p = 5.4e-06) and for the SCZ/BPD coheritability (0.37, p = 8.5e-08, Fig. 2, Supplementary Table 3). For other disorders or pairs of disorders, the estimates explained by CNS+ SNPs do not differ from chance expectation (Supplementary Table 3), although their large standard errors suggest we cannot address this question with precision. For the SCZ/BPD data we also partitioned the heritabilities explained by SNPs by minor allele frequency (MAF) (Supplementary Table 4) and by chromosome (Supplementary Figure 1). The high standard errors on estimates limits interpretation; but the results are consistent with a polygenic architecture of many common variants of small effect dispersed throughout the genome. The MAF partitioning suggests that an important part of the variance explained by SNPs is attributable to common causal variants (this was investigated in detail for SCZ35), but the low contribution to the total variance explained from SNPs with MAF < 0.1 reflects, at least in part, under-representation of SNPs with low MAF in the analysis (minimum MAF = 0.01) relative to those present in the genome.
Within disorder heterogeneity
In order to benchmark the estimates of genetic sharing across disorders, we estimated sharing between data sub-sets of the same disorder. We split the data for each disorder into 2 or 3 independent sets and estimated the SNP-h2 from each subset, and the
SNP-coheritability between each pair of subsets within a disorder (Fig. 3a, Supplementary Table 5). The estimates of SNP-h2 from the data sub-sets are typically higher than the SNP- h2 from the combined sample; we note that published estimates from individual cohorts of BPD18, MDD36 and ASD37 were also higher. Since both traits in these data sub-set bivariate analyses are from the same disorder, the SNP-coheritability is also an estimate of the SNP-
h2 for the disorder, but these are generally lower than the estimates of SNP-heritability from individual data sub-sets. These results generate SNP-correlations that are less than one, and sometimes significantly so (Supplementary Table 5). The SCZ/BPD SNP correlation (0.68 s.e. 0.04) is of comparable magnitude as the SNP-correlations between BPD data sets (0.63 s.e. 0.11, 0.88 s.e. 0.09 and 0.55 s.e. 0.10 ; Fig 3a,b for SNP coheritabilities), adding further weight to the conclusion that SCZ and BPD may be part of the same etiological spectrum.
The estimates of heritability from both univariate (Fig. 3a red/pink bars) and bivariate analyses (Fig. 3a blue bars) are more heterogeneous for BPD, MDD and ADHD than for SCZ and ASD. Several reasons could explain why SNP-heritabilities from univariate analyses of a single data set could generate higher estimates than from bivariate analyses of independent data sets35, including loss of real signal or dilution of artefacts. Loss of real signal may occur because individual cohorts are more homogeneous, both phenotypically (e.g., use of the same assessment protocols), and genetically (e.g. because linkage disequilibrium (LD) between causal variants and analyzed SNPs might be higher within than between cohorts). On the other hand, artefacts could generate consistent differences in case vs control genotypes within case-control data sets. In the derivation of our methodology18, we
emphasised that any factors making SNP genotypes of cases more similar to other cases, and controls more similar to controls, will produce SNP-heritability. The fitting as covariates of principal components derived from the SNP data corrects both for population stratification and for genotyping artefacts, but residual population stratification38 could remain, although this bias should be small38,39. Partitioning SNP-heritability by chromosome in analyses where each chromosome is fitted individually compared to analyses where all chromosomes are fitted jointly is an empirical strategy to assess residual stratification35,40 and we find no such evidence here (Supplementary Figure 1). Stringent QC helps (as applied here) to remove artefacts, but artefactual differences between cases and controls may remain, particularly
for data sets in which cases and controls have been genotyped independently41. As more data sets accumulate, the contributions from artefacts are diluted since the random
directional effects of artefacts (including population stratification) are not consistent across data sets. For this reason, significant SNP-coheritabilities are unlikely to reflect artefacts and provide a lower bound on SNP-heritability.
Pseudo-controls
One strategy adopted in GWAS to guard against artefacts of population stratification is to genotype trio samples (cases and their parents) and then analyse the data as a case-control sample with controls generated as ge o i o ple e ts of the ases i.e.
pseudo-o trpseudo-ols . The ADHD su set a d pseudo-ost pseudo-of the A“D sa ple are pseudo-o prised pseudo-of ase-pseudpseudo-o control samples and, consistent with limiting the impact of artefacts from population stratification or genotyping, it is noted that the lowest SNP-heritability of the 5 psychiatric disorders is for ASD and that the estimate of SNP-heritability is lower for ADHD subset 1 than for ADHD subset 2. However, under a polygenic model, assortative mating42 or preferential ascertainment of multiplex families could diminish the expected mean difference in liability between pseudo-controls and cases37, which would result in an underestimation of SNP-heritability from case/pseudo-control compared to case/control analyses and also non-zero estimates of SNP-heritability from pseudo-control/control analyses as shown in analysis of ASD data37.
Negative control – SNP- oherita ilities ith Crohn’s Disease
As a negative control analysis, we conducted bivariate analyses between each of the PGC data sets ith Croh ’s Disease CD fro the International IBD Genetics Consortium (IIBDGC)43. While onset of MDD is not uncommon after diagnosis with CD44, and while gastrointestinal pathology is commonly comorbid with ASD45, there is no strong evidence of
a familial relationship between psychiatric disorders and CD. Despite a substantial SNP-h2 for CD (0.19 s.e. 0.01), none of the SNP-coheritabilities with the psychiatric disorders differed significantly from zero (Fig. 3c, Supplementary Table 6, Supplementary Note). Lastly, the genomic partitioning by annotation of variance in CD explained by SNPs showed, as expected, no excess of variance attributable to SNPs in the CNS+ gene set (Fig. 2). Our results provide no evidence for common genetic pleiotropy between CD and ASD consistent with a non-genetic e.g. microbial47 explanation for the comorbid gastrointestinal symptoms in ASD.
Potential impact of misclassification of disorders
Misclassification between disorders could inflate estimates of genetic correlation/ coheritability48. Indeed, some level of misclassification between psychiatric disorders is expected. For example, longitudinal studies4950 of first admissions with psychosis based on research interviews showed that with long term follow-up ~15% of subjects initially diagnosed with bipolar disorder were re-diagnosed with schizophrenia while ~4% of schizophrenia diagnoses were re-classified as bipolar disorder. Cases selected for GWAS contributing to PGC to date are more likely to have achieved a stable diagnosis compared to first admission cases. However, assuming these levels of misclassification, the genetic correlation between BPD a d “C) of true diag oses is still high, esti ated48 to be 0.55. Likewise, since a modest proportion of cases diagnosed with MDD followed over time ultimately meet criteria for BPD51 our estimated genetic correlation between these two disorders may be modestly inflated by misclassification. On the other hand, if moderate to high genetic correlations between the major adult disorders are true, then overlapping symptoms and misdiagnosis between disorders might be expected. The SNP-rg between SCZ and MDD also is unlikely to reflect misdiagnosis since misclassification between these disorders is rare51. Excluding the five of the 18 PGC-SCZ cohorts containing schizoaffective
disorder cases21 (Supplementary Table 7) or MDD cohorts ascertained from community rather than clinical settings (Supplementary Table 8) had little impact on the SNP-rg estimates .
DISCUSSION
Our results show direct, empirical, quantified, molecular evidence for an important genetic contribution to the five major psychiatric disorders. The SNP-h2 estimates for each disorder: SCZ 0.21 (s.e. 0.02), BPD 0.25 (s.e. 0.01), MDD 0.21 (s.e. 0.01), ASD 0.14 (s.e. 0.02), ADHD 0.32 (s.e. 0.02) are considerably less than the heritabilities estimated from family studies (see Table 1). Yet they show that common SNPs make an important contribution to the overall variance, implying that additional individual common SNP associations can be
discovered as sample size increases52. SNP- h2 are a lower bound of narrow sense heritability because they exclude contributions from some causal variants (mostly rare variants) not associated with common SNPs. Although the SNP-heritability estimate is similar for MDD as for other disorders, much larger sample sizes will be needed because the high disorder risk implies lower power for the same sample size53. The SNP- h2 are all lower than those reported for height (0.45 s.e. 0.03)40 but the estimates are in the same ball-park to those reported for other complex traits and diseases using the same QC pipeline, such as BMI (0.17 s.e. 0.03)40, Alzhei er’s Disease . s.e. . , ultiple s lerosis . s.e. . a d endometriosis (0.26 s.e.0.04)41.
Our results show molecular evidence for the sharing of genetic risk factors across key psychiatric disorders. Traditionally, quantification of the genetic relationship between disorders has been thwarted by the need for cohorts of families or twins assessed for multiple disorders. Problems of achieving genetically informative samples of sufficient size and without associated ascertainment biases for the rarer psychiatric disorders have meant that few studies have produced meaningful estimates of genetic correlations. Importantly,
our estimates of heritability and genetic correlation are made using very distant genetic relationships between individuals, both within and between disorders, so that shared environmental factors are unlikely to contaminate our estimates. Likewise, our estimates are unlikely to be confounded by additive genetic effects, since the coefficients of non-additive genetic variance between very distant relatives are negligible54.
The estimates of SNP-genetic correlation (SNP-rg) between disorders reflect genome-wide pleiotropy of variants tagged by common SNPs and whether these are the same as correlations across the allelic frequency spectrum may differ between disorder pairs. For example, a high SNP-rg but a low genetic correlation estimated from family studies (rg) could reflect that the same common variants contribute to the genetic susceptibility of both disorders, while the diagnostic-specific variants are less common variants. For this reason, the comparison of SNP-rg with rg estimated from family studies is not
straightforward. Nonetheless we benchmark our estimates in this way, calculating the increased risk of disorder B in first-degree relatives of probands with disorder A (A,B fro
the SNP-rg to allow comparison with literature values (Supplementary Table 1). A
meta-analysis55 reported the increased risk of BPD in first-degree relatives of SCZ probands
compared to first-degree relatives of control probands ( BP to e . , hi h i plies a
maximum genetic correlation between them of 0.3 (assuming that the disorder risks for SCZ and BPD are both 1%, and their heritabilities are 81% and 75%, Table 1). However, a large-scale Swedish family and adoption study56 estimated the genetic correlation between SCZ and BPD to be +0.60, similar to that found here. Profiling scoring analyses using genome-wide SNPs32 was the first to demonstrate clearly a genetic relationship based on molecular data, but quantification as a genetic correlation was not reported. The evidence of shared genetic risk factors for SCZ and BPD was strengthened by our analyses of the CNS+ gene set where we saw a clear enrichment in variants shared by these two disorders.
Our finding of a substantial SNP-rg of +0.43 between SCZ and MDD is intriguing and contrary to conventional wisdom about the independence of familial risk for these disorders. However, since MDD is common, even a high genetic correlation implies only modest
incremental risk. Assuming that the disorder risks and heritabilities for SCZ and MDD in Table 1, then a the genetic correlation between them of 0.43 predicts an increased risk of MDD in first-degree relatives of SCZ probands compared to first-degree relatives of control probands ( of . . I fa t, eta-analysis of five studies interview-based research
studies of families are broadly consistent with our results ( = 1.5, 95% CI 1.2-1.8, Supplementary Table 9), suggesting that familial coaggregation of MDD and SCZ reflects genetic effects rather than a consequence of living in a family environment that includes a severely ill family member. If replicated by future work, our empirical molecular genetic evidence of a partly shared genetic etiology for SCZ and MDD has important nosological and research implications, placing MDD as part of a broad psychiatric genetic spectrum. A shared genetic etiology between BPD and MDD has been shown in family studies2,3 but the SNP-rg
of 0.47 is lower than the estimate of 0.65 from a twin study57.
Our results show a small but significant SNP-rg between SCZ and ASD. A lower genetic correlation between SCZ and ASD than between SCZ and BPD is consistent with the Swedish national epidemiological studies which reported higher odds ratios in siblings between SCZ and BPD56 than between SCZ and ASD9. These results imply a modest overlap of common genetic etiologic processes in these two disorders consistent with emerging evidence from discovery of copy number variants where both shared variants (e.g 15q13.3, 1q2.1 and 17q12 deletions58,59) and same gene but different variants (deletions associated with schizophrenia and duplications associated with autism, and vice versa10) have been reported. The small ASD sample size thwarted attempts of further explorative partitioning of the SNP coheritability between SCZ and ASD.
The lack of overlap between ADHD and ASD is surprising and not consistent with family and data linkage studies, which indicate that the two disorders share genetic risk factors5,6,60,61. Some rare copy number variants are seen in both disorders16. As noted above, the use of pseudo-controls for many of the ASD and ADHD cohorts may impact on all results for these disorders. Ideally we would investigate the impact of pseudo-controls given the hierarchical diagnostic system (autism, but not autism spectrum is an exclusion criterion for most ADHD data sets) on estimates of the SNP-coheritability, but the small ASD sample size prohibits such analyses. We also found no overlap between ADHD and bipolar disorder despite meta-analytic support for an increased risk for ADHD in relatives of BPD I (a subtype of BPD with more extreme manic symptoms than the other major BPD subtype) patients and an increased risk for BPD I in relatives of ADHD patients 12. This could mean that the familial link between the two disorders is mediated by environmental risk factors or that the shared genetic factors are not part of the common allelic spectrum. Alternatively, the etiologic link between ADHD and BPD might be limited to BPD I or early onset BPD12 which therefore is difficult for us to detect. Our finding of genetic overlap between ADHD and MDD is consistent with evidence from studies showing increased rates of ADHD in families of depressed probands and increased rates of depression in families of ADHD probands 12,13.
Our results should be interpreted in the context of four potentially important methodological limitations. First, any artefacts, that make SNP genotypes more similar between cases than between cases vs. controls could inflate estimates of SNP-heritability18, but to a much lesser extent SNP–coheritability. Second, the sample sizes varied considerably across the five disorders. Although the SNP-h2 are expected to be unbiased, estimates from smaller samples are accompanied by larger standard errors, blurring their interpretation. Third, while applying similar diagnostic criteria, the clinical methods of ascertainment and the specific study protocols, including which specific interview instruments were employed, varied across sites. We cannot now determine the degree to which our results might have
been influenced by the between-site differences in the kinds of patients seen or in their assessments. Fourth, by combining samples from geographical regions, contributions from less common associated variants specific to populations are diluted compared to what could be achieved if the same sample size had been ascertained from a single homogeneous population.
In summary, we report SNP-heritabilities that are significantly greater than zero for all five disorders studied. We have used the largest psychiatric GWAS data sets currently available and our results provide important pointers for future studies. Our results demonstrate that the dearth of significant associations from psychiatric GWAS to date, particularly for MDD, ASD and ADHD, reflects lack of power to detect common associated variants of small effect rather than absence of such variants. Hence as sample sizes increase the success afforded to other complex genetic diseases52 in progressing understanding of their etiology is achievable for psychiatric disorders, as already being shown for SCZ62. We also pro ide e ide e for a su sta tial shari g of the ge eti risk aria ts tagged these SNPs for SCZ/BPD, BPD/MDD, SCZ/MDD, ADHD/MDD and, to a lesser extent, SCZ/ASD. Our results will likely contribute to efforts now underway to base psychiatric nosology on a firmer empirical footing. Furthermore, they will encourage investigations into shared pathophysiologies across disorders including potential clarification of common therapeutic mechanisms.
Note: Supplementary information is available on the Nature Genetics website.
Acknowledgements
This research was directly supported by the Australian Research Council
(FT0991360, DE130100614) and the Australian National Health and Medical
Research Council (613608, 1011506, 1047956). The PGC-CDG is supported by
NIMH grant U01 MH085520. Statistical analyses were carried out on the Genetic
Cluster Computer (http://www.geneticcluster.org) which is financially supported by
the Netherlands Scientific Organization (NWO 480-05-003 PI Posthuma) along with
a supplement from the Dutch Brain Foundation and the VU University Amsterdam.
Numerous (>100) grants from government agencies along with substantial private and
foundation support world-wide enabled the phenotype and genotype data collection
without which this research would be not be possible; the grants are listed in the
primary PGC publications or in the Supplementary Note.
Author Contributions
Project Conception: KSK, NRW, JWS. Analysis: SHL, NRW. Writing of manuscript: NRW, SHL, KSK, SVF. QC of PGC data: S Ripke, BMN. Revisions to the manuscript: SMP, JWS, RHP, BJM, PFS, AT, CO’D, MJD, RDO, JB. Statistical advice: MEG, JSW. Data access: DP. PGC-CDG Workgroup Chairs: MJD (Analysis), SVF (ADHD), MJD, BD chairs ASD), JK, P Sklar (co-chairs BPD), PFS (MDD), MCO’D (SCZ). Collection, genotyping and analysis of Psychiatric Genomics Consortium Working Groups: PGC-ADHD Working Group: BMN, SVF, AT, RA, PA, TB, M Bayés, JB, JKB, MC, BC, JC, AED, RPE, JE, BF, CMF, L Kent, JK, K-PL, SKL, JJMcG, SEM, JMS, AM, SFN, RDO, JAR-Q, A Reif, M Ribasés, HR, A Rothenberger, JAS, RS, SL Smalley, EJSS-B, H-CS, AAT, NW. PGC-ASD Working Group: RA, DEA, AJB, AB, CB, JD Buxbaum, A Chakravarti, EHC, HC, MLC, GD, ED, SE, EF, CMF, L Gallagher, DHG, M Gill, DEG, JLH, HH, JH, VH, SMK, L Klei, DH Ledbetter, C Lord, JKL, EM, SMM, CLM, WMMcM, APM, DM-D-L, EMM, M Murtha, GO, AP, JRP, ADP, MAP-V, J Piven, FP, K Rehnström, K Roeder, GR, SJS, S Cichon, GDS, SWS, M State, J Sutcliffe, P Szatmari, AMV, VJV, CAW, THW, EMW, AJW, TWY, BD, MJD. PGC-BPD Working Group: SMP, DA, HA, OAA, AA, LB, JAB, JD Barchas, TBB, NB, M Bauer, FB, SEB, WB, DHRB, CSB, M Boehnke, GB, R Breuer, WEB, WFB, S Caesar, K Chambert, S Cichon, DAC, A Corvin, WHC, DWC, RD, F Degenhardt, S Djurovic, F Dudbridge, HJE, BE, AEF, INF, M Flickinger, TF, JF, CF, LF, ESG, M Gill, KG-S, EKG, TAG, DG, WG, HG, MLH, M
Hautzinger, S Herms, M Hipolito, PAH, CMH, SJ, EGJ, IJ, LJ, R Kandaswamy, JLK, GKK, DLK, PK, M Landén, NL, M Lathrop, J Lawrence, WBL, M Leboyer, PHL, J Li, PL, D-YL, C Liu, FWL, SL, PB Mahon, WM, NGM, M Mattheisen, KM, M Mattingsdal, KAMcG, PMcG, MGMcI, AMcI, RMcK, AWM, FJMcM, AMcQ, SM, IM, FM, GWM, JLM, GM, DWM, V Moskvina, P Muglia, TWM, WJM, BM-M, RMM, CMN, IN, VN, MMN, JIN, EAN, CO'D, UO, MJO, BSP, JBP, PP, EMQ, S
Raychaudhuri, A Reif, JPR, M Rietschel, D Ruderfer, M Schalling, AFS, WAS, NJS, TGS, J Schumacher, MS, ES, LJS, PDS, ENS, DStC, M Steffens, JSS, J Strohmaier, S Szelinger, RCT, FT, JT, JBV, SJW, TFW, SHW, WX, AHY, PPZ, PZ, S Zöllner, JRK, P Sklar, MJD, MCO'D, NC. PGC-MDD Working Group: MRB, TB, EBB, DHRB, DIB, GB, R Breuer, S Cichon, WHC, IWC, D Czamara, EJCGD, F Degenhardt, AEF, JF, SDG, M Gross, SPH, ACH, AKH, S Herms, IBH, S Cichon, FH, WJH, J-JH, MI, IJ, LJ, TJ-Y, JAK, MAK, A Korszun, WBL, DFL, CML, D-YL, SL, DJMacI, PAFM, WM, NGM, M Mattheisen, PJMcG, PMcG, AMcI, AWM, CMM, LM, GWM, P Muglia, BM-M, WAN, MMN, DRN, BWP, MLP, JBP, M Rietschel, WAS, TGS, J Shi, SIS, SL Slager, JHS, M Steffens, FT, JT, MU, EJvdO, GV, MMW, GW, FGZ, PFS, NRW. PGC-SCZ Working Group: S Ripke, BMN, SMP, BJM, IA, FA, OAA, MHA, NB, DWB, DHRB, R
Bruggeman, NGB, WFB, WC, RMC, K Choudhury, S Cichon, CRC, A Corvin, D Curtis, S Datta, S Djurovic, GJD, JD, F Dudbridge, AF, RF, NBF, M Friedl, PVG, L Georgieva, IG, M Gill, HG, LdH, MLH, TFH, AMH, PAH, CMH, AI, A Kahler, RSK, MCK, EK, YK, GKK, BK, L Krabbendam, R Krasucki, J Lawrence, PHL, TL, DFL, JAL, D-YL, DH Linszen, PKEM, WM, AKM, M Mattheisen, M Mattingsdal, SMcC, AMcI, AMcQ, HM, IM, V Milanova, DWM, V Moskvina, IM-G, MMN, CO'D, AO, LO, RAO, MJO, CNP, MTP, BSP, J Pimm, DP, VP, DJQ, HBR, M Rietschel, LR, D Ruderfer, D Rujescu, ARS, TGS, J Shi, JMS, DStC, TSS, ST, JV, PMV, TW, DW, S Zammit, P Sklar, MJD, MCO'D, NC, PFS, KSK. PGC-CDG Working Group: SHL, S Ripke, BMN, SMP, RHP, AT, AF, MCN, JIN, BWP, M Rietschel, S Cichon, TGS, NC, PFS, JWS, KSK, NRW. PGC-Analysis Working Group: SHL, S Ripke, BMN, SMP, VA, EMB, PHL, SEM, MCN, DP, MJD, NRW COMPETING FINANCIAL INTERESTS
Figure 1. Evidence for genome-wide pleiotropy between psychiatric disorders. a.
Proportion of variance in liability (SNP-heritability), and proportion of covariance in liability between disorder (SNP-coheritability) for 5 major psychiatric disorders. 95% error bars are estimate
±
1.96 standard error.Figure 2 Genomic partitioning of SNP-heritability/SNP-coheritability by annotation.
Proportion of SNPs attributable to genes in CNS+ set (red bar), proportion of SNP-heritability explained by SNPs attributed to SNPs in CNS+ set (dark green bar), proportion of SNP-coheritability attributed to SNPs in CNS+ set (light green bar), proportion of SNP-heritability for Croh ’s Disease attri uted to “NPs i CN“+ set ora ge bar). 95% error bars are estimate
±
1.96 standard error. *** p< 10 -5from test that proportion of heritability explained by SNPs = proportion of SNPs.
Figure 3 SNP-heritabilities and coheritabilities. a) For each disorder the SNP-heritabilities are estimated from univariate analyses of the full data set (dark green bars) or from subsets (red/pink bars). They are also estimated from bivariate analyses in which different subsets of the same disorder comprise the two traits (blue bars). Test of heterogeneity of estimates,
p-alue for Co hra e’s Q, “C): . , BPD: 1x10⁻⁶
, MDD: 4 x10⁻³, ADHD: 9x10⁻⁶, A“D: . Higgi s’ I2, SCZ: 21%, BPD: 86%, MDD: 71% ADHD: 91% ASD:0 b) For comparison the coheritabilities using the full data sets from Figure 1. c) As a negative control, estimates of coheritabilities
ith Croh ’s Disease CD , a disease ot e pe ted to e ge eti all related to ps hiatri disorders. 95% error bars are estimate
±
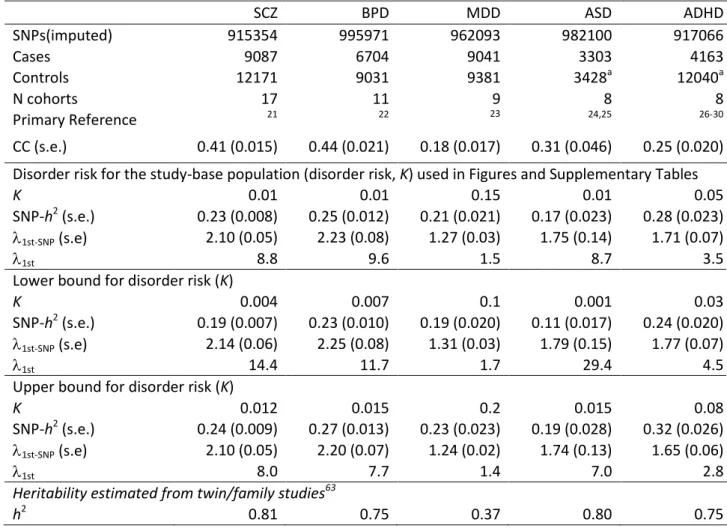
1.96 standard error.Table 1. Univariate analyses: sample description, SNP-heritabilities and recurrence risk to first-degree relatives SCZ BPD MDD ASD ADHD SNPs(imputed) 915354 995971 962093 982100 917066 Cases 9087 6704 9041 3303 4163 Controls 12171 9031 9381 3428a 12040a N cohorts 17 11 9 8 8 Primary Reference 21 22 23 24,25 26-30 CC (s.e.) 0.41 (0.015) 0.44 (0.021) 0.18 (0.017) 0.31 (0.046) 0.25 (0.020) Disorder risk for the study-base population (disorder risk, K) used in Figures and Supplementary Tables
K 0.01 0.01 0.15 0.01 0.05
SNP-h2 (s.e.) 0.23 (0.008) 0.25 (0.012) 0.21 (0.021) 0.17 (0.023) 0.28 (0.023)
1st-SNP (s.e) 2.10 (0.05) 2.23 (0.08) 1.27 (0.03) 1.75 (0.14) 1.71 (0.07)
1st 8.8 9.6 1.5 8.7 3.5
Lower bound for disorder risk (K)
K 0.004 0.007 0.1 0.001 0.03
SNP-h2 (s.e.) 0.19 (0.007) 0.23 (0.010) 0.19 (0.020) 0.11 (0.017) 0.24 (0.020)
1st-SNP (s.e) 2.14 (0.06) 2.25 (0.08) 1.31 (0.03) 1.79 (0.15) 1.77 (0.07)
1st 14.4 11.7 1.7 29.4 4.5
Upper bound for disorder risk (K)
K 0.012 0.015 0.2 0.015 0.08
SNP-h2 (s.e.) 0.24 (0.009) 0.27 (0.013) 0.23 (0.023) 0.19 (0.028) 0.32 (0.026)
1st-SNP (s.e) 2.10 (0.05) 2.20 (0.07) 1.24 (0.02) 1.74 (0.13) 1.65 (0.06)
1st 8.0 7.7 1.4 7.0 2.8
Heritability estimated from twin/family studies63
h2 0.81 0.75 0.37 0.80 0.75
SCZ: schizophrenia, BPD: bipolar disorder, MDD: major depressive disorder, ASD: autism spectrum disorders, ADHD: attention deficit hyperactivity disorder. CC=SNP-heritability estimated on case-control scale. SNP-h2 SNP-heritability on liability scale given assumed K. All estimates of SNP-
h
2 are highly significantly different from zero.1st-SNP recurrence risk tofirst degree relatives calculated from SNP-h2 liabilityand K. 1st recurrence risk to first
degree relatives calculated from h2 from twin/family studiesand K . a) some cohorts include cases and pseudo-controls where pseudo-controls are the genomic complements of the cases derived from genotyping of proband-parent trios.
Methods
Data & quality control (QC)
A summary of the data available for analysis is listed in Table 1 and comprise data used in the PGC-Cross Disorder Group analysis25 together with newly available ADHD samples27-30. Data upload to the PGC central server follows strict guidelines to ensure local ethics committee approval for all contributed data (https://pgc.unc.edu/). Data from all study cohorts were processed through the stringent PGC pipeline25. Imputation of autosomal SNPs used the CEU+TSI Hapmap Phase 3 data as the reference panel21. For each analysis (univariate or bivariate), we retained only SNPs that had minor allele frequency > 0.01 and imputation R2 > 0.6 in all contributing cohort sub-samples (imputation cohorts). Different QC strategies were investigated in detail for the raw and PGC imputed genotyped data of the International Schizophrenia Consortium, a subset of the PGC SCZ sample35. The CD samples from the International IBD Genetics Consortium (IIBDGC)43 were processed through the same QC and imputation pipeline as the PGC data, generating a data set of 5054 cases and 11496 controls from 6 imputation cohorts.
In each analysis, individuals were excluded to ensure that all cases and controls were completely unrelated in the classical sense, so that no pairs of individuals had a genome-wide similarity relationship greater than 0.05 (equivalent to about second-cousins). This procedure removed ancestry outliers (over and above those already removed in the PGC QC pipeline, Supplementary Figures 2-5) and ensured that overlapping control sets were allocated randomly between disorders in the bivariate analyses. Exact numbers of cases and controls used in each analysis are listed in Supplementary Tables 1-8.
We use the methods presented in Lee et al.18,35 Briefly, we estimate the variance in case-control status explained by all SNPs using a linear mixed model,
y
=
X
b
+
g
+
e
(1)
where y is a e tor of ase = or o trol = status the o ser ed s ale , β is a vector for fixed effects of the overall mean (intercept), sex, sample cohort and 20 ancestry principal components, g is the vector of random additive genetic effects based on aggregate SNP information, and e is a vector of random error effects. X is an incidence matrix for the fixed effects relating these effects to individuals. The variance structure of phenotypic
observations is V(y) =
V
A
g2
I
e2, where is additive genetic variance tagged by the SNPs, is error variance, A is the realized similarity relationship matrix estimated from SNP data19 and I is an identity matrix. All variances are estimated on the observed case-control scale and are transformed to the liability scale, which requires specification of the disorder risk, K, to estimate SNP-h2. Risk to first-degree relatives is calculated from K and SNP-h2 based on the liability threshold model64.The bivariate analyses use a bivariate extension of equation (1)20. The two traits are measured on different individuals, but the equations are related through the genome-wide similarities estimated from SNPs. Genetic and residual variances for the traits are estimated as well as the genetic covariance
s
g12. The genetic correlation coefficient (rg) iss
g12/(
g1
g2) and is approximately the same on the observed case-control scale as on theliability scale20 so does not depend on specifications of K. The covariance,
s
g12, can be transformed to the liability scale accounting for assumed disorder risks and proportions of cases and controls in the samples of each disorder20 and it equals the coheritability54,
rgh1h2.We used the approximated chi-square test statistic (estimate/s.e.)2 to test if estimates were significantly different from zero. We checked that this simple approximation agreed well with the more formal and computer-intensive likelihood ratio test for several examples.
Heterogeneity of SNP-heritabilities as tested usi g Co hra ’s65 Q a d Higgi s’66 I2, acknowledging potential non-independence of the 6 estimates (3 subsets plus 3 subset pairs).
Disorder risk for the study-base population (disorder risk, K)
The estimates of SNP-h2 and SNP-coheritability from the linear model are on the case-control scale and so depend partly on the proportion of cases and case-controls in the sample. The transformation to the liability scale allows benchmarking of SNP-h2 to estimates of heritability from family studies, and the transformation accounts for the proportion of cases in the sample and depends on the assumed disorder risk (K). The appropriate choice of K depends on the definitions of both the phenotype (including ascertainment strategy) and the population, which may differ between cohorts. We consider lower and upper bounds for K in Table 1 to cover the range of possible values. SNP-rg estimates are independent of scale and hence are not dependent on the choice of K.
Genome partitioning linear mixed model
We partitioned the variance explained by the SNPs in several ways. For example, for the
univariate linear model
y
=
X
b
+
g
tt=1 n
å
+
e
with V(y) =where n is the number of subsets from any non-overlapping partitioning of SNPs; n = 22 for the joint analysis by chromosome, n = 5 for the analysis by MAF bin and n = 3 for the analysis of “NP ge e a otatio i hi h “NPs ere lassed as CN“+ ge es , ge es
represe ti g M , “NPs i other ge es , ge es represe ti g , M and the re ai i g “NPs ot i ge es . Ge e ou daries as ± k fro ’ a d ’ UTRs of ea h ge e and the CNS+ genes were the four sets identified by Raychaudhuri et al.34 (one set
comprised genes expressed preferentially in the brain compared to other tissues and the other three sets comprised genes annotated to be involved in neuronal activity, learning and synapses). The CNS+ set was found to explain more of the SNP-heritability than expected by
V = At t=1 n
å
s
gtc 2 + Is
e2chance for schizophrenia35. All methods have been implemented into the freely available GCTA software67.
References
References
1 Kendler, K. S. & Eaves, L. J. Psychiatric Genetics (Review of Psychiatry). Am. Psychiatric Assoc. (2005).
2 Tsuang, M. & Faraone, S. The genetics of mood disorders. (Johns Hopkins University Press, 1990).
3 Smoller, J. W. & Finn, C. T. Family, twin, and adoption studies of bipolar disorder. Am. J. Med. Genet. C Semin. Med. Genet. 123, 48-58 (2003).
4 Ronald, A., Simonoff, E., Kuntsi, J., Asherson, P. & Plomin, R. Evidence for overlapping genetic influences on autistic and ADHD behaviours in a community twin sample. J. Child Psychol. Psychiatry Allied Disciplines 49, 535-542 (2008). 5 Rommelse, N. N., Franke, B., Geurts, H. M., Hartman, C. A. & Buitelaar, J. K. Shared
heritability of attention-deficit/hyperactivity disorder and autism spectrum disorder. Europ. Child Adol. Psychiatry 19, 281-295 (2010).
6 Lichtenstein, P., Carlstrom, E., Rastam, M., Gillberg, C. & Anckarsater, H. The genetics of autism spectrum disorders and related neuropsychiatric disorders in childhood. Am. J. Psychiatry 167, 1357-1363, doi:10.1176/appi.ajp.2010.10020223 (2010).
7 Rapoport, J., Chavez, A., Greenstein, D., Addington, A. & Gogtay, N. Autism spectrum disorders and childhood-onset schizophrenia: clinical and biological contributions to a relation revisited. J. Am. Acad. Child Adol. Psychiatry 48, 10-18 (2009).
8 King, B. H. & Lord, C. Is schizophrenia on the autism spectrum? Brain. Res. 1380, 34-41 (2011).
9 Sullivan, P. F. et al. Family history of schizophrenia and bipolar disorder as risk factors for autism Archives of General Psychiatry 69, 1099-1103 (2012).
10 Crespi, B., Stead, P. & Elliot, M. Comparative genomics of autism and schizophrenia. P Natl Acad Sci USA 107, 1736-1741 (2010).
11 Mortensen, P. B., Pedersen, M. G. & Pedersen, C. B. Psychiatric family history and schizophrenia risk in Denmark: which mental disorders are relevant? Psychol Med 40, 201-210, doi:10.1017/S0033291709990419 (2010).
12 Faraone, S. V., Biederman, J. & Wozniak, J. Examining the Comorbidity Between Attention Deficit Hyperactivity Disorder and Bipolar Disorder: A Meta-Analysis of Family-Genetic Studies. American Journal of Psychiatry 169, 1256-1266 (2012). 13 Cole, J., Ball, H. A., Martin, N. C., Scourfield, J. & McGuffin, P. Genetic overlap
between measures of hyperactivity/inattention and mood in children and adolescents. J. Am. Acad. Child Adol. Psychiatry 48, 1094-1101 (2009).
14 Craddock, N., O'Donovan, M. C. & Owen, M. J. Genes for schizophrenia and bipolar disorder? Implications for psychiatric nosology. Schizophr. Bull. 32, 9-16,
doi:10.1093/schbul/sbj033 (2006).
15 Green, E. K. et al. The bipolar disorder risk allele at CACNA1C also confers risk of recurrent major depression and of schizophrenia. Mol. Psychiatry 15, 1016-1022, doi:10.1038/mp.2009.49 (2010).
16 Williams, N. M. et al. Genome-wide analysis of copy number variants in attention deficit/hyperactivity disorder confirms the role of rare variants and implicates duplications at 15q13.3 Am. J. Psychiatry 169, 195-204 (2012).
17 Manolio, T. A. Genomewide association studies and assessment of the risk of disease. N. Engl. J. Med. 363, 166-176, doi:10.1056/NEJMra0905980 (2010). 18 Lee, S. H., Wray, N. R., Goddard, M. E. & Visscher, P. M. Estimating missing
heritability for disease from genome-wide association studies. Am. J. Hum. Genet. 88, 294-305 (2011).
19 Yang, J. et al. Common SNPs explain a large proportion of the heritability for human height. Nat. Genet. 42, 565-569 (2010).
20 Lee, S. H., Yang, J., Goddard, M. E., Visscher, P. M. & Wray, N. R. Estimation of pleiotropy between complex diseases using SNP-derived genomic relationships and restricted maximum likelihood. Bioinformatics 28, 2540-2542 (2012).
21 Ripke, S. et al. Genome-wide association study identifies five new schizophrenia loci. Nat. Genet. 43, 969-976 (2011).
22 Sklar, P. et al. Large-scale genome-wide association analysis of bipolar disorder identifies a new susceptibility locus near ODZ4. Nat. Genet. 43, 977-983 (2011). 23 Psychiatric GWAS Consortium Major Depressive Disorder. A mega-analysis of
genome-wide association studies for major depressive disorder. Mol. Psychiatry (2012).
24 Anney, R. et al. Individual common variants exert weak effects on the risk for autism spectrum disorderspi. Hum. Mol. Genet., doi:10.1093/hmg/dds301 (2012).
25 Cross-Disorder Group of the Psychiatric GWAS Consortium. Genome-wide analysis identifies loci with shared effects on five major psychiatric disorders. Lancet In press (2012).
26 Neale, B. M. et al. Meta-analysis of genome-wide association studies of attention-deficit/hyperactivity disorder. J. Am. Acad. Child Adolesc. Psychiatry 49, 884-897 (2010).
27 Stergiakouli, E. et al. Investigating the contribution of common genetic variants to the risk and pathogenesis of ADHD. Am. J. Psychiatry 169, 186-194 (2012).
28 Lionel, A. C. et al. Rare copy number variation discovery and cross-disorder comparisons identify risk genes for ADHD. Sci. Transl. Med. 3, 95ra75 (2011). 29 Hinney, A. et al. Genome-wide association study in German patients with attention
deficit/hyperactivity disorder. Am. J. Med. Genet. B Neuropsychiatr. Genet. 156B, 888-897 (2011).
30 Ribases, M. et al. Exploration of 19 serotoninergic candidate genes in adults and children with attention-deficit/hyperactivity disorder identifies association for 5HT2A, DDC and MAOB. Molecular psychiatry 14, 71-85, doi:10.1038/sj.mp.4002100 (2009).
31 Lynch, M. & Walsh, B. Genetics and Analysis of Quantitative Traits. (Sinauer Associates, 1998).
32 Purcell, S. M. et al. Common polygenic variation contributes to risk of schizophrenia and bipolar disorder. Nature 460, 748-752, doi:10.1038/nature08185 (2009). 33 Lee, S. H., Goddard, M. E., Wray, N. R. & Visscher, P. M. A better coefficient of
determination for genetic profile analysis. Genet. Epidemiol. 36, 214-224 (2012). 34 Raychaudhuri, S. et al. Accurately Assessing the Risk of Schizophrenia Conferred by
Rare Copy-Number Variation Affecting Genes with Brain Function. Plos Genetics 6, e1001097. (2010).
35 Lee, S. H. et al. Estimating the proportion of variation in susceptibility to schizophrenia captured by common SNPs. Nat. Genet. 44, 247-250 (2012).
36 Lubke, G. H. et al. Estimating the Genetic Variance of Major Depressive Disorder Due to All Single Nucleotide Polymorphisms. Biol. Psychiatry (2012).
37 Klei, L. et al. Common genetic variants, acting additively, are a major source of risk of autism. Molecular autism Epun ahead of print (2012).
38 Browning, S. R. & Browning, B. L. Population structure can inflate SNP-based heritability estimates. Am. J. Hum. Genet 89, 191-193; author reply 193-195 (2011). 39 Goddard, M. E., Lee, S. H., Yang, J., Wray, N. R. & Visscher, P. M. Response to
40 Yang, J. et al. Genome partitioning of genetic variation for complex traits using common SNPs. Nature genetics 43, 519-U544 (2011).
41 Lee, S. H. et al. Estimation and partitioning of polygenic variation captured by o o “NPs for Alzhei er’s disease, multiple sclerosis and endometriosis. Human molecular genetics 22, 832-841 (2012).
42 Constantino, J. N. & Todd, R. D. Intergenerational transmission of subthreshold autistic traits in the general population. Biological psychiatry 57, 655-660, doi:10.1016/j.biopsych.2004.12.014 (2005).
43 Franke, A. et al. Genome-wide meta-analysis increases to 71 the number of confirmed Crohn's disease susceptibility loci. Nat. Genet. 42, 1118-1125 (2010). 44 Loftus, E. V., Jr. et al. Increased risks of developing anxiety and depression in young
patients with Crohn's disease. Am. J. Gastroenterol. 106, 1670-1677 (2011).
45 Kohane, I. S. et al. The co-morbidity burden of children and young adults with autism spectrum disorders. PloS one 7, e33224 (2012).
46 Wellcome Trust Case Control Consortium. Genome-wide association study of 14,000 cases of seven common diseases and 3,000 shared controls. Nature 447, 661-678 (2007).
47 Benach, J. L., Li, E. & McGovern, M. M. A microbial association with autism. mBio 3 (2012).
48 Wray, N. R., Lee, S. H. & Kendler, K. S. Impact of diagnostic misclassification on estimation of genetic correlations using genome-wide genotypes. Eur. J. Hum. Genet. (2012).
49 Bromet, E. J. et al. Diagnostic Shifts During the Decade Following First Admission for Psychosis. Am. J. Psychiatry (2011).
50 Laursen, T. M., Agerbo, E. & Pedersen, C. B. Bipolar Disorder, Schizoaffective Disorder, and Schizophrenia Overlap: A New Comorbidity Index. J. Clinic. Psychiatry 79, 1432-1438 (2009).
51 Tsuang, M. T., Woolson, R. F., Winokur, G. & Crowe, R. R. Stability of psychiatric diagnosis. Schizophrenia and affective disorders followed up over a 30- to 40-year period. Arch. Gen. Psychiatry 38, 535-539 (1981).
52 Visscher, P. M., Brown, M. A., McCarthy, M. I. & Yang, J. Five years of GWAS discovery. Am. J. Hum. Genet. 90, 7-24, doi:10.1016/j.ajhg.2011.11.029 (2012). 53 Wray, N. R. et al. Genome-wide association study of major depressive disorder: new
results, meta-analysis, and lessons learned. Mol. Psychiatry 17, 36-48 (2012). 54 Falconer, D. & Mackay, T. Introduction to Quantitative Genetics. Fourth edn,
(Longman, 1996).
55 Van Snellenberg, J. X. & de Candia, T. Meta-analytic evidence for familial
coaggregation of schizophrenia and bipolar disorder. Arch. Gen. Psychiatry 66, 748-755 (2009).
56 Lichtenstein, P. et al. Common genetic determinants of schizophrenia and bipolar disorder in Swedish families: a population-based study. Lancet 373, 234-239 (2009). 57 McGuffin, P. et al. The heritability of bipolar affective disorder and the genetic
relationship to unipolar depression. Arch. Gen. Psychiatry 60, 497-502 (2003). 58 Moreno-De-Luca, D. et al. Deletion 17q12 Is a Recurrent Copy Number Variant that
Confers High Risk of Autism and Schizophrenia American journal of human genetics 88, 121-121 (2011).
59 Stankiewicz, P. & Lupski, J. R. Structural Variation in the Human Genome and its Role in Disease. Ann. Rev. Med. 61, 437-455 (2010).
60 Nijmeijer, J. S. et al. Identifying loci for the overlap between
attention-deficit/hyperactivity disorder and autism spectrum disorder using a genome-wide QTL linkage approach. J. Am. Acad. Child Adolesc. Psychiatry 49, 675-685 (2010).
61 Mulligan, A. et al. Autism symptoms in Attention-Deficit/Hyperactivity Disorder: a familial trait which correlates with conduct, oppositional defiant, language and motor disorders. J.. Autism Dev. Disord. 39, 197-209 (2009).
62 Ripke, S. e. a. Genome-wide association of schizophrenia in Sweden. Nature genetics In press (2013).
63 Sullivan, P. F., Daly, M. J. & O'Donovan, M. Genetic architectures of psychiatric disorders: the emerging picture and its implications. Nature reviews. Genetics 13, 537-551 (2012).
64 Reich, T., James, J. W. & Morris, C. A. The use of multiple thresholds in determining the mode of transmission of semi-continuous traits. Ann Hum Genet 36, 163-184 (1972).
65 Cochran, W. G. The combination of estimates from different experiments. Biometrics 10, 101-129 (1954).
66 Higgins, J. P., Thompson, S. G., Deeks, J. J. & Altman, D. G. Measuring inconsistency in meta-analyses. BMJ 327, 557-560 (2003).
67 Yang, J., Lee, S. H., Goddard, M. E. & Visscher, P. M. GCTA: a tool for Genome-wide Complex Trait Analysis. Am. J. Hum. Genet. 88, 76-82 (2011).
S Hong Lee1, Stephan Ripke2,3, Benjamin M Neale2,3, Stephen V Faraone4,5, Shaun M Purcell2,3,6, Roy H Perlis3,7, Bryan J Mowry1,8, Anita Thapar9, Michael E Goddard10,11, John S Witte12, Devin Absher13, Ingrid Agartz14,15, Huda Akil16, Farooq Amin17, Ole A Andreassen14,18, Adebayo Anjorin19, Richard Anney20, Verneri Anttila2, Dan E Arking21, Philip Asherson22, Maria H Azevedo23, Lena Backlund24, Judith A Badner25, Anthony J Bailey26, Tobias Banaschewski27, Jack D Barchas28, Michael R Barnes29, Thomas B Barrett30, Nicholas Bass31,32, Agatino
Battaglia33, Michael Bauer34, Mònica Bayés35, Frank Bellivier36,37,38,39, Sarah E Bergen3,7,40, Wade Berrettini41, Catalina Betancur42,43,44, Thomas Bettecken45, Joseph Biederman46, Elisabeth B Binder45, Donald W Black47, Douglas H R Blackwood48, Cinnamon S Bloss49, Michael Boehnke50, Dorret I Boomsma51,52,53, Gerome Breen22,54,55, René Breuer56, Richard Bruggeman57, Nancy G Buccola58, Jan K Buitelaar59, William E Bunney60, Joseph D Buxbaum6, William F Byerley61,62, Enda M Byrne1, Sian Caesar63, Wiepke Cahn64,65, Rita M Cantor66, Miguel Casas67,68, Aravinda Chakravarti21, Kimberly Chambert3, Khalid Choudhury69, Sven Cichon70,71,72, C Robert Cloninger73, David A Collier22, Edwin H Cook74, Hilary Coon75, Bru Cormand76,77,78, Aiden Corvin20, William H Coryell47, David W Craig79, Ian W Craig22, Jennifer Crosbie80, Michael L Cuccaro81, David Curtis82, Darina Czamara45,83, Susmita Datta84, Geraldine Dawson85,86,87, Richard Day88, Eco J De Geus51,52,53, Franziska Degenhardt70,72, Srdjan Djurovic14,89, Gary J Donohoe20, Alysa E Doyle90, Jubao Duan91, Frank Dudbridge92, Eftichia Duketis93, Richard P Ebstein94, Howard J Edenberg95,96, Josephine Elia41,97, Sean Ennis98, Bruno Etain36,39,99,100, Ayman Fanous101,102, Anne E Farmer22, I Nicol Ferrier103, Matthew Flickinger50, Eric Fombonne104,105, Tatiana Foroud96, Josef Frank56, Barbara Franke59, Christine Fraser106,107, Robert Freedman108, Nelson B Freimer109, Christine M Freitag93, Marion Friedl110, Louise Frisén 111, Louise
Gallagher112, Pablo V Gejman 91, Lyudmila Georgieva106,107, Elliot S Gershon113, Daniel H Geschwind114,115, Ina Giegling110, Michael Gill20, Scott D Gordon116, Katherine
Gordon-Smith63,117, Elaine K Green118, Tiffany A Greenwood119, Dorothy E Grice6, Magdalena Gross120, Detelina Grozeva117, Weihua Guan50, Hugh Gurling19,32, Lieuwe De Haan121, Jonathan L Haines122, Hakon Hakonarson123,124, Joachim Hallmayer125, Steven P Hamilton61, Marian L Hamshere117,126, Thomas F Hansen127, Annette M Hartmann110, Martin Hautzinger128, Andrew C Heath73, Anjali K Henders116, Stefan Herms70, Ian B Hickie129, Maria Hipolito130, Susanne Hoefels120, Peter A Holmans117,126, Florian Holsboer45, Witte J Hoogendijk131, Jouke-Jan Hottenga51,53, Christina M Hultman40, Vanessa Hus132, Andrés Ingason127, Marcus Ising45, Stéphane Jamain36,39,99,100, Edward G Jones133, Ian Jones117, Lisa Jones63, Tzeng Jung-Ying134, Anna K Kähler40, René S Kahn135, Radhika Kandaswamy19, Matthew C Keller136, James L Kennedy137, Elaine Kenny20, Lindsey Kent138, Yunjung Kim139, George K Kirov106,107, Sabine M Klauck140, Lambertus Klei141, James A Knowles142, Martin A Kohli45, Daniel L Koller96, Bettina Konte110, Ania Korszun143, Lydia Krabbendam65,144, Robert Krasucki145, Jonna Kuntsi22, Phoenix Kwan146, Mikael Landén 40,147, Niklas Långström40, Mark Lathrop148, Jacob Lawrence32,149, William B Lawson130, Marion Leboyer36,39,99,100, David H Ledbetter150, Phil Hyoun Lee7, Todd Lencz151,152,153, Klaus-Peter Lesch154,155, Douglas F Levinson156, Cathryn M Lewis22, Jun Li157, Paul Lichtenstein40, Jeffrey A Lieberman158, Dan-Yu Lin159, Don H Linszen65,160, Chunyu Liu25, Falk W Lohoff41, Sandra K Loo161,162, Catherine Lord163, Jennifer K Lowe114,115, Susanne Lucae45, Donald J MacIntyre48, Pamela AF Madden164, Elena Maestrini165, Patrik KE Magnusson40, Pamela B Mahon166, Wolfgang Maier120, Anil K Malhotra151,152,153, Shrikant M Mane167, Christa L Martin150, Nicholas G Martin116, Manuel Mattheisen168,169,170, Keith Matthews88, Morten Mattingsdal14,171, Steven A McCarroll3, Kevin A McGhee48, James J McGough172, Patrick J McGrath173, Peter McGuffin22, Melvin G McInnis174, Andrew McIntosh48,175, Rebecca
McKinney176, Alan W McLean48,175, Francis J McMahon177, William M McMahon178, Andrew McQuillin19,32, Helena Medeiros179, Sarah E Medland116, Sandra Meier56, Ingrid Melle14,18, Fan Meng16, Jobst Meyer180, Christel M Middeldorp51,53, Lefkos Middleton181, Vihra Milanova182, Ana Miranda183, Anthony P Monaco184,185, Grant W Montgomery116, Jennifer L Moran3, Daniel Moreno-De-Luca186, Gunnar Morken187,188, Derek W Morris20, Eric M Morrow189,190, Valentina Moskvina117,126, Pierandrea Muglia176, Thomas W Mühleisen72,191, Walter J Muir48,175, Bertram Müller-Myhsok45,83, Michael Murtha192,193,194, Richard M Myers13, Inez Myin-Germeys65,144, Michael C Neale102, Stan F Nelson162, Caroline M Nievergelt119, Ivan Nikolov106,107, Vishwajit Nimgaonkar195,196, Willem A Nolen197, Markus M Nöthen70,72, John I Nurnberger198, Evaristus A Nwulia130, Dale R Nyholt116, Colm O'Dushlaine3, Robert D Oades199, Ann Olincy108, Guiomar Oliveira23,200, Line Olsen127, Roel A Ophoff109,201,202, Urban Osby111, Michael J Owen106,107, Aarno Palotie203, Jeremy R Parr103, Andrew D Paterson204,205, Carlos N Pato179, Michele T Pato179, Brenda W Penninx52,53,206, Michele L Pergadia164, Margaret A Pericak-Vance81, Benjamin S Pickard48,175, Jonathan Pimm145, Joseph Piven207, Danielle Posthuma208,209,210, James B Potash47,
Fritz Poustka93, Peter Propping72, Vinay Puri145, Digby J Quested211, Emma M Quinn20, Josep Antoni Ramos-Quiroga67,68, Henrik B Rasmussen127,212, Soumya Raychaudhuri2,3, Karola Rehnström203, Andreas Reif213, Marta Ribasés214,215, John P Rice216, Marcella Rietschel56,
Kathryn Roeder217, Herbert Roeyers218, Lizzy Rossin3, Aribert Rothenberger219, Guy Rouleau220, Douglas Ruderfer6, Dan Rujescu110, Alan R Sanders91, Stephan J Sanders186,192,194,221, Susan Santangelo222,223, Joseph A Sargeant224, Russell Schachar80, Martin Schalling111, Alan F
Schatzberg225, William A Scheftner226, Gerard D Schellenberg227, Stephen W Scherer228, Nicholas J Schork229,230, Thomas G Schulze166,231, Johannes Schumacher72, Markus Schwarz232, Edward Scolnick3, Laura J Scott50, Jianxin Shi233, Paul D Shilling176, Stanley I Shyn234, Jeremy M Silverman6, Susan L Slager235, Susan L Smalley236, Johannes H Smit52,237, Erin N Smith229,230, Edmund JS Sonuga-Barke218,238, David St Clair239, Matthew State192, Michael Steffens240, Hans-Christoph Steinhausen241,242,243, John S Strauss244, Jana Strohmaier56, T Scott Stroup158, James Sutcliffe245, Peter Szatmari246,247,248, Szabocls Szelinger79, Srinivasa Thirumalai249, Robert C Thompson16, Alexandre A Todorov73, Federica Tozzi29, Jens Treutlein56, Manfred Uhr45, Edwin JCG van den Oord250, Gerard Van Grootheest52,237, Jim Van Os65,144, Astrid M Vicente251,252,253, Veronica J Vieland254, John B Vincent255, Peter M Visscher1,256, Christopher A Walsh257,258,259, Thomas H Wassink47, Stanley J Watson16, Myrna M Weissman260, Thomas Werge127, Thomas F Wienker113, Durk Wiersma57, Ellen M Wijsman261,262, Gonneke Willemsen51,52, Nigel
Williams106,107, A Jeremy Willsey192, Stephanie H Witt56, Wei Xu205, Allan H Young103,263, Timothy W Yu264, Stanley Zammit106,107, Peter P Zandi265, Peng Zhang50,174, Frans G Zitman266, Sebastian Zöllner174,267, International Inflammatory Bowel Disease Genetics Consortium (IIBDGC) 268, Bernie Devlin141, John R Kelsoe119,269, Pamela Sklar6, Mark J Daly2,3, Michael C O'Donovan106,107, Nicholas Craddock106,107, Patrick F Sullivan139, Jordan W Smoller3,7, Kenneth S Kendler102,270,271*, Naomi R Wray1,*,
1
The University of Queensland, Queensland Brain Institute, Brisbane, QLD, Australia. 1The University of Queensland, Queensland Brain Institute, Brisbane, QLD, Australia. 2Analytic and Translational Genetics Unit, Massachusetts General Hospital and Harvard Medical School, Boston, MA,
USA. 3Stanley Center for Psychiatric Research, Broad Institute of MIT and Harvard, Cambridge, MA, USA. 4Department of Psychiatry, SUNY Upstate Medical University, Syracuse, NY. 5Department of Neuroscience and Physiology, SUNY Upstate Medical University, Syracuse, NY. 6Department of Psychiatry, Mount Sinai School of Medicine, New York, NY, USA. 7Psychiatric and Neurodevelopmental Genetics Unit, Massachusetts General Hospital, Boston, MA, USA. 8Queensland Centre for Mental Health Research, Wacol, Australia. 9Institute of Psychological Medicine and Clinical Neurosciences, MRC Centre in Neuropsychiatric Genetics and Genomics, Cardiff University School of Medicine, Cardiff University, Cardiff, UK. 10Biosciences Research Division, Department of Primary Industries Victoria, Melbourne, Victoria, Australia . 11Faculty of Land and Food Resources, University of Melbourne, Melbourne, Victoria, Australia. 12Institute for Human Genetics, University of California, San Francisco, CA, USA. 13HudsonAlpha Institute of Biotechnology, Huntsville, AL, USA. 14KG Jebsen Centre for Psychosis Research, Institute of Clinical Medicine, University of Oslo, Oslo, Norway. 15Department of Research, Diakonhjemmet Hospital, Oslo, Norway. 16Molecular and Behavioral Neuroscience Institute, University of Michigan, Ann Arbor, MI, USA. 17Department of Psychiatry and Behavioral Sciences, Emory University and Atlanta Veterans Affairs Medical Center, Atlanta, GA, USA. 18Division of Mental Health and Addiction, Oslo University Hospital, Oslo, Norway. 19Mental Health Sciences Unit, University College London, London, UK. 20Department of Psychiatry, Trinity College Dublin, Dublin, Ireland. 21McKusick-Nathans Institute of Genetic Medicine, Johns Hopkins University School of Medicine, Baltimore, MD, USA. 22MRC Social, Genetic and Developmental Psychiatry (SGDP) Centre, The Institute of Psychiatry, King's College London, London, UK. 23Faculty of Medicine, University of Coimbra, Coimbra, Portugal. 24Department of Clinical Neuroscience, Karolinska Institutet, Stockholm, Sweden. 25Department of Psychiatry, University of Chicago, Chicago, IL, USA. 26Department of Psychiatry, University of British Columbia, Vancouver, BC, Canada. 27Department of Child and Adolescent Psychiatry and Psychotherapy, Central Institute of Mental Health, Medical Faculty
Mannheim, University of Heidelberg, Mannheim, Germany. 28Department of Psychiatry, Weill Medical College, Cornell University, New York, NY, USA. 29GlaxoSmithKline, London, UK. 30Portland Veterans Affairs Medical Center, Portland, OR, USA. 31Molecular Psychiatry Laboratory, Mental Health Sciences Unit, University College London, London, UK. 32Windeyer Institute of Medical Sciences, London, UK.33Stella Maris Institute for Child and Adolescent Neuropsychiatry, 56128 Calambrone (Pisa),