Journal of Antimicrobial Chemotherapy (1993) 31, 731-737
Penetration of rifampicin into the brain tissue and
cerebral extracellular space of rats
Tbomas Mindennann"*, Hans Landolf, Werner Zimmerli*, Zarko Rajacic* and Otmar GratzP
'Neurosurgicai University Clinics, bDivision of Infectious Diseases and Department of Research and Internal Medicine, University Hospitals Basle,
4031 Basle, Switzerland
Rifampicin is used to treat neurosurgicai shunt infections because of its excellent in-vitro activity against staphylococci and its adequate penetration into the CSF. However, nothing is known about rifampicin concentrations in the cerebral extra-cellular space (CES). We measured the penetration of rifampicin into the CES of anaesthetized rats by microdialysis using low-flow and equilibrium methods. Depending on the method, rifampicin concentrations in the CES were 0-3-1% of the serum concentration or 3-8% of brain tissue concentration, respectively. These experimental data in animals suggest that the recommended dose of rifampicin in man might be inadequate for treatment of some brain infections.
Introduction
Antibiotic therapy and prophylaxis of bacterial cerebral infections is based upon little information regarding the tissue concentrations and in-vivo drug penetration into the cerebral extracellular space (CES). Since microorganisms are in the extracellular fluid rather than within brain cells, antibiotic concentrations in the CES may be more relevant than tissue concentration. Drug concentration in CES can be measured in vivo by microdialysis using a miniaturized permeable membrane. A probe is delivered into tissue or body fluids and perfused with a solution at a constant flow rate. The microdialysis probe, which consists of a small silicate inlet tube within a cylindrical semipermeable polycarbonate membrane outlet tube, carries out water soluble substances of molecular weight < 5000 Da from the surrounding tissue by diffusion. Each probe is characterized by its relative recovery, determined in vitro by dividing the concentration measured in the dialysate by the known concentration of drug in the solution in which it is placed (Benveniste & Huttenmeier, 1990). Knowledge of a probe's relative recovery for a given compound allows calculation of that compound's concen-tration in the extracellular fluid of tissues when perfusion in vivo is performed under the same standardized in-vitro conditions. The method is called the low-flow method because recovery is best at low-flow rates. Absolute concentrations in the extracellular fluid of tissue can be derived by the equilibrium method. Here, the compound is added to the perfusate at various concentrations and these are compared with the concentra-tion in the outcoming dialysate. The increase or decrease in concentraconcentra-tion, respectively, • Present address: Department of Neurological Surgery, University of California San Francisco, Moffitt Hospital, Room 787, 505 Parnassus Avenue, San Francisco, CA 94143, USA.
731
732 T. Mindermann et al.
is dependent of the concentration in the extracellular fluid of surrounding tissue (Lonnroth, Jansson & Smith, 1987). To date, the low-flow method has mainly been used to monitor neurotransmitters and metabolites (Benveniste, 1989; Benveniste & Huttenmeier, 1990). We have applied both methods to measure the penetration of rifampicin into the CES.
Materials and methods
All experiments were performed in adult male 250 g Sprague-Dawley rats which were given rifampicin 100 mg/kg ip (kindly provided by Ciba-Geigy AG, Basel, Switzerland). Preliminary experiments had shown that ip administration simulated iv infusion and produced peak rifampicin concentrations in brain tissue which persisted from 3-7 h post dose. The 100 mg/kg dose was used since experiments with 25 mg/kg failed to produce detectable rifampicin in the CES (unpublished observations).
In-vitro experiments
The probe's relative recovery was determined with solutions of rifampicin 1, 2, 4, 6, 8, 10, 12, 14, 16 and 18 mg/L in 0-9% NaCl. The microdialysis was performed at 37°C with a flow rate of 0-5 /zL/min resulting in the collection of 120 nL of dialysate after 4 h. The volume of the external solution was 2 mL and 4 replicates were tested at each concentration.
Low-flow experiments
Five rats were anaesthetized with halothane and placed in a surgical head holder. Respiration was spontaneous. Body temperature was monitored and maintained at 37°C. A binocular microscope was used for the surgical procedure. The skull was trepanated 5 mm laterally of the Bregma point. After opening of the dura, a micro-dialysis probe (4 x 0-5 mm) was implanted 5 mm vertically into the left hemisphere. The probe was perfused with 0-9% NaCl, pumped at a flow rate of 0-5 //L/min resulting in 120/iL microdialysate after 4 h. Our equipment was a CMA/12 dialysis probe with membrane mol. wt cut-off at 5000 Da (rifampicin mol. wt 823 Da), a CM A/100 perfusor and a CM A/140 dialysate collector (Carnegie Medicine, Stockholm, Sweden). Each animal received 100 mg/kg rifampicin ip. At 1/2, 1, 2, 3, 4, 5, 6 and 7 h post dose, blood samples were taken and centrifuged at 3000 rpm for 10 min. At 3 h post dose, collecting of the dialysate was begun and lasted for 4 h. At 7 h post dose, the animals were killed and the right hemisphere was removed for further processing. The tissue was carefully rinsed and homogenized with 0-9% NaCl (1:1 wt/vol).
Equilibrium experiments
The same procedure with regard to anaesthesia, rifampicin dosage , surgical procedure and equipment was performed with another three rats. At 3 and 4 h post dose, the probes were perfused with rifampicin solutions of 0-25 and 0-50 mg/L at a flow rate of 2 /iL/min, resulting in 120 /iL each after 1 h. At 5 h post dose, the animals were killed and the right hemisphere was removed for further processing as described above.
Rifampicin in cerebral extracellular space 733
Rifampicin assay
Rifampicin concentrations were measured by agar diffusion bioassay, using Sarcina lutea as the indicator strain (Tshefu, Zimmerli & Waldvogel, 1983). Standard solutions were prepared from the commercially available iv preparation of rifampicin by diluting stock solutions with pooled serum, resulting in a final serum concentration of 50%. Identical standard curves were obtained with standards prepared in 09% N a G or 50% serum, respectively, and therefore, serum, CES and tissue homogenates were all assayed on the same plate with the same 50% serum standards. Tissue concentration was calculated by multiplying the concentration in the homogenate by two. This assay has a detection limit of 0-05 mg/L and does not differentiate between rifampicin and its metabolites. The agar diffusion assay has an excellent correlation (r = 0-988) with high-pressure liquid chromatography (Weber, Opheim & Smith, 1983). All concentrations given here are mean + standard error.
Results
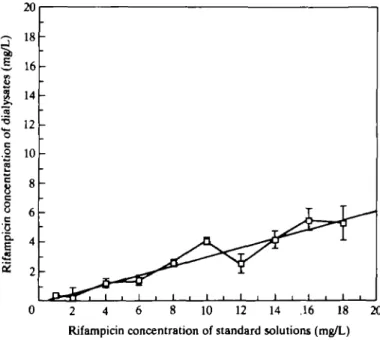
Figure 1 shows the recovery of rifampicin from the microdialysis probe in vitro by the low-flow method. It was approximately linear between 1 and 18 mg/L and was approximately 30%.
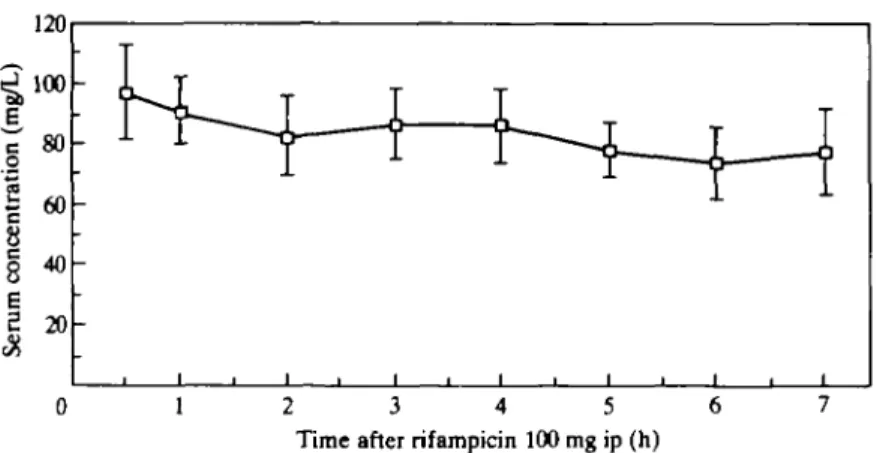
Figure 2 illustrates serum pharmacokinetics after a single dose of rifampicin 100 mg/kg to rats. Serum peak of approximately 100 mg/L was reached within 30 min and only moderately decreased during the next 7 h.
2 4 6 8 10 12 14 .16 18 20 Rifampicin concentration of standard solutions (mg/L)
Figure 1. Recovery of rifampicin from a microdialysis probe in vitro. Microdialysis was performed at 37°C and a constant flow rate of 05/iL/min resulting in 120//L dialysate after 4h. The external solutions had a volume of 2 mL each. Bars represent S.E. (n >= 4).
734 T. M Indermann et al.
0 1 2 3 4 5 6
Time after rifampicin 100 mg ip (h)
Figure 2. Serum concentration of rifampicin in rats after administration of lOOmg/kg ip. Bars represent
SJL (n = 5).
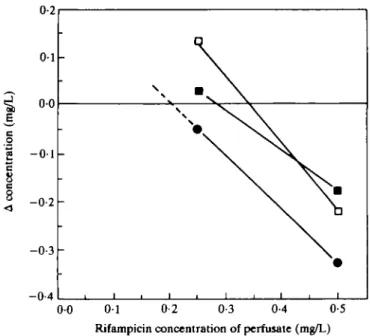
The Table summarizes the rifampicin concentrations found in serum, brain tissue and CES. Figure 3 shows measurement of rifampicin in the CES as determined by the equilibrium method. As can be seen from the Table, this method revealed somewhat lower rifampicin levels in the CES, namely, 3% of the brain tissue values, than the low-flow method.
Discussion
Microdialysis has not previously been used to measure penetration of antibiotics into the CES and our aim was to measure penetration of rifampicin. Bacterial infections of the central nervous system are often caused by Staphylococcus aureus, Staphylococcus epidermidis and streptococci. In contrast to rifampicin, other anti-staphylococcal drugs such as isoxazoylpenicillins or vancomycin have poor penetration into brain tissue (De Louvois, Gortvai & Hurley, 1977; Kaplan, 1985). CES concentrations have never been determined for these drugs. Rifampicin has often been used to treat neurosurgical shunt infections (McLaurin & Frame, 1987); however, its place in treatment of other
neuro-Table. Concentration of rifampicin in the serum, brain tissue and cerebral extracellular space of rats
Mean rifampicin concentration
(mg/L)±s.E. 3-7 h after % of serum 100 mg/kg ip, n = 5 concentration Serum Brain tissue CES* CES** 80-30 ±4-97 10-25 ±2-51 0-8O±O-15 0-27 ±0-04 100 13 1 0-3
CES*, Cerebral extracellular space values as determined by low-flow experiments (n = 5).
CES**, Cerebral extracellular space values as determined by equilibrium experiments (n = 3).
Rifampkin in cerebral extracellular space 735
-0-4
0 0 0 1 0-2 0-3 0-4 0-5 Rifampicin concentration of perfusate (mg/L)
Figure 3. Concentration of rifampicin in the cerebral extravascular space (CES) as determined by equilibrium experiments. In three different experiments 100 mg/kg rifampicin was injected ip. The probes were perfused with 0-25 and 0-50 mg/L solution of rifampicin, respectively, at a constant flow rate of 2 /iL/min resulting in 120 /iL dialysate after 1 h. Each line represents one rat. The intercept of each line with the zero line indicates equilibrium, i.e. equal concentration of inner and outer medium. At this intercept, the rifampicin concentration in the CES can be determined from the x-axis. The concentrations are 0-34 ( • ) . 0-28 ( • ) and 0-20 ( • ) extrapolated) mg/L.
surgical infections and of brain abscesses is not clear. Since MIC9 0 values of rifampicin for S. aureus, S. epidermidis and most streptococci are very low (0-015-0-12 mg/L), this drug seems to be a promising candidate for these indications (Thornsberry et al., 1983). In man, a standard dose of rifampicin 600 mg results in a peak serum concentration of 10 mg/L (Acocella, 1983). With higher doses the peak concentration increases disproportionately. The elimination half-life increases with dose and reaches 5 h for a dose of 15 mg/kg (Acocella, 1983). The very slow elimination from serum which we observed (Figure 2) may be due to delayed resorption from the peritoneum, increase of the half-life after higher doses (Acocella, 1983), and enterohepatic recirculation. After the administration of rifampicin 100 mg/kg iv, the elimination half-life was only 100 min (data not shown).
Recovery of rifampicin from the microdialysis probe in vitro was linear. This is not the case for all substances (Landolt et al., 1991). We then measured CES concentration in vivo by the low-flow method. With this method, measured concentrations have to be corrected for recovery based on the data obtained in vitro, but with the equilibrium method (Lonnroth et al., 1987) there is no such factor for correction. When there is no change in the concentration of substance in the inner medium, then it is equal to the concentration in the outer medium. This potentially more accurate method can only be applied when the range of the expected concentration is known. Therefore, the rifampicin values in the CES, as determined by the equilibrium method (0-27 mg/L compared with 0-8 mg/L), probably give a better reflection of true CES levels. There is a
736 T. Mindermann et al.
striking difference between the rifampicin concentrations in the different compartments within the brain. In the absence of inflammation, neither whole brain tissue concentra-tion (Table) nor CSF concentraconcentra-tions (Conforti et al, 1971; Nau et al, 1992) seem to reflect the very low rifampicin concentrations we found in the CES. It is surprising that the rifampicin concentrations in the CES were only 8% (low-flow experiment) or 3% (equilibrium experiment) of the brain tissue concentrations. However, these results are not an artefact due to the absorption of rifampicin to the dialysis probe, since the recovery from the probe did not change over a 12 h period (unpublished observations), and if there had been significant absorption to the probe the equilibrium experiment would have given higher recovery than the low-flow experiment. In spite of high rifampicin concentrations in the CSF compartment (22% of simultaneous serum values) (Nau et al, 1992), our results suggest low rifampicin concentration in the CES might be inadequate to treat some infections. This might explain why patients treated for tuberculous meningitis still can develop cerebral tuberculomas (Lees, MacLeod & Marshall, 1980). Presumably, the majority of rifampicin in the brain must be intra-cellular or bound strongly to cells. To summarize, penetration of rifampicin into the CES is very poor and is not reflected by concentration measured in CSF or tissue homogenate. Rifampicin is only moderately toxic in higher concentrations (Wong et al, 1984; Gross & Dellinger, 1988) and, therefore, it might be worthwhile considering a higher dosage than recommended for treatment of life-threatening brain infections caused by susceptible pathogens.
References
Acocella, G. (1983). Pharmacokinetics and metabolism of rifampicin in humans. Reviews of Infectious Diseases 5, S428-32.
Benveniste, H. (1989). Brain microdialysis. Journal of Neurochemistry 52, 1667-79.
Benveniste, H. & Huttemeier, P. C. (1990). Microdialysis - theory and application. Progress in Neurobiology 35, 195-215.
Conforti, P., Cambria, S., Magaudda, P. L. & Pennisi, L. (1971). Diflusione antibiotica nei tessuti del sistema nervoso centrale. Minerva Neurochirurgica 15, 192-200.
De Louvois, J., Gortvai, P. & Hurley, R. (1977). Antibiotic treatment of abscesses of the central nervous system. British Medical Journal 2, 985-7.
Gross, D. J. & Dellinger, R. P. (1988). Red/orange person syndrome. Cutis 42, 175-7. Kaplan, K. (1985). Brain abscess. Medical Clinics of North America 69, 345-360.
Landolt, H., Langemann, H., Lutz, T. & Gratzl, O. (1991). Non-linear recovery of cysteine and glutathione in microdialysis. In Monitoring Molecules in Neuroscience. Proceedings of the fifth International Conference on in Vivo Methods, Groningen, The Netherlands, 1991,
pp. 63-5. University Centre for Pharmacy, Groningen.
Lees, A. J., MacLeod, A. F. & Marshall, J. (1980). Cerebral tuberculomas developing during treatment of tuberculous meningitis. Lancet i, 1208-11.
Lonnroth, P., Jansson, P.-A. & Smith, U. (1987). A microdialysis method allowing characterization of intercellular water space in humans. American Journal of Physiology 253, E228-31.
McLaurin, R. L. & Frame, P. T. (1987). Treatment of infections of cerebrospinal fluid shunts. Reviews of Infectious Diseases 9, 595-603.
Nau, R., Prange, H. W., Menck, S., Kolenda, H., Visser, K. & Seydel, J. K. (1992). Penetration of rifampicin into the cerebrospinal fluid of adults with uninflamed meninges. Journal of Antimicrobial Chemotherapy 29, 719-24.
Tshefu, K., Zimmerli, W. & Waldvogel, F. A. (1983). Short-term administration of rifampin in the prevention or eradication of infection due to foreign bodies. Reviews of Infectious Diseases 5, S474-80.
Rifarapicin in cerebral extracellular space 737
Thornsberry, C , Hill, B. C , Swenson, J. M. & McDougal, L. K. (1983). Rifampin: spectrum of antibacterial activity. Reviews of Infectious Diseases 5, S412-7.
Weber, A., Opheim, K. E., Smith, A. L. & Wong, K. (1983). High-pressure liquid chromatographic quantitation of rifampin and its two major metabolites in urine and serum.
Reviews of Infectious Diseases 5, S433-9.
Wong, P., Bottorff, M. B., Heritage, R. W., Piercoro, J. J. & Rodgers, G. C. (1984). Acute rifampin overdose: a pharmacokinetic study and review of the literature. Journal of Pediatrics 104, 781-3.