HAL Id: hal-01393396
https://hal.archives-ouvertes.fr/hal-01393396
Submitted on 7 Dec 2016HAL is a multi-disciplinary open access archive for the deposit and dissemination of sci-entific research documents, whether they are pub-lished or not. The documents may come from teaching and research institutions in France or abroad, or from public or private research centers.
L’archive ouverte pluridisciplinaire HAL, est destinée au dépôt et à la diffusion de documents scientifiques de niveau recherche, publiés ou non, émanant des établissements d’enseignement et de recherche français ou étrangers, des laboratoires publics ou privés.
How Should Iron and Titanium be Combined in Oxides
to Improve Photoelectrochemical Properties?
Sarah Petit, Sigismund T.A.G. Melissen, Loraine Duclaux, Moulay T.
Sougrati, Tangui Le Bahers, Philippe Sautet, Damien Dambournet, Olaf
Borkiewicz, Christel Laberty-Robert, Olivier Durupthy
To cite this version:
Sarah Petit, Sigismund T.A.G. Melissen, Loraine Duclaux, Moulay T. Sougrati, Tangui Le Bahers, et al.. How Should Iron and Titanium be Combined in Oxides to Improve Photoelectrochemical Properties?. Journal of Physical Chemistry C, American Chemical Society, 2016, 120 (43), pp.24521 - 24532. �10.1021/acs.jpcc.6b05794�. �hal-01393396�
How Should Iron and Titanium be Combined in
Oxides to Improve Photoelectrochemical Properties?
Sarah Petit1, Sigismund T.A.G. Melissen2, Loraine Duclaux1, Moulay T. Sougrati3, Tangui Le Bahers2, Philippe Sautet†2, Damien Dambournet4, Olaf Borkiewicz5, Christel Laberty-Robert1,
and Olivier Durupthy*1
1 Sorbonne Universités, UPMC Univ Paris 06, CNRS, Collège de France, Laboratoire de Chimie de la Matière Condensée de Paris, 4 place Jussieu, 75005 Paris, France.
2 Université de Lyon, CNRS, École Normale Supérieure de Lyon, Université Claude Bernard Lyon 1, Laboratoire de Chimie, UMR 5182
46 Allée d’Italie, 69342 Lyon CEDEX, France
3 ICGM – UMR5253 – Equipe AIME, Université Montpellier II, 2 Place Eugène Bataillon – CC1502, 34095 Montpellier CEDEX 5, France.
4 Sorbonne Universités, UPMC Univ Paris 06, CNRS, UMR 8234, PHENIX, F-75005 Paris, France
5 X-ray Science Division, Advanced Photon Source, Argonne National Laboratory, Argonne, Illinois, USA
ABSTRACT
We discuss here for the first time how to combine iron and titanium metal ions to achieve a high photo-electrochemical activity for TiO2-based photo-anodes in water splitting devices. To do so,
a wide range of photoelectrode materials with tailored Ti/Fe ratio and element vicinity were synthesized by using the versatility of aqueous solgel chemistry in combination with a microwave-assisted crystallization process. At low ferric concentrations, single phase TiO2
anatase doped with various Fe amounts were prepared.Strikingly, at higher ferric concentrations, we observed the concomitant crystallization of two polymorphs of Fe2TiO5. The as-synthesized
compounds were tested as photoelectrode and compared with pure nanoparticles of TiO2,
Fe2TiO5 and α- or γ-Fe2O3 and with corresponding nanocomposites.When TiO2 is slightly doped
by Fe, the performance of this photo-electrode improves particularly in the low-bias region (< 1.0 V vs. reversible hydrogen electrode.) The photoanode exhibits a higher photocurrent than nanocomposite with TiO2/Fe2O3 and FeTi2O5, and more cathodic onset potential. The former can
be partly explained by a lower bandgap and a hole with a longer lifetime. For the latter, we propose that the nature of the heterojunction impacts charge carrier recombination. The results presented herein not only answer whether iron and titanium should be combined in the same structure or into heterostructured systems, but also on the importance of the arrangement of ions in the structure to improve the performances of the photoanode.
1. Introduction
One of the grand challenges for the 21st century is to secure the availability of energy on
demand on the terawatt scale. Moreover, environmental concerns result in the need for renewable energy sources to satisfy this demand. The direct photoelectrochemical (PEC) conversion of solar energy into storable fuels, which is based on cheap and earth-abundant semi- conductors and catalysts, has the potential to satisfy these requirements.1-6 Metal-oxide
semiconductors are particularly appealing candidates for practical applications because of their low cost, nontoxicity, abundance, and stability toward corrosion.
For application in a water splitting device, a semiconductor must fulfill several requirements based on the microscopic steps involved in the working principle. First, the semiconductor must absorb sunlight efficiently to create an exciton. This property is governed by the bandgap (Eg) and the absorption coefficient (α). Then, the exciton is dissociated yielding a free electron and a free hole. Spontaneous dissociation is facile if the exciton binding energy (Eb) in the material is lower than the thermal energy at room temperature (25 meV). These free charges must diffuse toward the active sites for catalysis. The diffusion of charge carriers is characterized by the electron and hole mobilities (μ), which are themselves related to the effective masses of the charge carriers (m*). Then, the valence band (VB) and conduction band (CB) must be positioned such, that they straddle the redox potentials of the target reactions. 7, 8 If the active sites are on
another material, the band positions must be adapted to allow the charge transfer between the two systems thermodynamically. The efficiency of this final step is not only governed by bulk properties of the semiconductor, but also by the electronic structure of the interface. In addition to these requirements on the microscopic properties of the bulk or the interface, other more
general constraints must be satisfied, such as the chemical stability in working conditions and the low cost of the materials.
Among the different materials already tested,9 TiO
2 and Fe2O3 have attracted a lot of attention in
PEC water splitting applications, since they fulfill several of these requirements.10-12 TiO 2 has
been the first material tested for water oxidation.13, 14 The TiO
2 absorption edge is 3.2 eV,
allowing only 4% of the incident solar energy to be absorbed at best.14-16 Its CB lies slightly
above the hydrogen evolution redox potential, potentially decreasing the onset potential. The electron mobility of TiO2 in a nanoparticle (NP) film is about 0.01 cm2·V-1·sec-1, which is low
compared to the mobility observed in monocrystals of 1 cm2·V-1·sec-1.17 Accordingly, TiO 2
suffers from two major limitations which compromise high photon-to-hydrogen conversion efficiency: its wide bandgap and its fast electron–hole recombination. Lately, hematite has emerged as a more promising material due to its suitable bandgap of 2.1 eV, which corresponds to a maximum theoretical air mass 1.5 global (AM 1.5 G) photocurrent density of 12.3 mA·cm -2.18 Hematite also has an excellent chemical stability in a broad pH range and is naturally
abundant, nontoxic and cheap. The hematite conduction band minimum (CBM) and valence band maximum (VBM) are located at -0.3 V and 1.7 V vs. reversible hydrogen electrode (RHE) at pH = 0, respectively.8, 10 However, the reported water oxidation efficiencies for hematite to
date are notoriously lower than the predicted maximum value despite intense efforts.18 This is
caused by two principal limiting physical properties: the short lifetime of the photogenerated charge carriers (≤ 10 ps), and the low mobility of the minority carriers (0.2 cm2·V-1·sec-1).18 The
combined effect is that the minority carrier (hole) diffusion length is only 2-4 nm, whereas full absorption of the incident light requires much thicker films due to the indirect nature of the bandgap (the penetration depth of light is ~118 nm at a wavelength of 550 nm).18
This short literature overview underlines that no single material, whether Fe2O3 or TiO2,
fulfilled all the criteria for efficient water oxidation. To overcome these intrinsic shortcomings, different approaches have been explored in the literature. For example, the modification of the TiO2 surface with a small bandgap semiconductor has been proven to enhance the photocatalytic
activity.19, 20 Another approach consists of tuning the optical and photoelectrochemical (PEC)
properties by element doping.21 For example, ferric doping of TiO
2 lowers the bandgap from 3.2
to 1.9 eV, depending on the Fe content and the synthesis procedure.22, 23 However, high doping
levels often lead to heterogeneous materials.24, 25 Their functionality is then the result of both the
bulk properties of the various components and their interface properties. We note that some reports in the literature highlight the benefit of designing heterojunctions to enhance the charge separation.25-28 However, none of them studied together the impact of doping level, atoms
ordering and heterostructures formation in the Ti-Fe-O system get high photo(electrochemical) efficiency.
All in all, good photoelectrode material must contain i) a bulk semi-conductor structure that efficiently harvests photons and allows their conversion into mobile charge carriers, titanium oxide structures being particularly efficient in that case; ii) appropriate surface catalytic sites, iron (III) being a priori better suited. The issue that is still to be answered is the elements mixing level coupled with the doping level that provide the best results. In other words, can Fe2TiO5
alone fulfill those conditions, is a low iron doping of titanium oxide enough or is it mandatory to combine metal oxide nanoparticles with completely different chemical compositions?
The goals of this article are to provide original syntheses of Ti-Fe-O nanomaterials with the iron and the titanium atoms combined in the same structure or into heterostructurated nanocomposites
for water oxidation. The huge versatility of aqueous sol-gel chemistry and more precisely that of iron and titanium metal ions is the perfect toolbox to prepare a wide range of photoelectrode materials with tailored Ti/Fe ratio and element vicinity. We have prepared single phase TiO2
-anatase (TiO2-A) doped with various amounts of ferric ions, Fe2TiO5 nanoparticles featuring two
structural arrangements, i.e. a heterostructured system. We have also mixed phase pure NPs of TiO2, Fe2TiO5 and Fe2O3 hematite or maghemite to test their efficiency as photoelectrode
material.
The PEC activities of the different pure phase and heterostructured systems were recorded and rationalized according to the known relative position of electronic bands and the charge dynamics in the different components. Additionally, an extensively tested theoretical approach 29-33 was invoked to provide key data on the bulk properties of the different pure semi-conductors.
This study is the first complete study on the PEC activity of the whole Fe-Ti oxide composition range.
The manuscript is organized as follows. The methodology section is dedicated to the presentation of the experimental and computational details. In the first part of the results, the Density Functional Theory (DFT) calculations of the main TiO2, Fe2O3 and Fe2TiO5 phases will be
presented in order to understand the ability of these materials in water splitting devices. Subsequently, structural and morphological characterizations of the different synthesized systems are presented. The PEC activities are then determined for each material. Finally, in a discussion confronting both theoretical and experimental results we explain the relative efficiency of the different systems.
2.1 Experimental setup 2.1.1 Nanoparticle syntheses
Preliminary studies have been performed with all the combinations of Fe(II)/(III) and Ti(III)/(IV) precursors in order to form mixed oxides. The best results were achieved with Fe (III) salts and Ti (IV) precursors.
The combination of Fe(III) and Ti(IV) oxides was created according to two different synthetic pathways. First, a crystallite structure involving both metal ions was obtained from the sol-gel reaction of the corresponding salts in aqueous solution. Alternatively, the composites were obtained through the grinding of a mixture of pure nanoparticles of TiO2, Fe2TiO5, α-Fe2O3 and
γ-Fe2O3. The initial particles were synthesized through a microwave assisted process described
below.
TiO2 anatase. TiO2 particles were obtained through the hydrothermal treatment of an aqueous
TiCl4 solution with a pH set to 6 according to a previously described method.34 A stock solution
with Ti(IV) ion concentration of 1.0 mol·L-1 was prepared by dilution of TiCl
4 in HCl (3 mol·L -1) solution. Then, 100 mL of the stock solution were introduced in 200 mL of Milli-Q water, the
pH was set to 6 by addition of sodium hydroxide solution ([NaOH] = 3 mol·L-1) and the sample
volume was increased to 500 mL with Milli-Q water to obtain a Ti(IV) ion concentration of 0.2 mol·L-1 in the reacting medium. A white sol immediately appeared; aliquots of this suspension
were transferred in Teflon cups and heated in autoclaves for 1 h at 200 °C using a microwave oven (Synthos3000, Anton Paar). The resulting precipitate was collected by centrifugation, washed twice with water, then with nitric acid ([HNO3] = 3 mol·L-1) and at least one additional
Fe doped TiO2 anatase. The former protocol was slightly modified to introduce various amounts of Fe (III) in the final product. The total metal ion concentration was maintained at 0.2 mol·L1 and the targeted Fe(III) atomic ratio was varied between 5 and 66 %. The
appropriate amount of the Ti(IV) stock solution and solid ferric nitrate nonahydrate (Fe(NO3)3·9H2O) were introduced in 200 mL of Milli-Q water to form a clear yellow solution.
Sodium hydroxide solution ([NaOH] = 3 mol·L-1) was then added to adjust the pH to 2-6 and the
sample volume was increased to 500 mL with Milli-Q water. A brownish precipitate is obtained, hydrothermally treated in the microwave oven and washed the same way as the pure TiO2
sample. The samples obtained with a pH of the reacting medium of 6 are denoted by acronyms indicating the added iron content in at.%, for example TiO2-10%Fe. For reacting media with
other pH values, this is indicated at the end of the sample name.
Fe2TiO5. Fe2TiO5 nanoparticles used for the mixing were obtained according to the former
protocol with a well-defined set of parameters. The metal precursors were introduced with a relative Ti:Fe atomic ratio of 1:1 and the pH of the reactive medium was fixed at 6 with NaOH.
α-Fe2O3 Hematite. The preparation protocol is similar to that of iron doped titania particles, except that Fe(NO3)3 is the only metal ion source used and the pH of the reacting medium was
not fixed with NaOH solution. The hydrolysis of the ferric precursor acidified the aqueous solution to a pH of around 2. A reddish precipitate was obtained.
γ-Fe2O3 Maghemite. The particles were synthesized according to an earlier published method using microwave assisted heating in order to reduce the aging time.35 First, 50 mL of a 0.05
mol·L-1 ferrous solution prepared from FeSO
4·7H2O and 100 mL of a 0.05 mol·L-1 ferric
solution prepared from FeCl3·6H2O were mixed together. Then, the pH of the reacting medium
solution was heated in a microwave oven for 25 min at 150 °C. Finally, the dark brown precipitate was washed twice with water and dried under air flow.
2.1.2 Nanoparticle Characterizations
UV-visible diffuse reflectance spectra (DRS) of the samples were recorded on a Varian-Cary 5000 spectrometer with integrating sphere from 300 to 800 nm. Powder X–ray diffraction (XRD) measurements were performed with a Brücker D8 X-ray diffractometer operating in the Bragg-Brentano reflection mode using Cu K radiation. The data were collected in the 20 – 80° 2 range with 0.02° steps and a counting time of 5 s per step. Transmission electron micrographs (TEMs) were obtained using a Tecnai spirit G2 apparatus operating at 120 kV. Samples were prepared by evaporating dilute suspensions in ethanol onto carbon-coated grids. Relative iron and titanium atomic composition of the samples was determined with a scanning electron microscope (Hitachi S-3400N) equipped with energy-dispersive X-ray spectroscopy (EDX, Oxford Instruments - X-max).
Total scattering data were collected at the 11-ID-B beamline at the Advanced Photon Source at Argonne National Laboratory, using high energy X-rays (λ = 0.2128 Å) to high values of momentum transfer Qmax = 22 Å-1.36, 37 One-dimensional diffraction data were obtained by
integrating the raw 2D total scattering data in Fit2D.38 Pair distribution functions (PDFs) G(r)
were extracted from the background and Compton scattering corrected data following Fourier transform within PDFgetX2.39 The PDFs were subsequently modeled using PDFgui.40
2.1.3 Film preparation
As photoanode, we synthesized 30 m mesoporous films (cf. Figure SI-1) by tape casting. 37 wt.% of the inorganic powders was dispersed in ethanol with 5 wt.% of ethylene glycol and 0.5 wt.% of Triton X. The ethanol suspensions were mixed in an ultrasonic bath for ½ h before
deposition. The ethanol suspensions were then deposited directly onto a fluoride tin oxide (FTO) substrate to yield homogeneous thick films. The substrates used are TEC-15 FTO-coated glass (15/sq, Asahi, Co). After the deposition, the thick-films were annealed for 3 min. at 300 °C in air to decompose the organic material and to further improve the particle-particle contact.
2.1.4 Photo-electrochemical characterizations
PEC characterization was carried out in an aqueous solution 1 mol·L-1 NaOH (pH = 14). The
solution was purged with nitrogen prior to and during the measurements to remove any dissolved oxygen. The working area of the electrodes exposed to the electrolyte was 28.5 mm2 for all
samples. The potential of the working electrode was controlled by potentiostat (Modulab, Ametek). In three-electrode measurements, a Pt wire and an Ag/AgCl electrode (Asashi, saturated AgCl solution) were used as the counter and reference electrodes, respectively. Cyclic voltammetry measurements were performed with a scan rate of 20 mV·s-1. Light photocurrent
measurements were performed using the visible range of a 300 W Xe-Lamp (Oriel and a UV filter with a 400 nm wavelength cutoff) providing a power density of 300 mW.cm-2 at the surface
of the electrode. Electrical contact to the sample was made using a copper tape. For the cyclic voltammograms represented below, the potentials are referenced to RHE according to the following equation:
E (V/RHE) = E (V/Ag/AgCl) + E°Ag/AgCl + 0.059 pH. (1)
2.2 Computational details
2.2.1 Density Functional Theory (DFT) Calculations
Geometry optimizations and frequency calculations were performed using the CRYSTAL14
code, due to its efficiency when doing calculations with hybrid functionals using Gaussian Type Orbitals.41, 42 All optimized structures were characterized as minima on the potential energy
surface by vibrational analysis. The all-electron 86-411G(2d) basis sets for Fe43 and Ti44 and an
8-41G(d) basis set for O were used.44 All calculations, except for electronic structure
calculations, were performed using the hybrid PBE0 functional,45 using an 884 K-point
mesh46 for Fe
2TiO5 and a 121212 mesh for α–Fe2O3. Electronic structure calculations were
performed with a 10106 mesh for Fe2TiO5 and a 242424 mesh for α–Fe2O3 and using
the range-separated HSE06 functional47, 48 with ω = 0.11 a
0-1,49 based on its positive comparison
in terms of speed and accuracy with other hybrid functionals found here and reported earlier.50-52
(HSE06 reduces to PBE0 when setting ω to zero.) The dielectric constant εr is the sum of a
vibrational contribution εvib and an optical contribution ε∞. The first term εvib was computed
invoking the harmonic approximation to the lattice potential, with infrared intensities calculated using the Berry phase method.53 The second term was computed using the Coupled-Perturbed
Kohn-Sham (CPKS, although sometimes the acronym CPHF is used) approach.54-56 The
individual terms were calculated by taking the geometric mean of the diagonal elements of the (diagonalized) dielectric tensors.57
2.2.2 Bulk properties calculations
The bulk properties computed to understand the semiconductors' capacities for photocatalytic reactions are the bandgap (noted Eg), the dielectric constant (noted εr), the effective masses (noted m*) and the exciton binding energy (noted Eb). The way to compute all these properties were presented in the following article52 and used to compute properties of several families of
semiconductors including oxides, sulfides, nitrides and halides. It can just be reminded that first the total dielectric constant (εr) is the sum of the electronic (ε∞) and the vibrational contribution (εvib) and then the exciton binding energy is computed in the framework of the Wannier model using the average values of m* and εr. This model is generally well adapted for delocalized
excitons (large dielectric constant and low effective masses), which is usually the case for inorganic semiconductors.
3 Results and discussion
3.1 Bulk properties of the semiconductors
The materials used for the work presented in this manuscript fulfill several requirements of the bulk semiconductors properties presented in the introduction. This verification has been performed using the DFT calculations presented here.
Geometry optimizations. α–Fe2O3 (crystallographic cell in Figure 1a) was optimized in the 𝑅3̅𝑐
geometry as given by Adelstein et al.,58 using the conventional Anti-Ferromagnetic (AFM) spin
configuration, reducing the symmetry to 𝑅3̅.59 TiO
2 (crystallographic cell in Figure 1b) was
optimized in the anatase structure at the same level of theory as in a previous publication.52 For
Fe2TiO5 (space group: Ccmm), the orthorhombic pseudo-brookite structure with ordered
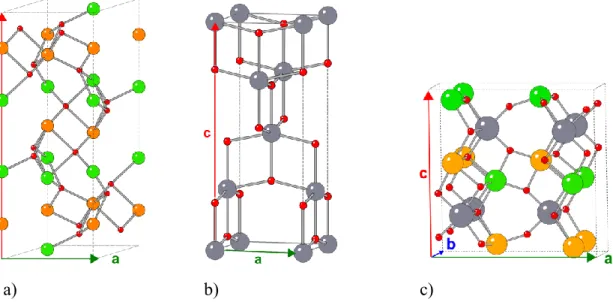
distribution of Fe was chosen and several spin isomers were investigated, since the exact spin state of the Fe(III) atoms is unknown. Figure 1c presents the structure of the most stable spin state found for Fe2TiO5. This is an anti-ferromagnetic spin state (AFM). The calculations
revealed that several spin states (all AFM) are close in energy (see supporting information for more details). The ferromagnetic structure was significantly less stable (~1.1 eV/unit cell) than the AFM ones. The cell parameters of all the semiconductors are presented in Table 1. The larger discrepancy on a cell parameter between DFT and experiment is around 1.05%, which is the standard discrepancy at this level of theory.
α-Fe2O3 TiO2 Fe2TiO5 a / Å b / Å a / Å b / Å a / Å b / Å c / Å
Expt'l 5.04 13.77 3.78 9.51 9.79 3.73 9.98 Calc'd 5.04 13.70 3.77 9.61 9.86 3.75 9.90
Table 1. Experimental and computed cell parameters of α-Fe2O3, TiO2, and Fe2TiO552, 60, 61
a) b) c)
Figure 1: Representation of the conventional crystallographic cells of (a) α-Fe2O3, (b) TiO2, and
(c) Fe2TiO5. Red, grey, orange and green atoms correspond to O, Ti, Fe (spin up) and Fe (spin
down) atoms respectively.
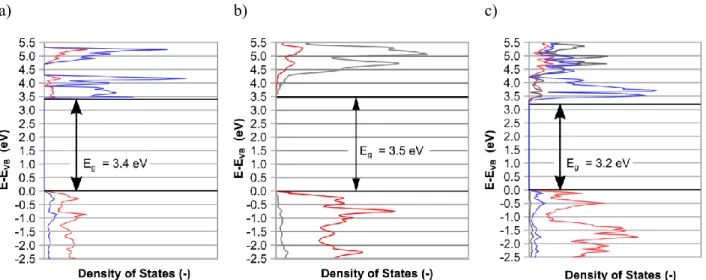
Electronic properties. The density of states (DOS) of the compounds are presented on Figure 2.
It appears that the valence bands is largely made up of the O atoms' orbitals while the conduction bands originate from Fe orbitals for α–Fe2O3 and Fe2TiO5 and from Ti atoms for TiO2. All
relevant computed properties for photocatalysis are presented in Table 2. While the bandgap computed for TiO2 is relatively close to the experimental one, the Eg computed for Fe-containing
semiconductors is overestimated.62 Unfortunately, this is the expected behavior when hybrid
functionals are applied to materials having partially filled d-orbitals. A GGA+U approach63
properties explaining the choice for hybrid functionals as a compromise. About the effective masses, for α–Fe2O3, values for me of ~3.5 were found, whereas for mh values of ~1 were found,
consistent with findings in the literature64, 65 that attribute the heavy electron mass to the strong
localization of the VB on O,10 confirming our approach. The anisotropy of the charge carrier
mobilities in α–Fe2O3 can be explained by Hund’s rule,10 that hinders charge carrier mobility in
the [001] direction, where the spins are antiferromagnetically coupled. The effective mass in TiO2 is much lower, especially for the electrons because of a better delocalization in the
conduction band. Fe2TiO5 has an intermediate behavior between TiO2 and α–Fe2O3.
a) b) c)
Figure 2. Computed DOS projected on the atoms of (a) α-Fe2O3, (b) TiO2, and (c) Fe2TiO5. The
red, grey and blue colors correspond to the projection on O, Ti and Fe atoms respectively. For magnetic compounds, only the DOS of one spin is presented since both spins are symmetric.
Excitonic properties. The dielectric constants are relatively high, mainly because of the
vibrational contribution, stemming from the materials’ ionicity. As for the effective mass, the dielectric constant of Fe2TiO5 is intermediate between the ones of α-Fe2O3 and TiO2. Combining
the effective masses and the dielectric constants, the exciton binding energy is very different between the three materials. For α-Fe2O3, Eb is larger than room thermal energy meaning that the
exciton is relatively difficult to dissociate while for the two other compounds, the exciton should dissociate easily at room temperature.
α-Fe2O3 TiO2 Fe2TiO5
Eg (eV) 3.4 3.4 3.2
𝒎𝒆⊥,∥ (me) 3.30, 3.54 0.69, 0.06 0.98, 0.96
𝒎𝒉⊥,∥ (me) 1.01, 1.19 1.13, 0.15 1.36, 1.59
𝜺𝒓 {𝜺∞, 𝜺𝒗𝒊𝒃} 16.5 {5.7, 10.8} 32.0 {5.8, 26.2} 21.2 {6.3, 14.8}
Eb (meV) 41 3 18
Table 2: DFT computed electronic properties α-Fe2O3, TiO2, and Fe2TiO5.
These calculations and the experimental data available clearly highlight their interest for this work. The strength of TiO2 is in its very good electronic properties, except for the bandgap.
Contrary to TiO2, hematite has a very adapted bandgap but is unadapted in terms of the other
electronic properties. Finally, Fe2TiO5 has intermediate properties, inheriting the well-adapted
bandgap from α-Fe2O3 and the good electronic properties from TiO2. For these reasons, it is
interesting to study experimentally the PEC properties of each material individually as well as in combination with the others.
3.2 Experimental Results
3.2.1 Nanoparticle characterizations
Aqueous solution chemistry of Ti(IV) and Fe(III) metal ions is now rather well understood when studied separately.66-73 Much less is known about the ternary Ti-Fe-O diagram when
dealing with nanoparticle synthesis in water.74-76 In the 2-6 pH range, both metal ions first form
an amorphous or very poorly organized hydroxide precipitate. Consequently, we used a subsequent microwave assisted hydrothermal treatment to enable the oxide crystallization. pH values strongly impact the nature of the stabilized phase. Particularly, low pH yields phase mixtures containing brookite and anatase polymorphs (cf. Table SI-1). In the following, we focused on samples prepared at pH 6 and monitored the structural dependence on the iron content.The obtained crystallized compounds were analyzed by XRD analysis. The evolution of the XRD patterns as a function of the Fe content is shown in Figure 3.
Figure 3: X-Ray diffraction patterns of pure phase TiO2 anatase α-Fe2O3 and γ-Fe2O3, and TiO2
-x%Fe composites.
X-ray diffraction analysis shows a strong structural dependence on the iron content as well as broad lines indicating the formation of nanosized particles. The TiO2 rutile structure was
observed in none of the experiments, which is in good agreement with published resultsd.77 For
low iron contents, i.e. < 10%, only TiO2 anatase could be detected as crystalline phase.
10 20 30 40 50 60 70 Anatase TiO 2-5%Fe TiO 2-10%Fe TiO 2-16.5%Fe TiO 2-33%Fe TiO 2-50%Fe TiO 2-66%Fe Hematite Maghemite 22 23 24 25 26 27 28 Anatase TiO 2-5%Fe TiO 2-10%Fe TiO 2-16.5%Fe TiO 2-33%Fe TiO 2-50%Fe TiO 2-66%Fe
Increasing the Fe ratio renders the phase identification more complex owing to numerous phases occurring in the Ti-Fe-O system. Moreover, iron doping has shown to favor the brookite TiO2
polymorph at the expense of the anatase.22, 26 For %Fe higher than 10, XRD patterns strongly
evolve, indicating a phase transition which becomes more obvious in TiO2-33%Fe. A peak at
around 18° (2) appears which can be assigned to orthorhombic Fe2TiO5 which has a
pseudo-brookite structure and eventually to a monoclinic polytype Fe2TiO5.78, 79 Nevertheless, for the
latter, the main line is absent from the XRD pattern. While increasing the Fe ratio to 50% seems to enable the preparation of a single phase of orthorhombic Fe2TiO5, the absence of the
monoclinic variety cannot be completely ruled out. Moreover, pure Fe2TiO5 is expected in TiO2
-66%Fe only. However, with that iron ratio, hematite is clearly detected by XRD.
Structural analyses were further conducted using synchrotron X-ray (λ = 0.2128 Å) scattering measurements from which we obtained the pair distribution function (PDF). PDFs are indeed particularly well adapted to study nanostructured materials as they provide a histogram of all the atom-atom (pair) distances within the sample independently of its crystalline state.80
The PDF of TiO2-50%Fe was fitted using different structural models of Fe2TiO5
(orthorhombic pseudo-brookite with random Fe distribution in the metal sites61 or ordered
monoclinic structure78). The fitting using solely the pseudo-brookite type structure largely failed
in reproducing the PDF data. A good fit to the PDF data was only obtained using the two polymorphs of Fe2TiO5. The goodness of the fit could be further increased to Rw = 21.6 % [1-20
Å] by the addition of a third minor phase consisting of TiO2 anatase (Figure 4). The
contributions of the orthorhombic and monoclinic phases of Fe2TiO5 to the PDF data (Figure 4)
Figure 4. PDF refinement of TiO2-50%Fe (Rw = 21.6 %). Individual PDF contributions of the
pseudo-brookite and ordered phase of Fe2TiO5 (black curves) extracted from the refinement.
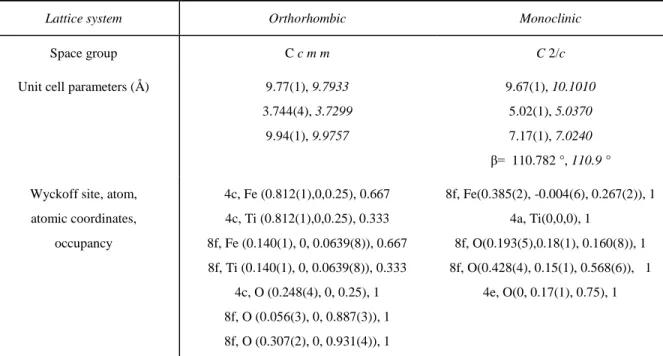
The structural parameters of Fe2TiO5 phases obtained by PDF refinement and their polyhedron
representations are presented in Table 3 and Figure SI-2a respectively. The starting structural models of both Fe2TiO5 polytypes were based on structures resolved by Grey and Drofenik for
the orthorhombic and monoclinic phases, respectively.78, 79 The atomic occupancy was fixed to
initial values due to the similar X-ray scattering intensity of iron and titanium atoms. The orthorhombic structure is composed of randomly distributed TiO6 and FeO6 octahedra featuring
an edge-sharing configuration. In the monoclinic phase, iron and titanium occupy the 8f and 4a Wyckoff sites, respectively, forming a network with both edge and corner-sharing octahedra. While unit cell parameters of the pseudo-brookite match those of literature data (within the
estimated standard deviation), those of the monoclinic structure significantly deviate from the reference sample (cf. values in italics in Table 3) obtained by the high-temperature solution method as reported by Drofenik.79 The resulting changes in unit cell parameters explained the
difficulty to detect this phase by conventional XRD since the most intense reflections were found to be superposed on the pseudo-brookite reflections. Moreover, the origin of the unit cell parameters variation might be a size effect and/or non-stoichiometry. Quantitative phase analysis deduced from PDF refinement indicates a total occurrence of 61-62% of Fe in contrary to the 50% used in the synthesis protocol, which indicates that (i) some titanium ions did not precipitate and that (ii) samples exhibit non-stoichiometric features.
Lattice system Orthorhombic Monoclinic
Space group C c m m C 2/c
Unit cell parameters (Å) 9.77(1), 9.7933 3.744(4), 3.7299 9.94(1), 9.9757 9.67(1), 10.1010 5.02(1), 5.0370 7.17(1), 7.0240 β= 110.782 °, 110.9 ° Wyckoff site, atom,
atomic coordinates, occupancy 4c, Fe (0.812(1),0,0.25), 0.667 4c, Ti (0.812(1),0,0.25), 0.333 8f, Fe (0.140(1), 0, 0.0639(8)), 0.667 8f, Ti (0.140(1), 0, 0.0639(8)), 0.333 4c, O (0.248(4), 0, 0.25), 1 8f, O (0.056(3), 0, 0.887(3)), 1 8f, O (0.307(2), 0, 0.931(4)), 1 8f, Fe(0.385(2), -0.004(6), 0.267(2)), 1 4a, Ti(0,0,0), 1 8f, O(0.193(5),0.18(1), 0.160(8)), 1 8f, O(0.428(4), 0.15(1), 0.568(6)), 1 4e, O(0, 0.17(1), 0.75), 1
Table 3. Structural parameters of Fe2TiO5 phases obtained by PDF analysis. Values in italics
refer to reference literature data.
PDF refinements conducted on the TiO2-10-to-66%Fe series indicate that both Fe2TiO5
polymorphs can be detected even at low Fe content, i.e. 10%, - both phases are present in almost equal proportions regardless of Fe content. Quantitative Fe content analysis (cf. Figure SI-2c) by
PDF refinement follows the nominal composition used during the synthesis. Slight deviations can be observed at high Fe content which, as mentioned above, can be due to non-stoichiometry. However, the chemical composition measurements determined with Inductively Coupled Plasma Mass Spectrometry (ICP-MS) and EDX on the different samples yielded values very close to the initial ratio with an error below 1 at.%. A recent study has shown that the pseudo-brookite phase may have more Ti than the exact composition Fe2TiO5, without significant conversion of ferric
ions into ferrous ones.81 Indeed, the removal of Fe(III) that lower the 2 to 1 Fe/Ti stoichiometry
can be compensated by oxygen defects. Mössbauer experiments reported in Figure SI-3 confirmed that only ferric ions are present in the material. More precisely, three sites are observed upon deconvolution of the spectrum that can be attributed to the 4c and 8f sites of the orthorhombic structure26, 82 and to the 8f site of the monoclinic one, in good agreement with PDF
data.79
The diffractograms of phase pure TiO2 anatase, α-Fe2O3 (hematite) and γ-Fe2O3 (maghemite)
are also reported in Figure 3 and all diffraction peaks could be indexed according to the corresponding reference cards (JCPDS 00-021-1272, 00-033-0664 and 01-039-1346 respectively). The γ-Fe2O3 maghemite diffractogram resembles that of the γ-Fe3O4 magnetite.
However, the brown color of the sample is in disagreement with a mixed iron oxide and all metal atoms are fully oxidized.
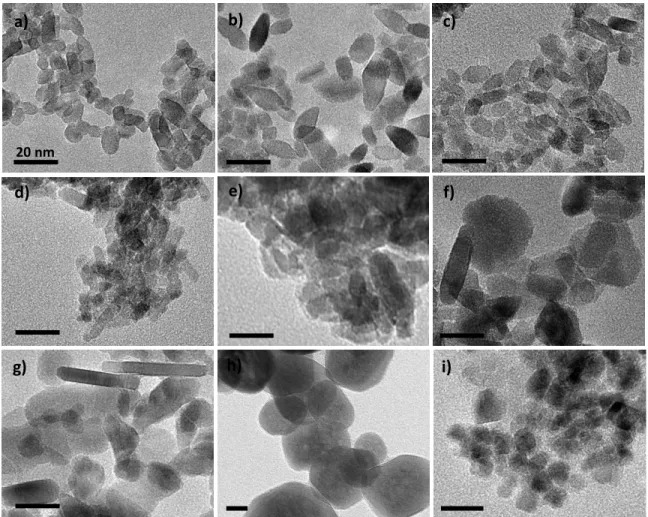
The presence of amorphous or very small crystalline nanoparticles was also studied through TEM. Selected micrographs corresponding to the phase pure samples and the TiO2-x%Fe series
are reported in Figure 5. Micrographs of samples obtained at pH other than 6 are reported in Figure SI-4. The first overview of the TEM images confirms that the particle size is about 20 nm
except for hematite nanoparticle size that is closer to 100 nm. More precisely, the anatase particles with low iron content exhibit two slightly different morphologies: square bipyramids and small rods as already described in a previous article.83 With increasing iron content, the TiO
2
small rods population becomes predominant and the rods' aspect ratio also increases. HRTEM and dark field images confirmed that there is almost no amorphous phase up to 10 at.% Fe. At 16.5 and 33 at.% Fe (figure 5d and 5e), an amorphous or poorly crystalline phase is observed around crystalline anatase nanoparticles. In those two micrographs it is difficult to distinguish pseudo-brookite nanoparticles from anatase ones. The TiO2-50%Fe sample (figure 5f) seems to
present two different nanoparticles morphologies with rods and spheres. However, lattice fringes analyses on HRTEM images reported in Figure SI-5 indicate that the two observed projections may correspond to the same 3D object: a thick disk with the small dimension being parallel to the (010) plane. The mean particle thickness is 10 nm and the mean diameter ~30 nm. Another explanation for the two morphologies may be the presence of two different Fe2TiO5 phases as
observed in PDF analysis. No significant amorphous domains or small crystalline anatase nanoparticles could be detected on TEM micrographs. However, this does not imply that they are necessarily absent in the whole sample as they are detected in the PDF study. At even higher iron content (TiO2-66%Fe in Figure 5g) the pseudo-brookite nano-disks are thinner and larger. In
addition, small quantities of large hematite rhombohedra with a length of about 300 nm can be observed (see Figure SI-6). The hematite nanoparticles synthesized as pure phase do not have that rhombohedral shape, but rather a round shape with sizes ranging from 50 to 300 nm. The maghemite nanoparticles also display a round shape without a clearly exposed family of facets and the particle size distribution is rather monodisperse at 10 nm in diameter.
Figure 5: Transmission electron micrographs of a) pure TiO2, b) TiO2-5%Fe, c) TiO2-10%Fe, d)
TiO2-16,5%Fe, e) TiO2-33%Fe, f) TiO2-50%Fe, g) TiO2-66%Fe, g) α-Fe2O3 and h) γ-Fe2O3. All
micrographs present the same scale bar of 20 nm.
3.1.2 Electrochemical characterization
Pure nanoparticles Fe-doped TiO2 anatase, Fe2TiO5 pseudo-brookite and a mechanical mixture
of TiO2, and/or Fe2O3 and/or Fe2TiO5 were deposited onto FTO substrates to fabricate
photoelectrodes. The synthesis procedure was described in section 2.1.3. and in Figure SI-1 An example of the microstructure created for these photoelectrodes is reported in Figure SI-1. The photoelectrodes are composed of nanoparticles delineating a mesoporous network. The thickness
20 nm
a) b) c)
d) e) f)
determined by cross-section SEM analyses is 30 m. The electrochemical performances of the as-synthesized photoelectrodes of TiO2–based nanoparticles with various iron contents are
studied at pH = 14 in 1 mol·L-1 of NaOH, conditions favorable for water oxidation. First, we
compare the electroactivity to water oxidation of TiO2–based photoelectrodes (TiO2-x%Fe with
x = 2, 10 and 33), as shown in Figure 6. The cyclic voltammogram shows that TiO2-2%Fe has
the lowest onset potential (Von = 0.85 V vs. RHE), while for TiO2-33%Fe a negligible current is
flowing through the cell up to an applied potential of 1.6 V vs RHE. The potential for the water oxidation reaction is at 1.23 V versus RHE, which means overpotentials of 0.5 V and 0.7 V at 200 A·cm-2 for TiO2-2%Fe and TiO2-10%Fe respectively are required. Doping TiO2 with iron
increases the photocurrent mainly at low potential, as can be seen in Figure 6. This observation is consistent with the explanation that the photocurrent is limited by trap states present at the electrode/electrolyte interface.84 For unmodified TiO
2, electrons in the CB may be injected into
the surface states at low potentials while they are more strongly driven away from the surface at higher applied potentials, disabling the electrons from reaching the surface states. Doping TiO2
with iron narrows the band gap, which should favor the photocurrent density (see Figure SI-7a). For 10% and more specifically 2% of Fe doping in TiO2 anatase structure it seems that additional
discrete energy levels were added in the band gap. For higher concentration it is more like a combination of different contributions presenting different bandgap. All in all, the current density for TiO2-2%Fe is ~200 times higher than the one for TiO2, TiO2-10%Fe and TiO2
-33%Fe at 1 V vs. RHE, where 1 V is close to a typical operating voltage when using this anode in conjunction with a single junction amorphous silicon solar cell. The improved JV characteristic is a sign that Fe doping TiO2 is beneficial since its presence enhances the oxidative
Figure 6. JV curve for TiO2-2%Fe (blue), TiO2-10%Fe (green) and TiO2-33%Fe (black and
enlarged in the insert). Dark curves are reported and correspond to dotted lines. Measurements are performed at 20 mV·s-1 and 1 M NaOH, pH = 14.
A more detailed look at the voltamogram at low potentials for TiO2-33%Fe reveals that the
photocurrent increased starting at an onset potential at 0.75 V vs. RHE and that the increase of the photocurrent is more pronounced at higher potential, i.e. 1.6 V vs. RHE. This behavior can be linked to the fact that at low applied potentials (close to flat band potential), a dramatic electron/hole pair recombination is observed, i.e., the photogenerated holes have trouble to reach the semiconductor/electrolyte interface. In our photoelectrodes, sources of recombination are probably the numerous grain boundaries present in the nanostructure. At more positive potentials, the electric field created favors the electron/hole pairs separation, resulting in an increase of the photocurrent.
0 500 1000 1500 2000 0.8 1 1.2 1.4 1.6 1.8 2 J ( A /c m 2 ) V /RHE 0 1 2 3 4 5 0.8 1 1.2 1.4 1.6 1.8 2 J ( A /c m 2) V /RHE
At this point we have compared our best monophasic photoanode TiO2-2%Fe with its
equivalent where Ti and Fe have been precipitated as oxides separately (TiO2 anatase and Fe2O3
hematite) and combine afterwards into a nanocomposite electrode that present the same Fe:Ti atomic ratio of 2:98 (the electrode preparation is detailed in figure SI-1). The diffuse reflectance spectra of the 2% doped TiO2 and of the composite with the same metallic composition are
reported in Figure SI-7b and the two JV curves are reported in Figure SI-8. The light absorption behavior of the composite significantly differs from that of doped TiO2 for it looks like the
superimposition of the anatase and hematite spectra. This means that both oxides absorb light depending on their bandgap without synergetic effect in the heterostructure while Fe doping seems to improve visible light absorbance of TiO2 anatase. The JV curves are completely
different too as a significant photocurrent is observed on TiO2-2%Fe electrode at a potential of 1 V vs. RHE while its starts to be significant only at 1.7 V vs. RHE in the 98%TiO2-2% α-Fe2O3
electrode. With higher current density slope at higher voltage the photocurrent is still lower in the composite at 1.8 V vs. RHE with 220 C vs. 840 μA.cm-2 in Fe doped anatase. This
definitively points out that, at that Fe:Ti ratio, the doping into a well crystallized structure gives better PEC properties than heterostructured system. Oppositely, the TiO2-50%Fe sample is
almost completely made of well crystalline Fe2TiO5 structures and is not PEC active. Could it be
possible to combine it with other oxides to recover PEC properties ?
Then, the light driven water oxidation by nanocomposite electrodes with Fe2TiO5 and single
oxide, either TiO2 or Fe2O3, was monitored. To do so, nanocomposite electrodes with various
compositions: x-Fe2TiO5/y-TiO2 or x-Fe2TiO5/y-Fe2O3 were fabricated; x and y represent the
weight percentage (%) of Fe2TiO5 and pure oxides, respectively. For simplicity, Figure 7
nanocomposite electrodes with various compositions. We monitored the photoactivity at this potential to ensure that all the photoanodes were photo(electro)chemically active. The JV curves of pure samples are reported in Figure SI-9.
Figure 7. Photocurrents measured at 1.8 V vs. RHE and NaOH, pH = 14 for the nanocomposite photoelectrodes with various compositions. The photocurrents are given in μA.cm-2 and the area
of the circle is proportional to that value.
Several observations can be made: i) Fe2TiO5 needs to be combined with either TiO2 or Fe2O3
to achieve a high photocurrent; ii) the composite with Fe2TiO5 and Fe2O3 exhibits a high
photocurrent for a wide range of compositions, iii) the best photocurrent for these nanocomposite electrodes is achieved for 25% Fe2TiO5 and 75% TiO2.
The poor electrochemical activity as well as the high onset potential (not shown here) of nanocomposite photoelectrodes with TiO2 and Fe2O3 is consistent with findings in the literature
and is due to the poor separation of holes at the semi-conductor electrolyte interface that certainly increased back electron recombination at low bias voltage.85
TiO2-A α-Fe2O3 Fe2TiO5 332 117 72 84 56 114 147 62 20 33 171 143 0 75/25 25/75 50/50 25/75 50/50 75/25 75/25 50/50 75/25 75/25 50/50 25/75 25/75 50/50 75/25 γ-Fe2O3 173 215 78 191 129 196 112 120
However, when the nanocomposite electrodes contain pseudo-brookite (Fe2TiO5/Fe2O3 or
Fe2TiO5/TiO2) better charge separation is achieved as photocurrents measured are higher.
For Fe2TiO5/Fe2O3 nanocomposites, the heterojunction has a large effect on the charge
separation process as better photocurrents are achieved for a wide range of compositions. Since both the valence and the conduction band extrema are higher in Fe2TiO5 than in Fe2O3 (as shown
in figure 8), a straddling gap is created at the Fe2TiO5/Fe2O3 n-n heterojunction. However, the
photocurrent onset is still low, indicating that the amounts of long-lived surface holes are not sufficient at low bias voltage. Electron/hole recombination should then occur, probably due to the existence of numerous grain boundaries in these thick electrodes acting as sources of recombination sites. Indeed, these grain boundaries contain a large amount of defects.
Figure 8. Charge generation, recombination, and transfer in the nanocomposite photoelectrodes studied a) TiO2/Fe2O3; b) Fe2O3/Fe2TiO5 and c) TiO2/Fe2TiO5. The relative VB and CB edge
positions for the two oxides involved in an heterojunction is indicative of the charge separation and the place where OER may proceed. Electrons’ transfer to FTO layer after charge separation is not described here.
In TiO2/Fe2TiO5 nanocomposites, the photocurrents depend on the composition of the
electrode. Among the various nanocomposite electrodes, the one containing a high TiO2 content
a. E / V RHE b. c. 0 1.23 H2/H2O H2O/O2 TiO2 Fe2O3 h + -+ H2O O2 EF 1.23 E / V RHE 0 H2/H2O H2O/O2 Fe2O3 Fe2TiO5 h + -+ H2O O2 EF + E / V RHE 0 1.23 H2/H2O H2O/O2 TiO2 Fe2TiO5 h + -+ H2O O2 EF +
photocurrent and ii) the lowest onset potential (not shown here). This is an indication that the pseudo-brookite/TiO2 heterojunction has a major impact on the charge separation process.
Compared to TiO2/Fe2O3 nanocomposite photoelectrodes, Fe2TiO5 favors the separation of holes
at the semiconductor-electrolyte interface and greatly limits the e-/h+ recombination at low bias
voltages. This is supported by recent results on hematite-titania nanocomposite photoanodes where the charge dynamics of TiO2--Fe2O3 nanocomposite photoanodes were measured using
transient absorption spectroscopy.86 DFT modeling results have shown that pseudo-brookite
exhibits slightly more promising electronic properties than hematite, except for hole mobility, for which reason a good catalytic efficiency is expected for Fe2TiO5. Consequently, the gain is rather
in the efficiency of the pseudo-brookite/TiO2 heterojunction for charge separation than the
electrocatalytic activity of Fe2TiO5. Compared to Fe2O3/Fe2TiO5 nanocomposite photoelectrodes,
TiO2 limits the fast charge carrier recombination due to both i) the high absorption coefficient of
TiO2 compared to Fe2O3 and ii) the higher electron mobility in TiO2 compared to Fe2O3.
The impact of the structure of the iron oxide on the photocurrent has been explored. We performed equivalent studies as before, but hematite was replaced by maghemite. The interest of using maghemite instead of hematite is that maghemite contains cationic vacancies that can act as sites for electron trapping, limiting electron/hole recombination. The photocurrents measured on the various photoelectrodes are summarized and reported in Figure 7. We note that nanocomposite TiO2/Fe2O3 photoelectrodes exhibit higher photocurrents than TiO2/Fe2O3.
This is probably linked to both better electron/hole separation in the photoelectrodes and holes with a longer life-time due to the presence of vacancies in Fe2O3. All of these facilitate the
In a more general comparison of the selected pure phase and the corresponding nanocomposites based on experimental and computational results, it is now possible to better explain their relative PEC activity. First pure TiO2, that has the best photon conversion efficiency
suffers from a lack of catalytically active surface sites that can exploit trapped holes before their recombination. In accontrary, pure iron oxides α- and γ-Fe2O3 exhibit more active catalytic sites
but also exhibit a lower photon conversion yield and charge mobility. The combination of TiO2
and Fe2O3 may be beneficial in nano-heterostructures, except if the solid-solid interface favors
charge recombination. Moreover, the relative amount of each phase, their structure and size should be optimized for significant PEC activity.
The ordered orthorhombic Fe2TiO5 structure should exhibit fair PEC activity – between those
of TiO2 and Fe2O3 – according to the calculation of its electronic and structural properties.
Unfortunately, our synthetic approach did not allow to produce phase pure orthorhombic Fe2TiO5, as a secondary monoclinic phase was detected with PDF analyses. Moreover, the iron
occupancy in the pseudo-brookite structure is not fixed as proposed in the model but randomly distributed in the different metallic sites. Finally, the Fe:Ti chemical composition is slightly less than 2:1, implying oxygen defects in the structure that were not taken into account in the DFT calculations. These different points intuitively explain why the tested materials are inactive in PEC: with two phases and a random distribution of Fe atoms the Fe2TiO5 composite is much too
disordered to allow good photon conversion and charge carrier mobility. The JV curve of Fe2TiO5 is compared in Figure SI-10 to that of a brookite sample prepared according to a
procedure described in the literature.87 It confirms that the brookite structure of TiO
2 presents
weak photocurrents (20 μA.cm-2 at 1.8 V vs. RHE) and only at high bias voltage. However, it is
electrocatalytic activity may be enhanced due to the oxygen defects distorting the geometry of neighboring iron sites. Consequently the combination of small quantities of Fe2TiO5 with a good
photoharvester such as TiO2 gave the best results among heterostructured systems.
Finally, this study demonstrates that tuning the electron/hole recombination processes in the bulk electrodes, but also at the electrode/electrolyte interfaces, favors the photoactivity. This was achieved by the design of the nanocomposite photoelectrodes made of materials with different properties. However, the photocurrent achieved as well as the onset potential are lower than that those for single Fe-doped photoelectrodes (onset potential is 0.8 V vs. RHE and at 1.2 V/RHE, the photocurrent is about 412 A·cm-2 and at 1.8 V/RHE is 735 A·cm-2). This is an indication
that the nanocomposite electrodes probably contain a lot of defects on the grain boundaries that act as recombination traps.
4. Conclusion
In summary, we explored the photoelectrochemical performances of different Fe-Ti oxide electrodes for water oxidation. We proposed to use chimie douce coupled with micro-wave stimulus to achieve pure, mono-dispersed and crystalline nanoparticles with different levels of Fe. These nanoparticles have been characterized by various techniques including X-ray diffraction, PDF analysis, HRTEM and Mössbauer spectroscopy to monitor their structure, chemical composition and microstructure. Experimental conditions have been found and reported to achieve single phase TiO2 anatase doped with various amounts of Fe(III) up to 10
at.%, and pure α-Fe2O3 hematite or γ-Fe2O3 maghemite. Most notably, two polymorphs of
Fe2TiO5 have been obtained in gentle synthesis conditions. The photoelectrochemical
or/and Fe2TiO5 or/and TiO2 have been evaluated. We found that the electrocatalytic activity is
strongly dependent on the nature of the hetero-junction and the best photocurrents are achieved for nanocomposite Fe2TiO5/TiO2 photoanodes with high TiO2 weight content (25/75). This
increase in electrochemical performance is linked to the high absorption coefficient of TiO2 and
its good electron mobility and to the higher catalytic efficiency of Fe2TiO5 compared to α-Fe2O3.
This highlights the interest of using heterostructure to cope with poor charge carrier dynamics. However, the highest photocurrent is not achieved with heterostructured photoelectrodes but with Fe-doped TiO2 systems at a low doping content of Fe = 2 atom%. This demonstrates the
necessity to engineer finely materials at the nanoscale to achieve both good charge carrier dynamics and high performance surface catalysis.
ASSOCIATED CONTENT
Additional figures, including Figure SI-1: Photoanode preparation and FEG-SEM image of the cross-section of nanocomposite electrodes; Table SI-1: qualitative structure analyses of XRD patterns of Fe-Ti composites prepared at different pH; Figure SI-2: details on PDF analyses at different Fe rates and on the orthorhombic and monoclinic Fe2TiO5 unit cell representation;
Figure SI-3: Mössbauer spectrum of TiO2-50%Fe and its deconvolution with increasing number
of Fe3+ sites; Figure SI-4: TEM images of selected TiO
2-x%Fe-pHy samples; Figure SI-5:
HRTEM images of TiO2-50%Fe sample; Figure SI-6: TEM image of TiO2-66%Fe sample;
Figure SI-7: Diffuse reflectance spectra of different TiO2-x%Fe samples showing bandgap
evolution as function of iron doping. Figure SI-8 to Figure SI-10 JV curves of different pure and composite electrodes. This information is available free of charge via the Internet at
AUTHOR INFORMATION
Corresponding Author
Olivier Durupthy
Telephone: +33144276306, Fax: +33144271504, E-mail: olivier.durupthy@upmc.fr
Present Addresses
†P.Sautet is now at Department of Chemical and Biomolecular engineering, University of California, Los Angeles, Los Angeles, CA 90095, United States.
Author Contributions
The manuscript was written through contributions of all authors. All authors have given approval to the final version of the manuscript. ‡These authors contributed equally. (match statement to author names with a symbol)
ACKNOWLEDGMENT
SP, CLR and OD thank MATISSE for the financial support of LD and TOTAL for the financial support of SP. STM and TLB gratefully acknowledge the computational resources provided by l’Institut du Développement et des Ressources en Informatique Scientifique (IDRIS, under project x2015080609) of the Centre Nationale de la Recherche Scientifique (CNRS) and the Pôle Scientifique de Modélisation Numérique (PSMN) of École Normale Supérieure de
Lyon. The work done at the Advanced Photon Source, an Office of Science User Facility
operated for the U.S. Department of Energy (DOE) Office of Science by Argonne National Laboratory, was supported by the U.S. DOE under Contract No. DE-AC02-06CH11357.
ABBREVIATIONS AFM Anti-Ferromagnetic CB Conduction Band
CBM Conduction Band Minimum
CNRS Centre National de la Recherche Scientifique DOS Density Of States
DFT Density Functional Theory DRS Diffuse Reflectance Spectra
EDX Energy-Dispersive X-Ray Spectroscopy FM Ferromagnetic
NP nanoparticle
PAW Projector Augmented-Wave PDF Pair Distribution Function PEC Photoelectrochemical
RHE Reversible Hydrogen Electrode TEM Transmission Electron Microscopy TiO2-A TiO2-anatase
VB Valence Band
VBM Valence Band Maximum XRD X-Ray Diffraction
REFERENCES
1. Abdi, F. F.; Han, L.; Smets, A. H. M.; Zeman, M.; Dam, B.; van de Krol, R., Efficient Solar Water Splitting by Enhanced Charge Separation in a Bismuth Vanadate-Silicon Tandem Photoelectrode. Nat. Commun. 2013, 4, 2195-2195.
2. Joya, K. S.; Joya, Y. F.; Ocakoglu, K.; Van de Krol, R., Water-Splitting Catalysis and Solar Fuel Devices: Artificial Leaves on the Move. Angew. Chemie, Int. Ed. 2013, 52, 10426-10437.
3. Abdi, F. F.; Firet, N.; van de Krol, R., Efficient Bivo4 Thin Film Photoanodes Modified with Cobalt Phosphate Catalyst and W-Doping. ChemCatChem 2013, 5, 490-496.
4. Gratzel, M., Photoelectrochemical Cells. Nature 2001, 414, 338-344.
5. McEvoy, J. P.; Brudvig, G. W., Water-Splitting Chemistry of Photosystem Ii. Chem. Rev.
2006, 106, 4455-4483.
6. Nocera, D. G., Personalized Energy: The Home as a Solar Power Station and Solar Gas Station. Chemsuschem 2009, 2, 387-390.
7. Sivula, K., Metal Oxide Photoelectrodes for Solar Fuel Production, Surface Traps, and Catalysis. J. Phys. Chem. Lett., 4, 1624-1633.
8. Hamann, T. W., Splitting Water with Rust: Hematite Photoelectrochemistry. Dalton
Trans. 2012, 41, 7830-7834.
9. Gan, J.; Lu, X.; Tong, Y., Towards Highly Efficient Photoanodes: Boosting Sunlight-Driven Semiconductor Nanomaterials for Water Oxidation. Nanoscale 2014, 6, 7142-7164. 10. Sivula, K.; Le Formal, F.; Graetzel, M., Solar Water Splitting: Progress Using Hematite (-Fe2o3) Photoelectrodes. Chemsuschem 2011, 4, 432-449.
11. Barroso, M.; Pendlebury, S. R.; Cowan, A. J.; Durrant, J. R., Charge Carrier Trapping, Recombination and Transfer in Hematite Water Splitting Photoanodes. Chem. Sci. 2013, 4, 2724-2734.
12. Ginley, D. S.; Butler, M. A., Photoelectrolysis of Water Using Iron Titanate Anodes. J.
13. Fujishima, A.; Honda, K., Electrochemical Photolysis of Water at a Semiconductor Electrode. Nature 1972, 238, 37-38.
14. Cowan, A. J.; Tang, J.; Leng, W.; Durrant, J. R.; Klug, D. R., Water Splitting by Nanocrystalline Tio2 in a Complete Photoelectrochemical Cell Exhibits Efficiencies Limited by Charge Recombination. J. Phys. Chem. C 2010, 114, 4208-4214.
15. Dholam, R.; Patel, N.; Adami, M.; Miotello, A., Hydrogen Production by Photocatalytic Water-Splitting Using Cr- or Fe-Doped Tio2 Composite Thin Films Photocatalyst. Int. J.
Hydrogen Energy 2009, 34, 5337-5346.
16. Tang, J.; Durrant, J. R.; Klug, D. R., Mechanism of Photocatalytic Water Splitting in Tio2. Reaction of Water with Photoholes, Importance of Charge Carrier Dynamics, and Evidence for Four-Hole Chemistry. J. Am. Chem. Soc. 2008, 130, 13885-13891.
17. Stamate, M. D., Dielectric Properties of Tio2 Thin Films Deposited by a Dc Magnetron Sputtering System. Thin Solid Films 2000, 372, 246-249.
18. Le Formal, F.; Pendlebury, S. R.; Cornuz, M.; Tilley, S. D.; Grätzel, M.; Durrant, J. R., Back Electron-Hole Recombination in Hematite Photoanodes for Water Splitting. J. Am. Chem.
Soc. 2014, 136, 2564-2574.
19. Yu, J. G.; Yu, H. G.; Ao, C. H.; Lee, S. C.; Yu, J. C.; Ho, W. K., Preparation, Characterization and Photocatalytic Activity of in Situ Fe-Doped Tio2 Thin Films. Thin Solid
Films 2006, 496, 273-280.
20. Yu, J. C.; Wang, X. C.; Fu, X. Z., Pore-Wall Chemistry and Photocatalytic Activity of Mesoporous Titania Molecular Sieve Films. Chem. Mater. 2004, 16, 1523-1530.
21. Saremi-Yarahmadi, S.; Wijayantha, K. G. U.; Tahir, A. A.; Vaidhyanathan, B., Nanostructured Ahem Electrodes for Solar Driven Water Splitting: Effect of Doping Agents on Preparation and Performance. J. Phys. Chem. C 2009, 113, 4768-4778.
22. Santos, R. d. S.; Faria, G. A.; Giles, C.; Leite, C. A. P.; Barbosa, H. d. S.; Arruda, M. A. Z.; Longo, C., Iron Insertion and Hematite Segregation on Fe-Doped Tio2 Nanoparticles Obtained from Sol-Gel and Hydrothermal Methods. ACS Appl. Mater. Interfaces 2012, 4, 5555-5561.
23. Zhao, W.; Li, Y.; Zhang, M.; Chen, J.; Xie, L.; Shi, Q.; Zhu, X., Direct Microwave Hydrothermal Synthesis of Fe-Doped Titania with Extended Visible-Light Response and Enhanced H2-Production Performance. Chem. Eng. J. 2016, 283, 105-113.
24. Zhang, X.; Lei, L., Preparation of Photocatalytic Fe2o3-Tio2 Coatings in One Step by Metal Organic Chemical Vapor Deposition. Appl. Surf. Sci. 2008, 254, 2406-2412.
25. Peng, L.; Xie, T.; Lu, Y.; Fan, H.; Wang, D., Synthesis, Photoelectric Properties and Photocatalytic Activity of the Fe2o3/Tio2 Heterogeneous Photocatalysts. Phys. Chem. Chem.
Phys. 2010, 12, 8033-8041.
26. Courtin, E.; Baldinozzi, G.; Sougrati, M. T.; Stievano, L.; Sanchez, C.; Laberty-Robert, C., New Fe2tio5-Based Nanoheterostructured Mesoporous Photoanodes with Improved Visible Light Photoresponses. J. Mater. Chem. A 2014, 2, 6567-6577.
27. Moniz, S. J. A.; Shevlin, S. A.; An, X.; Guo, Z.-X.; Tang, J., Fe2o3-Tio2 Nanocomposites for Enhanced Charge Separation and Photocatalytic Activity. Chem. Eur. J.
2014, 20, 15571-15579.
28. Ahmed, M. G.; Kretschmer, I. E.; Kandiel, T. A.; Ahmed, A. Y.; Rashwan, F. A.; Bahnemann, D. W., A Facile Surface Passivation of Hematite Photoanodes with Tio2 Overlayers for Efficient Solar Water Splitting. ACS Appl. Mater. Interfaces 2015, 7, 24053-24062.
29. Melissen, S.; Labat, F.; Sautet, P.; Le Bahers, T., Electronic Properties of Pbx3ch3nh3 (X = Cl, Br, I) Compounds for Photovoltaic and Photocatalytic Applications. Phys. Chem. Chem.
Phys. 2015, 17, 2199-2209.
30. Melissen, S.; Bahers, T. L.; Steinmann, S. N.; Sautet, P., The Relationship between Carbon Nitride Structure and Exciton Binding Energies: A Dft Perspective. J. Phys. Chem. C.
2015.
31. Bhunia, M. K.; Melissen, S.; Parida, M. R.; Sarawade, P.; Basset, J.-M.; Anjum, D. H.; Mohammed, O. F.; Sautet, P.; Le Bahers, T.; Takanabe, K., Dendritic Tip-on Polytriazine-Based Carbon Nitride Photocatalyst with High Hydrogen Evolution Activity. Chem. Mater. 2015, 27, 8237-8247.
32. Le Bahers, T.; Haller, S.; Le Mercier, T.; Barboux, P., Assessing the Use of Bicuos for Photovoltaic Application: From Dft to Macroscopic Simulation. J. Phys. Chem. C 2015, 119, 17585-17595.
33. Kandiel, T. A.; Anjum, D. H.; Sautet, P.; Le Bahers, T.; Takanabe, K., Electronic Structure and Photocatalytic Activity of Wurtzite Cugaas Nanocrystals and Their Zn Substitution. J. Mater. Chem. A 2015, 3, 8896-8904.
34. Pottier, A.; Cassaignon, S.; Chanéac, C.; Villain, F.; Tronc, E.; Jolivet, J.-P., Size Tailoring of Tio2 Anatase Nanoparticles in Aqueous Medium and Synthesis of Nanocomposites. Characterization by Raman Spectroscopy. J. Mater. Chem. 2003, 13, 877-882.
35. Sreeja, V.; Joy, P. A., Microwave-Hydrothermal Synthesis of -Fe2o3 Nanoparticles and Their Magnetic Properties. Mater. Res. Bull. 2007, 42, 1570-1576.
36. Chupas, P. J.; Chapman, K. W.; Lee, P. L., Applications of an Amorphous Silicon-Based Area Detector for High-Resolution, High-Sensitivity and Fast Time-Resolved Pair Distribution Function Measurements. J. Appl. Crystallogr. 2007, 40, 463-470.
37. Chupas, P. J.; Qiu, X. Y.; Hanson, J. C.; Lee, P. L.; Grey, C. P.; Billinge, S. J. L., Rapid-Acquisition Pair Distribution Function (Ra-Pdf) Analysis. J. Appl. Crystallogr. 2003, 36, 1342-1347.
38. Hammersley, A. P.; Svensson, S. O.; Hanfland, M.; Fitch, A. N.; Hausermann, D., Two-Dimensional Detector Software: From Real Detector to Idealised Image or Two-Theta Scan.
High Pressure Res. 1996, 14, 235-248.
39. Qiu, X.; Thompson, J. W.; Billinge, S. J. L., Pdfgetx2: A Gui-Driven Program to Obtain the Pair Distribution Function from X-Ray Powder Diffraction Data. J. Appl. Crystallogr. 2004,
37, 678.
40. Farrow, C. L.; Juhas, P.; Liu, J. W.; Bryndin, D.; Bozin, E. S.; Bloch, J.; Proffen, T.; Billinge, S. J. L., Pdffit2 and Pdfgui: Computer Programs for Studying Nanostructure in Crystals. J. Phys.: Condens. Matter 2007, 19.
41. Dovesi, R., et al., Crystal14: A Program for the Ab Initio Investigation of Crystalline Solids. Int. J. Quant. Chem. 2014, 114, 1287-1317.
42. Dovesi, R., et al., Crystal14 User's Manual (University of Torino), 2014.
43. Catti, M.; Valerio, G.; Dovesi, R., Theoretical Study of Electronic, Magnetic, and Structural Properties of Alpha -Fe2o3 (Hematite). Phys. Rev. B 1995, 51, 7441-7450.
44. Sophia, G.; Baranek, P.; Sarrazin, C.; Rérat, M.; Dovesi, R., First-Principles Study of the Mechanisms of the Pressure-Induced Dielectric Anomalies in Ferroelectric Perovskites. Phase
Trans. 2013, 86, 1069-1084.
45. Adamo, C.; Barone, V., Toward Reliable Density Functional Methods without Adjustable Parameters: The Pbe0 Model. J. Chem. Phys. 1999, 110, 6158-6170.