HAL Id: hal-01326122
https://hal.archives-ouvertes.fr/hal-01326122
Submitted on 3 Jun 2016HAL is a multi-disciplinary open access archive for the deposit and dissemination of sci-entific research documents, whether they are pub-lished or not. The documents may come from teaching and research institutions in France or abroad, or from public or private research centers.
L’archive ouverte pluridisciplinaire HAL, est destinée au dépôt et à la diffusion de documents scientifiques de niveau recherche, publiés ou non, émanant des établissements d’enseignement et de recherche français ou étrangers, des laboratoires publics ou privés.
Social-ecological systems in the Anthropocene : the need
for integrating social and biophysical records at regional
scales
Ja Dearing, B Acma, S Bub, Fm Chambers, X Chen, J Cooper, D Crook, Xh
Dong, M Dotterweich, Me Edwards, et al.
To cite this version:
Ja Dearing, B Acma, S Bub, Fm Chambers, X Chen, et al.. Social-ecological systems in the An-thropocene : the need for integrating social and biophysical records at regional scales. AnAn-thropocene Review, SAGE Publications, 2015, pp.1-27. �10.1177/2053019615579128�. �hal-01326122�
The Anthropocene Review 1 –27 © The Author(s) 2015 Reprints and permissions: sagepub.co.uk/journalsPermissions.nav
DOI: 10.1177/2053019615579128 anr.sagepub.com
Review
Social-ecological systems in the
Anthropocene: the need for
integrating social and biophysical
records at regional scales
JA Dearing,
1B Acma,
2S Bub,
3FM Chambers,
4X Chen,
5,6J Cooper,
7D Crook,
8XH Dong,
6M
Dotterweich,
9ME Edwards,
1TH Foster,
10M-J
Gaillard,
11D Galop,
12P Gell,
13A Gil,
14E Jeffers,
15RT Jones,
16A Krishnamurthy,
17PG Langdon,
1R Marchant,
18F Mazier,
11,12CE McLean,
19LH
Nunes,
20S Raman,
21I Suryaprakash,
22M Umer,
23XD Yang,
6R Wang
6and K Zhang
24Abstract
Understanding social-ecological system dynamics is a major research priority for sustainable management of landscapes, ecosystems and resources. But the lack of multi-decadal records represents an important gap in information that hinders the development of the research agenda. Without improved information on the long-term and complex interactions between causal factors and responses, it will be difficult to answer key questions about trends, rates of change, tipping points, safe operating spaces and pre-impact conditions. Where available long-term monitored records are too short or lacking, palaeoenvironmental sciences may provide
1University of Southampton, UK
2Anadolu University, Turkey
3University of Koblenz-Landau, Germany
4University of Gloucestershire, UK
5China University of Geosciences (Wuhan), China
6 Nanjing Institute of Geography and Limnology, Chinese
Academy of Sciences, China
7Americas Section, British Museum, UK
8University of Hertfordshire, UK
9 GEOarch – Applied Geoarchaeology, Germany and
University of Vienna, Austria
10University of Tulsa, USA
11Linnaeus University, Sweden
12Toulouse Jean Jaures University, France
13Federation University Australia, Australia
14Museo de Historia Natural de San Rafael, Argentina
15University of Oxford, UK
16University of Exeter, UK
17French Institute of Pondicherry, India
18University of York, UK
19Youngstown State University, USA
20State University of Campinas, Brazil
21 Indian Institute of Science, India
22 National Centre for Biological Sciences, Tata Institute of
Fundamental Research, India
23Addis Ababa University, Ethiopia (deceased)
24James Cook University, Australia
Corresponding author:
JA Dearing, Geography and Environment, University of Southampton, Highfield Campus, Southampton, SO17 1BJ, UK.
continuous multi-decadal records for an array of ecosystem states, processes and services. Combining these records with conventional sources of historical information from instrumental monitoring records, official statistics and enumerations, remote sensing, archival documents, cartography and archaeology produces an evolutionary framework for reconstructing integrated regional histories. We demonstrate the integrated approach with published case studies from Australia, China, Europe and North America.
Keywords
complex systems science, ecosystem services, IGBP-PAGES, palaeoenvironmental records, social-ecological systems, sustainable management, tipping points
Introduction
In important ways, the Anthropocene (Crutzen, 2002) is characterised by its dynamism. Unprecedented rates of change involving complex interactions between human activities and the natural environment have produced major challenges for managing contemporary landscapes, eco-systems and resources (Rockström et al., 2009). The growing body of mathematical theory for complex system behaviour illustrates not only the unpredictability of such systems but also pro-vides concepts, such as feedback loops, tipping points and regime shifts, that fuel concern about the unintended consequences of management actions, and inactions. As a result, static indicators of environmental change are increasingly viewed as insufficient to understand the impacts of chang-ing boundary conditions (Jackson et al., 2009). Understandchang-ing the dynamic relationships between social, environmental and climatic phenomena is now considered as key to making appropriate management decisions (Gillson and Marchant, 2014; Sidle et al., 2013). Consequently, the inte-grated study of coupled social–ecological systems (Liu et al., 2007) is viewed as the dominant framework for the management of ecosystems.
Not surprisingly, sustainability and adaptive management literature is replete with arguments, critiques and conceptual frameworks that highlight the need to establish and model the behaviour of social-ecological systems over time: global ecological assessments (e.g. Millennium Ecosystem Assessment, 2005); vulnerability analysis (e.g. Turner et al., 2003); sustainability science (e.g. Kates et al., 2001); ecosystem services (e.g. Anderies et al., 2004; Ostrom, 2009); hierarchical theory (e.g. Bourgeron et al., 2009; Wu, 1999); resilience theory (e.g. Walker and Salt, 2006; Walker et al., 2002); social-ecological dynamics (e.g. Carpenter, 2002; Horan et al., 2011; Lade et al., 2013; Lansing et al., 2014). Carpenter et al. (2009: 1309) specify how changes in social-eco-logical dynamics can be understood through the relationships between slow and fast variables, making the case for ‘networked, place-based and long-term social-ecological research’.
Achieving this level of understanding implies taking an evolutionary perspective based on rela-tively long temporal records, an approach advocated by the historical, palaeoecological and archaeological communities (Chambers et al., 1999; Costanza et al., 2007; Dearing, 2006; Dearing et al., 2006a, 2010, 2012a; Foster et al., 2003; Lenton et al., 2008; Marchant and Lane, 2014; Seddon et al., 2014; Willis and Birks, 2006). Palaeoecological studies have shown clearly the dynamic nature of ecosystems, their responsiveness to forces or change, and their resilience or vulnerability to these forces (e.g. Jeffers et al., 2011). As a result, palaeoecologists generally con-sider that an understanding of the evolution of the ecosystem over decades and centuries (multi-decadal) should be the starting point for auditing its current condition with a view to identifying and prioritising management measures. There are already many instances where well-intentioned
conservation plans are shown to be misplaced when the longer term ecological character is gleaned from the palaeoecological evidence (e.g. Chambers et al., 2007, 2013; Gell, 2010; Gillson and Duffin, 2007; Oldfield, 1970; van Leeuwen et al., 2008).
A shift towards ‘bottom-up’, evolutionary understanding of social-ecological systems is, to some extent, at odds with the modern preference for applying numerical modelling to give esti-mates of future conditions for plausible future states. These are often designed around scenarios that represent likely trajectories of possible drivers of change, such as climate or population, and at their heart lie questions of the ‘what if?’ kind. But this approach is increasingly criticised, particu-larly by the resilience and complex system science communities, because it often fails to accom-modate the feedback mechanisms and thresholds that determine the function of complex systems (e.g. Nicholson et al., 2009). New modelling approaches that capture feedback are beyond the scope of this work: in their absence, we make the case for addressing alternative ‘diagnostic’ ques-tions about the structure and function of the system that may not only be more relevant to the management of social-ecological systems but easier to address when set within an evolutionary framework.
Therefore, the aim of this paper is to review the integration of social and biophysical empirical records within evolutionary frameworks as the foundation for addressing key questions about the functioning of regional social-ecological systems – questions that are deemed critical to environ-mental decision-making. In particular, we highlight the under-developed use of recent palaeoeco-logical records as proxies of ecopalaeoeco-logical processes, conditions and services where conventional monitoring records are deficient or absent.
Evolutionary approaches
Taking an integrative, evolutionary approach means to view change as the product of interactions between different system variables through time. At the simplest level, it is possible to assess evo-lutionary behaviour through simple comparisons of trends. As an example, the concept of the Anthropocene has come largely through comparison of multi-decadal records drawn from compi-lations of national survey and instrument data, Earth observations and palaeoclimate data from ice cores. Thus, in Steffen et al.’s (2004, 2007) reviews of the Anthropocene, there are records (some extending back to 1750) for total and urban population, gross domestic product (GDP) and invest-ment, river dam construction and water use, consumption of fertilisers and paper, ozone depletion, atmospheric CO2, mean temperature, loss of tropical forest, species extinction, the extent of exploited fisheries, international tourism and numbers of vehicles, McDonald’s restaurants, and telephones. Each record represents a trend for a single social, economic, climate or ecological vari-able that gives power to the idea of accelerating activity at the planetary scale, even if the func-tional relationships are only partly known.
At regional scales, social and economic sciences are also drawing on time-series from official statistical records within evolutionary frameworks to help explain the functioning of modern sys-tems (e.g. Simmie and Martin, 2010). Analyses of regional time-series of employment data in the UK provide the basis for comparing the resilience of regions to economic shocks (Martin, 2012). The argument that current levels of national (and global) inequality are not just undesirable but unsustainable are founded on detailed analyses of reconstructed or recorded economic (Picketty, 2014; Stiglitz, 2013) and social (Wilkinson and Pickett, 2009) data. In a related way, Han Rosling’s (http://www.gapminder.org) animations of national data for social and economic conditions dem-onstrate the rapidly evolving human development that has accompanied the accelerating trends observed in the Anthropocene.
There are, however, far fewer attempts to combine social, economic and biophysical perspec-tives to inform about coupled social-ecological behaviour at regional scales. One problem that often arises is the lack of biophysical records. Regional biophysical records are often restricted to aerial photography and remote sensing, post-Second World War period measurements, or long-term monitoring programmes. The International Long-Term Ecological Research programme (http://www.ilternet.edu/) has 38 networks spread over five continents. They provide key data on monitored and instrumented sites over normally the past few decades and have recently extended analyses to include ecosystem services. Despite the importance of these data sets (Redman et al., 2004) they cannot provide wider coverage of regional systems, or provide time-series of ecologi-cal processes and services that were not included in monitoring programmes. To fill these gaps, it is possible in many regions to use palaeorecords covering timescales of 100–102 years.
Analytical developments in the palaeoenvironmental sciences mean that proxy records for algal levels, atmospheric pollution, biodiversity, carbon flux, climate variables, fish stocks, flood-ing, land cover, land use, nutrient export, regional fire, sediment transport, soil erosion, water quality and other variables linked explicitly to ecosystem services can now be routinely obtained from sedimentary archives (Dearing, 2006; Dearing et al., 2012b). For many regions, high-reso-lution and quantitative ‘reconstructed’ time-series can replace instrumented and survey records where none exist.
Linking together the social and biophysical records to give functional insight within regions may be viewed as a priority area of research (Carpenter et al., 2009; Ostrom, 2009) but there is no fully developed methodology that combines questions, theory, approach and analysis. Walker et al. (2002) made the case for ‘historical profiling’ using the history of the region to contextualise the changes leading to the current situation, but more through narrative than time-series. Redman et al.’s (2004) three-stage process for integration identified collecting background information on ‘external’ biogeophysical, political and economic conditions that set the stage; describing and monitoring changes in both ecological and social patterns and processes that drive the system; and investigating the nature of and monitoring changes in the interactions resulting from the operation of the patterns and processes. We consider that these three pragmatic stages provide an approach within which generic questions about social-ecological systems based on theoretical constructs may be posed.
Questions and theory
Querying the health of the human body naturally involves observation and measurements (by the doctor or patient) in conjunction with theory, medical history and current knowledge. In this way, we describe symptoms, compare current and past health, diagnose the illness, offer remedial action and suggest preventative treatment. A similar approach can be advocated for social-ecological systems: asking questions that are linked to a theoretical understanding of system behaviour. One possible classification of the types of diagnostic questions for a social-ecological system based on key elements in complex system science is shown in Table 1 (Dearing et al., 2006a, 2010, 2012b). The key elements are set out below:
Trends. As shown above, multi-decadal temporal perspectives provide an opportunity to
meas-ure rates of change in system variables over relatively long timescales, and cross-comparison between rates of different variables.
Fast and slow processes. Many cultural and ecological processes change either too slowly or too
infrequently to be discerned clearly in the relatively short timescales offered by monitoring records. In complexity terms, slow processes are viewed as controlling resilience (Carpenter et al., 2009).
Feedback mechanisms. Changes in systems occur through negative and positive feedback loops
that either dampen down or amplify the response in a variable to a driver. These cannot be viewed directly but may be hypothesised from current knowledge and tested using time-series.
Dynamic relationships. An evolutionary framework effectively invalidates the standard use of
bivariate or multivariate statistics to determine ‘causality’. But bivariate phase diagrams and other statistical devices (e.g. with sliding windows of time) can be used to explore the dynamical behav-iour of a system through statistical space (Dearing, 2008; Zhang et al., 2015).
Table 1. Examples of generic questions for social-ecological systems informed by complex systems
theory.
Trends
How rapidly are the individual elements and drivers of the system changing? Are there any familiar patterns of change that indicate path-dependency?
Fast and slow processes
Which variables represent the ‘fast’ processes in the system, and which the ‘slow’ ones?
What are the typical modes of behaviour (e.g. cyclical, high frequency variability) for each driver and ecosystem response variable?
Feedback mechanisms
Where are the positive feedback loops in the system?
Dynamic relationships
Which responses can be explained by linear bivariate or multivariate analyses of drivers, and which cannot? Where does the current social-ecological system lie within an applicable conceptual model of change, such as a Kuznets curve or adaptive cycle?
Thresholds and regime shifts
Is the current system state stable or in transition?
Has the system already passed a threshold to an alternative state? What type of transition is likely for this type of system?
Safe and just operating spaces
What guidelines can be given for development that seeks to maintain specific ecosystem conditions within sustainable limits while ensuring that just social conditions are met for all?
Early warning signals
Do the long-term fluctuations show evidence for increasing variance, skewness or autocorrelation that might represent growing instability?
Network function
What do the likely interactions between variables at a given time tell us about the network structure (topology)?
Baselines
How have baselines changed naturally?
How far removed are the current drivers and ecosystem states, processes or services from baseline (low or pre-impact) levels?
Past analogues
Which past experiences should be learned from or avoided in order to reach sustainable management? Which parts of the landscape or ecosystem have historically been durable, insensitive or resilient in the face of social and biophysical (e.g. climate) drivers, and which have not?
Which social-ecological analogues (from any location) serve as potential successful templates for modern governance, policy and management?
Thresholds and regime shifts. At a threshold point, system conditions can change rapidly with
disproportionally low levels of forcing (Scheffer et al., 2001). Ecological theory argues for wide-spread change across thresholds between alternate states or regimes. Bifurcation theory suggests that the shifts may range from linear-reversible types to non-linear-reversible fold bifurcations with major time-lags or hysteresis.
Safe operating spaces. Applying threshold theory to the real world presents questions about the
defining of safe spaces for human activity at planetary (Rockström et al., 2009) and regional (Dearing et al., 2014) scales that exist well away from undesirable thresholds.
Early warning signals. As a system approaches a threshold it may show signs of growing
insta-bility, such as increased variainsta-bility, skewness and autocorrelation linked to theories of critical slowing down and flickering (Dakos et al., 2008; Lenton et al., 2008, 2012; Scheffer et al., 2012).
Network functioning. Two-dimensional time-series representations of social-ecological systems
are proxies for a four-dimensional network of interactions between variables that is continuously changing in shape and structure, through space and time (Scheffer et al., 2012). Exploring the actual network topology and the nodal interactions in terms of connectivity and centrality (Janssen et al., 2006) is highly desirable but constrained in real world situations by data availability.
Baselines. It may be possible to extend our observations back to a point in time where baseline
or pre-human impact conditions can be observed or defined (e.g. Gell, 2010). These may not only help define target conditions for management but may also allow the degree to which the system is presently outside its natural, long-term or pre-impact ecological character to be assessed. The size of the task for restoration can then be evaluated.
Past analogues. In some situations, particular historical periods or events may serve as useful
lessons for what may happen in the future, or what should be avoided (e.g. Costanza et al., 2007; Dearing et al., 2010).
Table 1 lists examples of questions that can be informed by these complex system science ele-ments, answers to which help to define a dynamical understanding of modern social-ecological systems needed for appropriate policy and management.
Case studies
Here we summarise a number of regional case studies that demonstrate the value of integrating social and biophysical records to answer questions informed by complex system science. In each case, long-term reconstruction of past social and ecological interactions has afforded an improved basis for understanding the modern social-ecological system. Further details of the social and bio-physical records and analytical/statistical techniques used in each case study are given in the sup-porting publications.
The lower Yangtze basin, China: Economic development and environmental
degradation
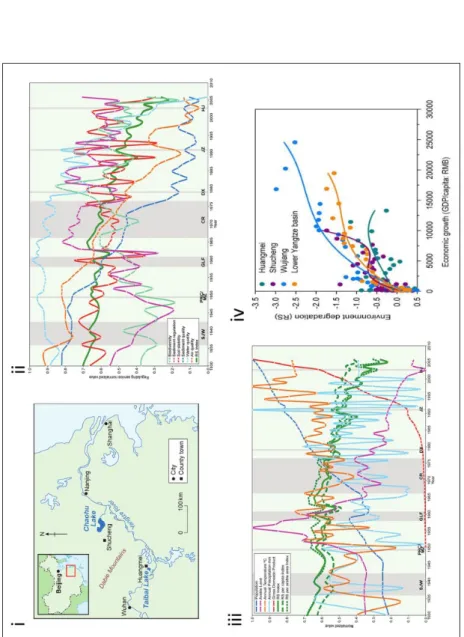
The lower Yangtze basin (LYB) in eastern China is a major economic zone, contributing 41.1% of national GDP, 35.4% of the nation’s total grain production and 31.4% of its forest area in 2007 (World Wildlife Fund, 2009). The environment has been rapidly degraded in the last few centuries, including losses of land cover with associated soil erosion, shrinking of lakes and wetlands, and more recently, during the last 50 years, a decrease in biodiversity and increase in flood frequency (Yang et al., 2009). Future projected change indicates a continued rise in temperatures during the first half of the 21st century (Fu et al., 2008). Climate change will make coastal cities such as
Shanghai more vulnerable to a rise in sea level as well as to extreme climate events. In order to assess how this highly interconnected and complex social-ecological system may be managed effectively it is important to understand how the drivers of change (both human and physical, e.g. wealth creation and climate) have affected natural and socio-economic systems over the decades leading up to the present (Dearing et al., 2012b). Key questions focused on which ecological ser-vices are most degraded, and how different social and ecological elements interacted over time, particularly in terms of producing complex behaviour such as abrupt change caused by threshold transgressions
Multi-proxy data averaged from two large and representative subcatchments of the rural parts of Anhui Province (Figure 1(i)) provide a preliminary integrated picture of social-ecological change over the past 200 years. Proxy data were obtained from the catchments of the lakes Chaohu and Taibai for regional climate (annual temperature and precipitation from ECHO-G model: Liu et al., 2005); population (official statistics and records); arable land use (official statistics and records); vegetation biodiversity (first axis scores of principal components analysis of lake sediment pollen taxa); soil and sediment (fluvial sediment transport proxy from lake sediment accumulation rates); surface soil (frequency-dependent susceptibility proxy data from lake sediments); water quality (epilimnetic1 and sedimentary phosphorus data from lake sediments: Yang et al., 2008); and regional
economic development (official GDP data of Chaohu City and Wuxue City)
The normalised indices (range 0 to 1) for different regulating ecosystem services (vegetation biodiversity, soil and sediment, surface soil, water quality, air quality) since 1930 show gradually declining curves indicating widespread loss of services (e.g. increasing soil erosion and nutrient loadings to water bodies) (Figure 1(ii)). Soil and sediment services show fluctuating records, with major losses observed in the 1940s, with shorter periods of losses in the 1960s and early 1990s. In contrast, air and water quality show significant trends of losses starting in the 1960s. In terms of both the rate of change and the difference between the modern and mid-20th century levels, these are the most degraded ecosystem services.
Comparison with potential drivers of ecological change (Figure 1(iii)) suggests that widespread conversion of forest and scrubland to arable land from the 1950s onwards did not trigger the over-all decline of ecosystem services. Rapid changes in population, climate and GDP occur later and seem to be linked to the deterioration in air and water quality since 1980. Bivariate phase plots (cf. environmental Kuznets curves2) of environmental degradation against economic development
(Figure 1(iv)) over the period for four counties reveal a long-term weakening of the coupling between environmental degradation and economic growth but there is, importantly, no evidence for a regional-wide turning point towards improved environmental conditions (Zhang et al., 2015). This suggests that a turning point may be becoming increasingly unattainable or may even reverse as environmental degradation leads to lower agricultural outputs and rural incomes (Liu, 2012).
The study indicates that successful economic development and poverty alleviation has led to rapid environmental degradation. One interpretation (Zhang et al., 2015) is that the regional LYB social-ecological system passed a major threshold in the 1970s and now currently sits in a tran-sient phase. Trantran-sient phases of regime shifts are less predictable than stable phases, and can be associated with negative impacts (Folke et al., 2010) where ecological responses to stochastic drivers, such as climate events, are likely to become less proportionate, less predictable and less manageable. These effects are unlikely to result in abrupt transitions at the regional scale because large, complex systems may show relatively slow transitional response (Hughes et al., 2012). However, the clear evidence for regime shifts in the highly sensitive, fast-responding lake subsys-tems suggests that some nested elements of the larger system have already altered. There is an increasing likelihood for internally or externally forced disturbances (e.g. continuing water
Figure 1.
Lower Yangtze basin: (i) showing the Chaohu and Taibai lake-catchment sites in the counties of Shucheng and Huangmei, the locat
ion of the Dabie
mountains, and major regional cities; (ii) normalised regulating service proxy records
Biodiversity, Sediment regulation, Soil stability, Sediment quality, Water quality, Air
quality
and
RS index
for 1930–2006. Vertical bars show major 20th–21st century political events (from left to right): People’s Republic of China fo
unded by Mao
Zedong 1949; Great Leap Forward 1958–1961; Cultural Revolution 1966–1976; Deng Xiaoping’s economic reforms from late 1970s–earl
y 1980s; leadership
of Jiang Zemin from 1989; leadership of Hu Jintao from 2003; (iii) normalised records for
GDP
(1950–2000),
Population, Arable land
(Chinese unit mu),
Annual T (°C) and Annual P (mm) with normalised RS index (from b), RS per capita and
RS per arable land area
indices. Vertical bars as in b); (iv) Environmental Kuznets
curve relationships between environmental degradation (regulating service indices: z scores) and economic growth (GDP/capita: R
MB-renminbi) for Huangmei,
Shucheng, Wujiang and the whole lower Yangtze basin over the period 1950–2006. Fitted polynomials show significant levels of ex
planation: Huangmei r 2 = 0.26, p = 0.014; Shucheng r 2 = 0.65, p ⩽ 0.01; LYB r 2 = 0.91, p ⩽ 0.01; Wujiang r 2 = 0.89, p ⩽
quality degradation or global commodity price fluctuations, respectively) to propagate new effects between different sectors and across the region.
The Lower Murray-Darling basin, Australia: Vulnerability and resilience of wetlands
Concerns about the effects of climate change on ecosystem function are heightened when there is evidence that these may depend upon the degree to which the ecosystem is already stressed by human activities. Questions arise, such as how to tease apart the relative effects of climate and human activity; whether the level of stress is strengthening or lessening; what would be the effects of climate change on a system already beyond its normal boundary conditions.
Recent observations in the Lower Murray-Darling Basin (MDB) reveal (Figure 2) that the floodplain wetlands show many signs of stress: high levels of turbidity; rapid changes in aquatic communities; increased salinity; and acidification (Ogden, 2000; Reid, 2008; Reid et al., 2007). The catchment was settled by the 1830s and was subjected to extensive modification in order to support an agricultural industry that generates 40% of the nation’s agricultural gross domestic product. This was enabled by widespread vegetation cover removal, widespread pastoral and crop-ping activity, intensive river regulation and flow abstraction for the development of irrigated agri-culture, creating a suite of stressors to aquatic systems.
The local palaeoenvironmental archives of past climate change and variability suggest that while the wetlands responded to mid-Holocene climate variability (Gell et al., 2005), continuous records of wetland response through recent millennia reveal considerable resilience in the upper (Tibby et al., 2003), middle (Gell et al., 2005) and lower reaches (Fluin et al., 2007) of the catch-ment. The modern stressed wetland conditions are clearly not the result of climate change alone. Indeed, the shifts in wetland conditions at both local and catchment-wide scales coincide with the history of European settlement. All the wetland sites studied were shown to be vulnerable to human impact: some changed their condition early in settlement; some may have resisted slow change but eventually changed abruptly through an internal dynamic; yet others collapsed with the additional climate driver of extreme drought.
A large-scale analysis of wetlands across the MDB yields four typologies (Figure 2 (ii)), with large, deep wetlands in the middle reaches most vulnerable to state switches that are reinforced by feedbacks between nutrients, sediments and light regime (Reid, 2008; Walker and Salt, 2006). These wetland types are vulnerable because large proportions of the wetland’s substrate become separated from the photic zone as soon as transparency declines. Many palaeolimnological records show that turbidity, and widespread secondary salinisation and eutrophication, have affected many systems adversely and often coincidentally. These have been attributed to the interaction of the drivers and stressors (Gell et al., 2007), including accelerated erosion from salinity-driven sodic-ity,3 nutrient enrichment from the mobilisation of buried phosphate through accelerated erosion
(Gell et al., 2006) and the amplifying effects of eutrophication on turbidity (Figure 2(iv)). Further, permanent inundation of wetlands bordering rivers above locks has led to the accumulation of sulphate salts and their bacterial reduction to sulphides driven by enrichment. More recently (1997–2010), an extended drought has lowered water levels inducing widespread acidification.
While long-term climate reconstructions attest to the capacity of these systems to withstand past drying, the recent additive effects of multiple stressors have diminished the resilience of the aquatic ecosystems, leaving them vulnerable to an extreme climate event, and causing them to transform to unprecedented states with no past analogues. This is recognised at the national scale, with Laurance et al. (2011) identifying MDB wetlands as one of ten national ecosystems at risk from moving close to a tipping point and abrupt change. The drought, and scenarios of diminishing
growing season rainfall (Giorgi, 2006), now challenge the capacity of basin communities to adapt. With an evolutionary social-ecological system perspective, it is clear that over-allocation of water resources, and diminished adaptive capacity of the natural system, now jeopardise the industries that underpin the regional economy and society: the feedback loop that links human-driven eco-logical degradation to a loss of key ecosystem services is strengthening.
In general terms, the case study demonstrates how the resilience of natural ecosystems to cli-mate change is strongly linked to the degree of human modification. However, it also demonstrates the variety of functional responses in one ecosystem to similar impacts. The difference in responses is mediated by the hydrogeomorphic context of the site, particularly its depth, wetting drying regime and position in the catchment. In most instances, the degree of transformational change renders restoration efforts particularly difficult even where the scientific understanding, will and resources are in place.
Lake Erhai, China: Regime shifts driven by eutrophication
Aquatic ecosystems are often shown to exist in alternative states (Scheffer et al., 1993). At the lake Erhai, in SW China, an integrated study of records from lake monitoring, lake sediments, meteoro-logical measurements and social-economic records provided insight into the mechanisms of a rapid shift from a mesotrophic to eutrophic4 state that took place in 2001–2002 (Wang et al., 2012).
During the 1990s, algal blooms were observed in some summer months but it was not until 2001 that they became an annual occurrence. Monitored algae concentration data and water quality data showed that levels of cyanobacteria and diatoms rose abruptly from 2002. Levels of dissolved nutrients in the lake increased up to 2003 before declining to reach new minima in 2008, mirroring the long-term decline in water transparency.
To investigate what had caused the system to switch states, long-term data records were selected on the basis of the postulated interactions within the lake-catchment system, particularly the likely positive feedback mechanism that forced the system towards and over the trophic threshold. In this case, increasing aquatic productivity was postulated to cause a reduction in dissolved oxygen that re-mobilises nutrients from the lake sediment back into the aquatic ecosystem, inflating aquatic productivity (Figure 3(i)). Lake sediment records of fossils of siliceous algae (diatoms) and geo-chemistry provided proxy time-series for the aquatic ecosystem and official statistical records recorded changes in population, climate, lake water level and animal and crop production (as a surrogate for nutrient loadings to the lake).
The dated diatom records, expressed as an index of species composition, reproduced the regime shift in 2001–2002 and showed that the algal communities were already changing in the 1960s (Figure 3(ii)). Historical catchment records suggested that this long-term trend in algal community composition was tracking nutrient loadings to the lake caused by agricultural intensification. Other records suggested that superimposed upon this ‘slow’ driving variable of nutrient loading were the influences of lake level and low rainfall as subannual ‘fast’ forcing variables (Figure 3(ii)). These ‘fast’ factors initiated several temporary eutrophication events after the 1980s. Proxy data for deep-water oxygen levels supported the postulation that as aquatic productivity grew in response to increased nutrient concentrations positive feedback mechanisms gradually strengthened the eutrophication process.
Two fundamental questions remained: could the regime shift have been anticipated, and once it had occurred could it be reversed? To answer the first question, the study applied the theory of early warning signals to the algal records. Initial results suggested that there was increased varia-bility from the 1980s onwards, indicative of the system ‘flickering’ between alternate states as it
(Continued) Figure 2. The nature of change in Murray River wetlands: (i) location of Murray-Darling basin with
studied sites. (ii) Conceptual model of wetland response types: I. Shallow upland wetlands – most substrate remains in photic zone, II. Deeper mid-catchment wetlands – most of the wet area removed
became unstable. Such signs of growing instability could have been used by environmental manag-ers as an early warning signal of an impending shift.5 The second question was addressed by
plot-ting the monitored data for diatoms for the period 1992–2008 against water quality (Figure 3(iii)). The plot shows two clusters of points, each with approximately linear trends indicating that more than one algal state is possible for a specific level of dissolved total phosphorus. This suggests that the type of regime shift at Erhai may be a fold bifurcation with hysteresis, implying that recovery to the first state may require the dissolved phosphorus to decline to considerably lower levels than the level at which the shift took place. This represents a real challenge for lake and catchment managers given the continued intensification of farming in the catchment. By way of illustrating this, lake managers raised water levels after 2004 to levels last seen before 1975, and the concen-trations of dissolved phosphorus have since reduced. But in 2010, the levels of chlorophyll a (a measure of cyanobacteria) were still roughly an order of magnitude higher than in 2000, the year before the regime shift: there is no sign of recovery.
Chinese rural communities: Defining safe and just operating spaces
The evolutionary perspective provided at Erhai (above) clearly showed that there were periods in the past century before the regime shift when the lake-catchment existed in a sustainable condition with respect to human activities and lake water quality: what might be referred to with hindsight as a ‘safe operating space’. It prompted new research into the use of long-term records to help identify whether a modern, regional social-ecological system was in a safe, dangerous or intermediate state. The research drew on the concept of safe operating spaces for humanity at the planetary scale (Rockstöm et al., 2009) and Raworth’s (2012) ‘doughnut’ framework that focuses on the social justice requirements underpinning sustainability. A safe and just operating space was defined as lying between a ‘social foundation’ that defines minimum social conditions and an ‘environmental ceiling’ that represents the ecological constraints on human activities in the natural environment (Dearing et al., 2014).
A first step was to develop a pragmatic guide for identifying ecological boundaries based on system dynamical behaviour observed in real world time-series drawn from monitoring, survey, remote sensing and sediment analysis (Figure 4(i)). The outcome was a scheme based on four types of boundary: regulatory limits; non-linear trends and variability; threshold-dependent; and early warning signals. To aid communication, categories of safe, cautious and dangerous spaces were colour-coded green, yellow and red. This simple imagery condenses powerful complexity concepts and time-series analyses into an easily understood qualitative basis of assessment.
Figure 2. (Continued)
from photic zone, III. Deeper lowland wetlands – turbid state reset upon drying, IV. Shallow lowland wetlands – dry regularly so no stable states. (iii) Modern wetland states (top left clockwise) – macrophyte-rich, clearwater wetland (in the Ovens River tributary), a turbid wetland with few submerged macrophytes (Kings Billabong), a salinised, lowland wetland (Tareena Billabong ), and a salinised lagoon that acidified in 2004 when drought exposed sulphidic sediments (Psyche Bend Lagoon). (iv) A driver-stressor-impact model of wetland degradation where enhanced sediment flux follows yellow arrows, nutrient enrichment follows blue arrows, salinisation follows green arrows. Feedback effects include the effect of sodicity on erosion, turbidity carrying sediment-bound phosphorus and the impact of eutrophication on transparency. Acidification arises from oxidation of sulphides formed by nutrient-mediated, sulphur-reducing bacteria.
Figure 3. Erhai, Yunnan: (i) A simplified systems dynamic framework for the Erhai eutrophication
process. The figure represents the stage of eutrophication in 2001–2002 when the positive feedback loop (dashed oval) involving recycling of phosphorus from sediments to lake was firmly established. The figure shows the diversity and interconnectedness of major external drivers (bold) of the lake algal community with typical relationships (+ and −) shown for major interactions; (ii) records of aquatic ecosystem responses and environmental drivers during the period 1883–2009. (a) One-dimensional gradients of sediment diatom composition and diversity based on detrended correspondence analysis (DCA axis 1 scores) (blue) and calculated Hill’s diversity index N2 (HDI) (orange) of non-interpolated sediment data. The DCA trend shows declining values from about 1965, with two sharp downward changes in about 1982 and about 2001. (b) The declining abundance of chironomid (non-biting midge) larval head capsules in the sediment (number/g sediment) after 2001 indicates increasing anoxia in the hypolimnion. (c) The abundance of calcium in the sediment (mg/g sediment) (black) rose in 1977 and after 2001, as a result of
The approach was trialled in two rural Chinese communities: the Erhai lake-catchment, Yunnan Province and Shucheng County, Anhui Province. Time-series for ecosystem processes/services were drawn from a combination of monitored instrument records and lake sediment proxy records of water quality, soil stability, air quality, sediment quality and sediment regulation. Each time-series was examined for trends, non-linear system behaviour and proximity to regulatory environ-mental limits. Social and economic data, other environenviron-mental data and relevant environenviron-mental regulatory limits were collected from official Chinese statistical yearbooks and government reports.
At Erhai, monitoring and palaeoecological data for water quality describe a hysteretic threshold change around 2001 that has taken the lake into the dangerous category represented by a highly eutrophic state (Wang et al., 2012). Water regulation over the past four decades has decreased the lake water level beyond the long-term envelope of variability but has recently changed from the dangerous to the cautious status. Three measures of air quality show mixed trends but the change in rate for lead (Pb) deposition in the sediments indicates a cautious status for emitted heavy metals in the current environment. Much longer sediment records (Dearing, 2008) show that the upland land use-soil system currently sits in the dangerous category, having settled into an alternate degraded steady state about 850 years ago. The social foundation is almost met in terms of health-care but provision of food, water and sanitation falls short by substantial margins.
Previous research at Shucheng County (a ‘poverty-stricken county’) had shown that the region had underone serious environmental degradation as a result of intensive agricultural activities during the last 60 years (Dearing et al., 2012b). The palaeoecological records show that water quality, sediment quality and air quality have moved into the dangerous status, with soil stability given cautious status in response to the increasing volatility in the recent records. Like Erhai, the lake water quality transition is probably hysteretic (Wang et al., 2012) implying that the modern degraded condition will be difficult or impossible to reverse. Levels of sediment-associated P from intensive farming and deposited Pb from local fossil-fuel powered industries are not only very high by international standards but also 80–100% higher than pre-1960s levels. The social foundation is almost met in terms of food security, healthcare and minimum income, implying that the government strategy of providing extra resources to ‘poverty-stricken’ counties is rela-tively successful. But like Erhai, access to piped water and sanitation still lags behind other pov-erty alleviation measures.
the biologically induced precipitation of CaCO3 (calcite). The total sediment phosphorus abundance (P
mg/g sediment) (yellow) gradually rose from the 1960s; however, compared with calcium, there was only a small rise after 2003, suggesting partial depletion of sediment phosphorus as a result of anoxic recycling. (d) Sediment total organic carbon (TC%) (blue) and nitrogen (TN%) gradually rose from the 1960s and abruptly rose after 2001, indicating rising levels of sedimenting organic matter as a result of increased aquatic productivity. € Historical records of the annual crop yield in the region from a constant land area (blue) imply that agricultural intensification occurred from the 1960s and peaked initially in 2000. Historical records of the lowest annual lake water level (in metres above sea level (m.a.s.l.; pink), showing the combined effects of sluice building on outflow regulation for hydroelectric power and dry years after 1975. It should be noted that relatively high water levels were maintained in 2004 and 2005, after the trophic shift. (f) Mean annual rainfall (green) and temperature (purple); (iii) A phase-space plot of the dissolved nutrient driving variable (total phosphorus, TP) versus the diatom state response variable (DCA). The plot describes two linear clusters of points, 1992–2001 (upper black dashed line) and 2001–2009 (lower black dashed line), suggesting two alternative diatom states for all TP values in the range 0.02–0.03 mg/l, which is equivalent to ~50% of the whole TP scale: this finding is strong evidence for alternative states and hysteresis (Wang et al., 2012).
Mapping the ecological boundaries with respect to the regional environmental ceiling and social foundation highlights the importance of water, soil and air quality management (Figure 4(ii)). Taking these preliminary findings together suggests that the process of economic development, particularly through agricultural intensification largely based on increasing fertiliser applications, has reduced but not eradicated poverty. In particular, there are clear trade-off in terms of deteriora-tion of key ecological processes and condideteriora-tions that have led to dangerous threshold changes in lake water quality.
As with many other developing regions, there is a challenge for local governments to balance the alleviation of poverty that can come through economic development with potentially
Figure 4. Safe and just operating spaces in Chinese rural communities: (i) A classification of possible
system behaviour as an ecological boundary is reached showing Types I, II, III and IV, with colour-coded categories (green, yellow and red) for attributed ‘safe’, ‘cautious’ and ‘dangerous’ status of key ecological services/processes and respectively. (ii) Safe and just operating spaces mapped for (a) Erhai lake-catchment system, Yunnan Province; (b) Shucheng County, Anhui Province. The figures show the extent to which each region currently meets expected social standards (blue sectors) for an acceptable social foundation (green circle), and the current status of key ecological services/processes safe (green sectors), cautious (yellow sectors) and dangerous (red sectors). The environmental ceiling (red circle) defines the approximate boundary between sustainable and unsustainable use of ecological processes. The safe and just operating space exists as a ‘doughnut’ between the environmental ceiling and social foundation. Note that the relative sizes of green, yellow and red sectors are illustrative: they are not plotted to any scale and are not plotted from the centre of the circles. Blank sectors indicate unavailability of data (Dearing et al., 2014).
irreversible and costly environment damage. The safe and just operating spaces concept offers a clear visual image for making comparisons between different regions and, potentially, provides a basis for assessing a region’s impact on planetary boundaries. The outputs could usefully inform the Post-2015 UN Development Agenda and new Sustainable Development Goals (United Nations, 2012).
The Great Lakes, USA: Ecological recovery following environmental regulation
Aquatic ecosystems in the Great Lakes region of North America have been significantly impaired by deforestation, urbanisation and industrialisation since Euro-American settlement in the late 1700s (Alexander, 2006). US environmental legislation of the early 1970s (e.g. Clean Air and Clean Water Acts) was enacted in an effort to remediate vital ecosystem services and prevent fur-ther degradation. Coupled with various watershed-scale management strategies, the Great Lakes region has shown significant improvement in water quality in recent decades. Reduced loading of metals and nutrients are reflected in sediment geochemistry and fossil diatom biostratigraphy of a sediment core from Muskegon Lake, Michigan, USA, a Great Lakes tributary (Figure 5(i)). However, palaeoecological data trends do not indicate that the system has stabilised, or returned to pre-Euro/American settlement baseline conditions. Moreover, it is unclear how modern stressors such as climate variability (Long et al., 2010; Magnuson et al., 1997), invasive species (Lougheed and Stevenson 2004; Steinman et al., 2008) and further land-use change (Pijanowski et al., 2007; Ray and Pijanowski, 2010; Tang et al., 2005) will affect system recovery.
Muskegon Lake is an inland water body (W 86°18′, N 43°14′) at the end of a drowned river mouth system that connects the Muskegon River to the coastal zone of Lake Michigan (Parsons et al., 2004; Steinman et al., 2008). This general ecological setting makes Muskegon Lake an impor-tant fishery, despite a history of intense anthropogenic activity since the early 1800s (summarised in Figure 5(ii)) (Lake Michigan Lakewide Management Plan, 2004). During the 1880s, the city of Muskegon had more than 47 sawmills, followed by an industrial base with oil and chemical indus-tries contributing over 100 000 m3/day of wastewater discharged into the lake until a tertiary Waste
Water Treatment Plant (WWTP) was installed in 1973 (Alexander, 2006; Freedman et al., 1979; Steinman et al., 2008).
Geochemical data from the sediment core showed a suite of elements associated with anthropo-genic activity (e.g. Cr, Pb and Sn) with similar profiles, which track the history of human activity (Figure 5(iii)). Trends for individual elements are seen to vary in relation to specific industrial activity and eventual policy mandates. For example, lead (Pb) decreased from a peak of ~325 ppm in the mid-20th century to ~60 ppm in modern sediment, reflecting significant recovery after the use of leaded gasoline was discontinued in the 1970s. Notably, results show that the contemporary sediment geochemical measurements of anthropogenic proxies have not returned to baseline con-centrations (e.g. ~11 ppm for Pb) owing to the legacy effect of the pollutants in the watershed. Productivity related elements, including sediment P (Figure 5(iv)) and Ca, indicated changing nutrient inputs to the lake (presumably related land-use change) and hinted at the feedback mecha-nisms that were further gleaned from the fossil diatom record.
Biological change in Muskegon Lake, inferred from fossil diatoms, suggests that the pre-Euro/ American settlement community structure is markedly different from that of modern assemblages. Figure 5(v) includes biostratigraphic changes that correspond to water chemistry changes resulting from agricultural development, industrialisation and urbanisation of the watershed. For example, taxa indicating high nutrient conditions (e.g. Stephanodiscus spp.) have peak abundances dated between 1930s and 1970s when nutrient inputs were increasing because of agriculture and urbani-sation. Productivity regimes in the lake, reconstructed from diatom habitat structure, identified a
F
igure 5.
Great Lakes ecological recovery: (i) Muskegon River Watershed location map. (ii) Trends of land-use change since 1900 (Ray and
Pijanowski, 2010),
population data for Muskegon county since 1860 (US Census) and regional scale human impacts since Euro-American settlement. WWT
P = Wastewater
Treatment Plant. (iii) Profiles of select anthropogenic elements with concentrations normalised to highest concentration of eac
h element. (iv) Normalised
sediment phosphorus (P) profile (as a measure of water quality) with measured concentrations of water column soluble reactive P
and water column total P
from 1972 and 2005 (Freedman et al., 1979; Steinman et al., 2008). (v) Relative abundances of select fossil diatoms indicative
(regime) shift from planktonic- to benthic-dominated productivity in the top 25 cm of the core which occurred after the installation of the WWTP in 1973.
Much of the water quality improvements in the past 30 years, reported by Freedman et al. (1979) and Steinman et al. (2008), are presumably attributed to the WWTP installation. Decreases in lake-wide averages of total P and soluble reactive P at the water surface range from 68 to 27 μg/l and from 20 to 5 μg/l, respectively, from 1972 to 2005. In addition, average chlorophyll-a concen-trations have declined by 19 μg/l over this period, while Secchi disk depths have increased from 1.5 to 2.2 m (Freedman et al., 1979; Steinman et al., 2008). This partial recovery corresponds to the shift in dominant habitat of primary productivity, as the relative abundance of planktonic-domi-nated taxa at the bottom of the core (i.e. in pre-settlement times) is between 56% and 77%, peaks at 88% in 24 cm depth (dated to 1970 at the peak of cultural eutrophication), and then quickly decreases to 26–37% in the top 8 cm of the core. The productivity shift in the top 8 cm (benthic taxa become 54–64% dominant) may also be influenced by the invasion of Dreissena polymorpha (zebra mussel).
This case study demonstrates that integrating historical records with high-resolution palaeoeco-logical data is an effective way to capture stressor–response relationships and evaluate social-ecological dynamics. Overall, the condition of the Muskegon Lake watershed has dramatically improved as the result of environmental management efforts, and this example can be used as an indicator for the recovery of the larger Lake Michigan and Great Lakes system that it feeds. Despite improvements, these data indicate the system is still changing in response to human impacts at the regional scale, suggesting that sustainable management strategies require continued monitoring to help decision-makers define restoration targets.
European human-impacted landscapes: Managing biodiversity
Most European landscapes have a long history of human interaction largely through agricultural activities. Therefore, a major challenge for nature conservation and landscape managers is main-taining and protecting habitats and landscapes with high biodiversity in rapidly changing national parks, forests and grazing lands. Records of past vegetation, flora and fauna coupled with narra-tives on human impact, and data drawn from historical studies and archaeology can increasingly provide appropriate insight (e.g. Cui et al., 2013, 2014; Gaillard et al., 2009; Galop et al., 2011; Hannon et al., 2010; Lindbladh et al., 2008, 2014). Here we summarise two case studies from the Pyrenees and southern Sweden that demonstrate how the lessons provided by integrating palaeo-ecological and other records can be used in nature conservation.
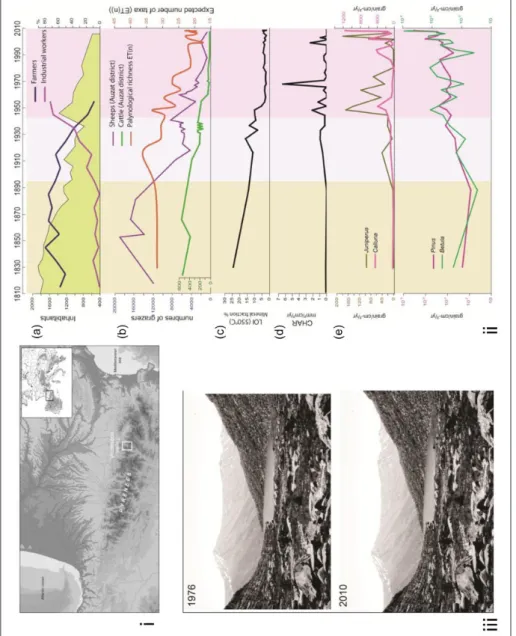
The Pyrenean Mountains have been under intense human impact since the Bronze Age (Galop et al., 2013) but have undergone major transformation during the last century. Owing to rural depopu-lation, traditional pastoral management has declined since the 1950s (MacDonald et al., 2000). In the Vicdessos area (Eastern Pyrenees – Figure 6(i)), as in many European Mountains, progressive depopulation with the associated abandonment of former management practices has led to fast reforestation of the slopes and an extension of heathlands and forests in pastoral uplands (Houet et al., 2012). The additional consequence of these changes observed in many Pyrenean areas is a loss of open area, landscape heterogeneity and vegetation ‘mosaics’, which represent a loss of biodiver-sity and cultural landscape (MacDonald et al., 2000). Moreover, modern forestry is not favoured owing to difficult access. The environmental managers (National Parks, natural reserves, national forestry board) are confronted with maintaining a balance between conservation and economic activities, in order to achieve social acceptance of the ‘protection’ measures that have been imple-mented. This requires a detailed knowledge of the historical relationships between environmental dynamics and, for example, grazing. The beneficial effect of grazing on plant diversity is well
Figure 6.
The Pyrenees Mountains: (i) location Vicdessos valley in eastern Pyrenees. (ii) Trajectories of changes observed since the beg
inning of the 19th
century in the Bassiès valley based on historical and palaeodata (adapte
d from Galop et al., 2011). (a) Evolution of the Auzat commune population; (b)
comparison between the evolution of grazing pressure recorded in agricult
ural statistics of the Auzat commune and the estimated palynological richness
(ET(n)) inferred from pollen records from the Orry de Théo peat bog; (c) ash content (LOI 550°C), (d) charcoal (>150 µm) a
ccumulation rate and (e)
pollen accumulation rates of selected taxa recorded in the Orry de Théo peat bog. (iii) Repeat photography between the period
1976 and 2009 illustrates
a fast increase in tree density (
Pinus uncinta
established today (Canals and Sebastià, 2000; Komac et al., 2014), but the question of how to define the thresholds, i.e. what would be too low versus too high a grazing pressure, is still not solved. Integrated studies of historical trajectories in various pastoral areas, presently either aban-doned, or with different grazing pressures, have helped to define these thresholds and other related guidelines for the managers.
Palaeoecological data (pollen, charcoal and loss-on-ignition data) from the Vicdessos area (Figure 6(i)) illustrate the history of vegetation cover, soil erosion and fire in relation to grazing activities over the last 200 years (Galop et al., 2011) (Figure 6(ii)). The palynological richness, assumed to reflect flora and landscape dynamics over time, was compared with documentary sources (demographic and pastoral data). A positive effect is shown on Figure 6(ii) between graz-ing pressure and floristic richness. A decrease in grazers is observed at the beginngraz-ing of the 1900s, soon followed by a decrease in floristic diversity. A threshold is reached in the 1950s where the decline of sheep flocks associated with a modification of pastoral practices leads to under-grazing. This promotes the overgrowing by Juniperus and Calluna heathlands and the expansion of trees (Pinus and Betula), no longer controlled by browsing. Pastoral fires are recorded between 1950 and 1970, indicating that livestock-raising farmers most likely used these surface fires to restore and maintain the quality of forage in upland areas. From the 1940s, a decrease in the number of farmers has progressively led to a near-total disappearance of grazing activity. In these previously grazed areas, an inevitable and probably irreversible (except through expensive restoration actions) return to forest (colonisation by pine-dominated forest, Figure 6(iii)) has led to a decline in floristic diversity. In this way, the local case study of the Bassiès Valley provides information for managers on diversity baselines, thresholds and the resilience of the mountainous ecosystems to anthropo-genic disturbances.
For a long time, the forested regions of southern Sweden were part of a diverse cultural land-scape with many land uses (e.g. Cui et al., 2014). In general, major management initiatives have focused on the remnants of ancient hay meadows and non-fertilised grazing lands. These ecosys-tems are characterised by the highest floristic diversity (in terms of number of species and species evenness) in Sweden with numbers of species per m2 of 30–40 and 20–30, respectively (Bernes,
2011). However, woodlands may also contain high biodiversity, in particular faunistic diversity (e.g. coleopteran) but also fungi and lichen diversity (Bernes, 2011; Lindbladh et al., 2003).
Småland is a potential biodiversity hotspot owing to the mixed temperate and boreal character of the hemiboreal vegetation zone (Ahti et al., 1968; Bernes, 2011). In the modern forested land-scapes, remains of traditional cultural landscapes with high biodiversity are few, isolated and small in area (e.g. Gaillard, 2009). The integration of pollen, plant macrofossil, charcoal, and insect stud-ies with archaeological and historical records shows (Figure 7(i)) that regular fire and agrarian disturbances are necessary for biodiversity to be maintained (Cui et al., 2013; Olsson and Lemdahl, 2009, 2010). Several species of insects and plants that are extinct in the region, or red-listed, need either woodland fire, Calluna (heather) heath environments (also with regular fires), or relatively open woodlands with mixtures of conifers and deciduous trees that encourage sun-exposed trees and dead wood. The palynological diversity since ~3500 BP shows fluctuating values (Figure 7(ii)). The decreases in diversity between 2500 and 1500 BP (Early Iron Age), the Early Middle Ages, and around ad 1700 are due to periods of decreased impact of human activities on
vegeta-tion, in particular in terms of landscape openness, caused by war, socio-economic factors and cli-mate change. The recent decrease in palynological diversity reaches the same level (15) as seen before the increase in diversity as a result of land use that occurred after ~3500 BP. This decrease corresponds to the profound transformation of the landscapes of the region through agricultural reforms from the 18th century onwards (Figure 7(iii)). The highest diversity at the landscape scale was reached after ad 1500 and until c. ad 1850. Many similar detailed studies (Cui et al., 2013,
2014; Lindbladh et al., 2003, 2007, 2008, 2013; Olsson and Lemdahl, 2009, 2010) have contrib-uted to a significant improvement in the understanding of historical changes in biodiversity and their causes. However, the lessons provided by long-term perspectives for the conservation, pres-ervation and promotion of biodiversity still require major integrated efforts that involve all actors in modern forestry management.
Figure 7. Recent loss of biodiversity seen in the perspective of Holocene vegetation and land-use history
in the hemiboreal zone of southern Sweden, province of Småland. (i) The province of Småland in southern Sweden with location of three palaeoecological sites (red dots). (ii) Pollen-based LOVE model (Sugita, 2007) estimates of plant cover for major taxa (Stavsåkra), palynological diversity ET(n) (Stavsåkra), and charcoal accumulation rates (number of charcoal fragments per cm2 and year) (blue: macrocharcoal ⩾ 250
µm; red: microcharcoal < 175 µm) at Stavsåkra (left) and Storasjö (right). The fire regimes from 1500 bc
are human-induced (more fires at Storasjö because there was more pine) and promoted both landscape openness and biodiversity at the landscape scale (Cui et al., 2013; Olsson and Lemdahl, 2009, 2010). (iii) Recent transformation of the landscape from ad 1700 to present (left panels) based on historical maps
and plant cover from 1050 bc to present (right panels) based on pollen-based LOVE estimates (% cover)
in an area of 3 km radius around each of the three sites in Småland (Cui et al., 2014). Both the historical maps and the LOVE model reconstructions show between-site differences in landscape/vegetation characteristics through time with profound losses of grasslands (light green) and wetlands (blue) resulting from the agrarian reforms of the 18th and 19th centuries in southern Sweden and the expanding modern agriculture (cultivated field, orange) and sylviculture (dark green).
Discussion
We have shown how multiple sources of historical data can be brought to bear on the problems faced by different social-ecological systems. The case studies highlight the importance of understanding context-dependent outcomes as the end product of converging trajectories of environmental change operating at the regional scale. Although there are similar environmental problems in many parts of the world (e.g. access to clean water, dynamic grazing regimes, biodiversity loss, etc.), each region has its own evolutionary social-ecological system and legacy of human interaction with the environment.
Recognising the above, the PAGES Focus 4 Regional Integration theme (Past Global Changes, 2010) promoted a problem-orientated and place-based approach to regional studies, where inte-grated social-ecological histories are used to identify patterns in temporal and spatial data. Using the background of resilience theory and complex systems science, the patterns would be studied in order to assess the potential for resilience and adaptation in current social and ecological processes. In a regional integration framework, human impacts are fully integrated with studies of natural systems. In the future, for this approach to be successful, it may be necessary to involve all poten-tial stakeholders at the onset of the study in order to define key research questions. Thus, the out-comes of regionally integrated research will be highly relevant and maximise the chance to influence sustainable management policy and practice.
In this review, we have refrained from detailing the role of modelling social-ecological systems, choosing rather to examine and highlight the important role for empirical records. However, there are several important and complementary links with numerical modelling (Anderson et al., 2006; Dearing et al., 2006b). Complexity concepts such as fold bifurcations and early warning signals originated in the mathematical and physical sciences (Dakos et al., 2008; Lenton et al., 2008, 2012; Scheffer et al., 2012). Where they appear in records from the real world there is the opportunity to test the concepts through data-model comparisons (e.g. Wang et al., 2012). In some situations, data-model comparisons over the period of past records can also help explain the dynamic relation-ships observed in the empirical records (e.g. Welsh et al., 2009). Forward-looking numerical mod-els that aim to simulate current social-ecological behaviour, while capturing complexity-like feedback mechanisms, are becoming more common. Systems dynamic, agent-based and cellular automaton-type modelling approaches are all potentially valuable for exploring how policies and changes in external forcing (e.g. climate) will lead to alternative near-future conditions. The empir-ical records not only provide the frameworks for developing forward-looking models but also a degree of model testing and validation.
Eventually, the comparison of integrated social-ecological histories from different regions should generate evidence for widespread dynamical patterns: drivers of change and responses, changing boundary conditions, safe and just operating spaces, tipping points, and sensitive and resilient systems. This could lead to an extension of the social-ecological syndrome concept pio-neered by Lüdeke et al. (2004), with a new typology of social-ecological dynamics based on an evolutionary rather than static perspective. Such a typology would inform a nomethetic approach to implementing policies, even in the absence of local knowledge, thus moving part of the way towards addressing the issue of the ‘crisis science’ (cf. Cracraft et al., 1999) where immediate solu-tions are sought for problems for which little baseline evidence exists.
Acknowledgements
The University of Southampton provided staff and logistical support for the workshop. This is a Sustainability Science at Southampton publication.
Funding
We thank PAGES for financial help, through its funds from the Swiss and US National Science Foundations and the US National Oceanic and Atmospheric Administration.
Notes
1. The upper, warmer layer of lake water.
2. Linked to the theory that as an economy develops it reaches a point where environmental quality begins to improve.
3. Soils with excess salts dominated by sodium chloride.
4. Referring to lakes with medium (mesotrophic) and high (eutrophic) levels of nutrients. 5. See also Carstensen et al. (2013).
References
Ahti T et al. (1968) Vegetation zones and their sections in north-western Europe. Annales Botanici Fennici 5: 169–211.
Alexander J (2006) The Muskegon: The Majesty and Tragedy of Michigan’s Rarest River. East Lansing, MI: Michigan State University Press, pp. 1–214.
Anderies JM et al. (2004) A framework to analyze the robustness of socio-ecological systems from an institu-tional perspective. Ecology and Society 9: 18 pp. Available at: http://www.ecologyandsociety.org/vol9/ iss1/art18.
Anderson NJ et al. (2006) Linking palaeoenvironmental data and models to understand the past and to predict the future. Trends in Ecology and Evolution 21: 696–704.
Bernes C (2011) Biodiversity in Sweden. Monitor 22. Stockholm: Naturvårdsverket (Swedish Environmental Protection Agency), 280 pp.
Bourgeron PS et al. (2009) Regional analysis of social-ecological systems. Natures Sciences Sociétés 17: 185–193.
Canals R-M and Sebastià M-T (2000) Analyzing mechanisms regulating diversity in rangelands through comparative studies: A case in the southwestern Pyrenees. Biodiversity and Conservation 9: 965–984. Carpenter SR (2002) Ecological futures: Building an ecology of the long now. Ecology 83: 2069–2083. Carpenter SR et al. (2009) Science for managing ecosystem services: Beyond the Millennium Ecosystem
Assessment. Proceedings of the National Academy of Sciences US 106: 1305–1312.
Carstensen J et al. (2013) Diatom flickering prior to regime shift. Nature 498: 7455. DOI: org/10.1038/ nature12272.
Chambers FM et al. (1999) Recent rise to dominance of Molinia caerulea in Environmentally Sensitive Areas: New perspectives from palaeoecological data. Journal of Applied Ecology 26: 719–733.
Chambers FM et al. (2007) Palaeoecology of degraded blanket mire in South Wales: Data to inform conserva-tion management. Biological Conservaconserva-tion 137: 197–209.
Chambers FM et al. (2013) Long-term palaeoecological study (palaeoecology) to chronicle habitat degrada-tion and inform conservadegrada-tion ecology: An exemplar from the Brecon Beacons, South Wales. Biodiversity
and Conservation 22: 719–736.
Costanza R et al. (2007) Sustainability or collapse: What can we learn from integrating the history of humans and the rest of nature. Ambio 36: 522–527.
Cracraft J et al. (1999) The Living Planet in Crisis. New York: Columbia University Press, 0231108648. Crutzen P (2002) Geology of mankind. Nature 415: 23.
Cui QY et al. (2013) The role of tree composition in Holocene fire history of the hemiboreal and south-ern boreal zones of southsouth-ern Sweden, as revealed by the application of the Landscape Reconstruction Algorithm: Implications for biodiversity and climate change issues. The Holocene 23: 1747–1763. Cui QY et al. (2014) Historical land-use and landscape change in southern Sweden and implications for