HAL Id: hal-01324990
https://hal.archives-ouvertes.fr/hal-01324990
Submitted on 18 Oct 2017
HAL is a multi-disciplinary open access
archive for the deposit and dissemination of
sci-entific research documents, whether they are
pub-lished or not. The documents may come from
teaching and research institutions in France or
abroad, or from public or private research centers.
L’archive ouverte pluridisciplinaire HAL, est
destinée au dépôt et à la diffusion de documents
scientifiques de niveau recherche, publiés ou non,
émanant des établissements d’enseignement et de
recherche français ou étrangers, des laboratoires
publics ou privés.
Levels, peaks, slopes... which sampling for which
purpose?
Brigitte Bidégaray-Fesquet, Laurent Fesquet
To cite this version:
Brigitte Bidégaray-Fesquet, Laurent Fesquet. Levels, peaks, slopes... which sampling for which
pur-pose?. Second International Conference on Event-Based Control, Communications, and Signal
Pro-cessing, Jun 2016, Krakow, Poland. pp.1-6, �10.1109/EBCCSP.2016.7605261�. �hal-01324990�
Levels, peaks, slopes. . .
which sampling for which purpose?
Brigitte Bidegaray-Fesquet
Laboratoire Jean Kuntzmann, Univ. Grenoble Alpes CS 40700, F-38058 Grenoble Cedex 9
Email: [email protected]
Laurent Fesquet
TIMA, Univ. Grenoble Alpes and CNRS 46 av. F´elix Viallet, F-38031 Grenoble Cedex
Email: [email protected]
Abstract—There are many ways to nonuniformly sample a signal, the most widely used, but not only, way to perform it being level crossing. The targeted application, and also the characteristics of the signal, can lead to various choices of samplings, to ensure a good representation of the input signal or robustness with respect to noise.
I. INTRODUCTION
Nonuniform samples can stem from an external source, and in this situation it is usually considered as a drawback for the subsequent processing. It is so when then sampler is not always available, or when it is perturbed (jitter, missing samples. . . ). Here we consider the case when nonuniformity is wanted, first as a way to compress the signal. This reduction is an effective way to reduce power consumption in electronic systems since there exists a direct relation between activ-ity and dynamic power. Considering today’s system power requirements, mitigating the system activity is becoming an important issue for autonomous communicating objects or mobile systems. Indeed, less data to process, store and transmit is the way to decrease power consumption. It can be processed on systems that are event-based and naturally produce and treat nonuniform samples. Another characteristics of such a setting for embedded systems can also be a lower electromagnetic emission and also a stronger protection to spying attacks since the signature of asynchronous operations is less clear than synchronous ones.
Once uniformity is discarded, they are many ways to be nonuniform, more than ways to be uniform. Apart from the less regular mathematical structure, this variety is one reason why it is more difficult to give general results and propose generic algorithms for nonuniform samples, since the way samples have been captured also carries information.
We explore here a few classical techniques to do this, assuming we know the application and general features of the signal (eg. bandwidth, range, or statistical regularity), but no more. We do not address here the case when the system could fix levels or bounds from a deeper knowledge of the signal, or adapt them during the processing through a learning procedure. An already well studied sampling from the point of view of applications is level crossing sampling [1]–[3] but a lot remains to do from a theoretical point of view [4]. We can use instead peak sampling, or combine both [5]. Other systems do not focus on values of the system but on their variations. This is the case of derivative level-crossing sampling which is described in [6]. Here we explore what we call slope sampling, for which
the sampling criterion is some Lebesgue norm distance to an oversampled signal and for which samples are taken when the slope varies significantly.
II. VARIOUS TYPES OF SAMPLING
In this section we discuss various types of samplings and fix the notations. To show the samples, we first choose a short fragment of an ECG signal, which is a sporadic and noisy signal.
A. Level crossing
Since we do not want to adapt here the sampling to the signal, we only suppose that we know the range of the signal and consider a predefined set of levels that encompasses this range. Each time the continuous signal crosses one of these levels, a sample is taken together with the time elapsed since the previous sample was taken. It forms the couple (xn, δtxn), where xn and δtxn are respectively the amplitude
of the signal at the nth sampling time and the time delay (see Figure 1). In fact, this approach is dual to the classical sampling that captures uniformly in time the samples. Indeed, in the classical case, the instants are perfectly known and the amplitudes are quantized, while, in nonuniform sampling, the instants are quantized and the amplitudes are perfectly known. This has been studied for several years from the theoretical point of view [7]–[9] and practical implementations have been proposed several years later [10]–[12]. Note that all the discussion in this paper about level crossing sampling will also apply to send-on-delta sampling which only differs in a global shift of the levels (when they are uniformly distributed) and a decimation of successive samples of equal amplitude.
The main advantage of such a sampling scheme is its ability to adapt the number of samples to the signal variations. In the active signal parts, the signal often crosses the levels inducing a lot of samples, whereas, in the silence parts, the signal stays for a while between two levels and no sample is taken. Therefore, for smoothly varying or sporadic signals, the number of samples can drastically be reduced compared to the classical sampling technique [7], [13], [14]. This is demonstrated on our ECG fragment in Figure 2.
The next step after sampling is often an interpolation to provide (at least theoretically, for algorithm construction) a continuous-time signal. It has been noticed that for many ap-plications zeroth- or first-order hold reconstruction is sufficient and that no practical gain is obtained by using a higher-order
time xn−1
xn
δtxn
Fig. 1. Principle and notations for level crossing sampling.
Fig. 2. Demonstration of level crossing sampling on a small ECG fragment.
interpolation of samples [15]. We see in Figure 2 that there are many consecutive samples with the same amplitude. In each series of such samples only one or two samples are needed to lead to exactly the same zeroth- or first-order reconstruction and therefore subsequent processing. The samples of Figure 2 can thus be further decimated to remove unneeded same amplitude consecutive samples.
A possible way to capture less samples, and thus decrease as much as possible the activity, is to reduce the number of levels. Nevertheless, applications need to fulfill conditions such as accuracy and relevance of the data, which limits the reduction of the level number. But it is also corollated to the level position and an appropriate positioning of the thresholds can drastically reduce their number. It has been demonstrated by [16], [17]. In this work, the signal and the application are first studied. Then a method is proposed where a classifier is used for extracting the optimal threshold number and placement. The paper demonstrated that, with only four thresholds optimally placed, it is possible to reduce by two orders of magnitude the number of samples. This shows the potential of such an approach where the level positioning is not necessarily uniform and accurately chosen with an a priori knowledge of the signal and the application.
Fig. 3. Demonstration of peak sampling on a small ECG fragment.
B. Peak detection
Peak detection consists in taking a sample each time a local minimum or maximum is detected. On the same model as for level crossing, it leads to samples of the form of couples, (yn, δtyn), yn denoting the amplitude of the signal at the nth
sampling time and δtyn the time delay. This is demonstrated
on our ECG fragment in Figure 3.
The analysis of an ECG diagramme is typically the de-tection of characteristic points and among them peaks, but clearly peak sampling is not well adapted to noisy signals. Although it is not designed as a filter, level crossing sampling naturally filters high frequency components of the signal which have a small amplitude (it is typically the case of noise). Peak sampling does exactly the contrary and it exacerbates noise. Moreover a monotonous signal, even with a large variation, would lead to no sample, since there would be no local extremum.
One advantage of this sampling is however that it only depends on the signal and not on a set of predefined levels like in level crossing sampling or quantum like in send-on-delta sampling.
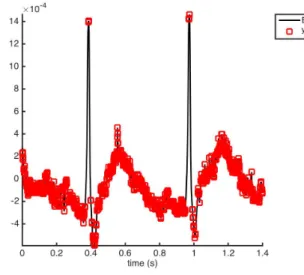
C. Levels and peaks
Apart from successive equal amplitude samples, we see another feature on the samples of Figure 2: in the very rapid large amplitude peak (named as QRS complex) there is a number of unnecessary samples in the rapidly increasing and rapidly decreasing parts, when keeping the lower and higher samples would lead to a very similar first-order reconstruction. Following [5] we can combine the advantages of level crossing and peak samplings. We first sample with level crossing. It already yields a first compact and denoised version of the signal. Then we detect local maxima and minima in the level crossing samples and keep only these samples. This once more yields (zn, δtzn) amplitude–delay couples, that are depicted in
Figure 4.
We keep the main drawback of peak detection: if there is no peak in the original signal (monotonous signal, or small
Fig. 4. Demonstration of level and peak sampling on a small ECG fragment.
peaks that are not detected with the chosen levels) there still is no sample with this technique. But there are some gains, in particular in the relevance of the captured data. Indeed, level crossing is limited in the number of levels in order to be competitive with Nyquist sampling. If it is coupled with peak sampling, we can relax this constraint. For a regular signal, in parts that are predominantly linear, adding more levels would not lead to more samples since linear parts will be decimated. To that, we have more chance to catch the real value of the peaks, since more levels (in the same range) means less peak clipping.
In the three previous types of sampling, for example in the case of a constant signal, no sample can be taken for a long time, inducing a large cumulative error between the real signal and the sampled one. In particular in level crossing sampling, the error which is considered is mainly a L∞-error. In the sequel, we propose a sampling type that takes into account other Lebesgue-norm errors.
In the previous samplings the samples are taken when some event occurs (level-crossing and/or change of slope sign). It could be performed on a continuous-time signal, or on a finely sampled signal that mimics a continuous signal for the purpose of numerical experiments.
D. Slopes
Slope sampling supposes that there exists a pre-existing sampling (regular or not), but original samples are not neces-sarily stored, they can just be captured and kept or not by the nonuniform slope sampler. As for level-crossing where levels should be predefined, there is also an external parameter to the input signal, which is a tolerance ε, and the choice of a norm. The principle is shown in Figure 5. The point labelled 1 is the first sample of the input signal (or the last sample that has been kept during the process). Then the two following points (labelled 2 and 3 are explored). If the distance between the signal described by points (1,2,3) is ε-close to the signal described only by poins (1,3), then point 2 is discarded. For the L1-norm this corresponds to measuring the surface of the dark gray triangle. Then point 4 is explored and if the signal
1 2
3 4
Fig. 5. Principle and notations for ”slope sampling”.
Fig. 6. Demonstration of slope sampling on a small ECG fragment.
described by points (1,2,3,4) is ε-close to the signal described only by points (1,4), point 3 is also discarded, and so on. When the distance is too big, the last but one point is kept and plays the role of point 1 in the subsequent processing.
This type of sampling, as level crossing, has a tendency to filter small amplitude noise. Depending on the type of input signal it can lead to a drastic reduction of the number of samples. Contrarily to level-crossing, it ensures that even if the signal has only small variations, samples will eventually be taken since small errors accumulate. We denote by (wn, δtwn)
the induced amplitude–delay couples. The samples obtained for the ECG fragment are depicted in Figure 6 for a 3 10−2 tolerance on the L1-norm.
III. NUMBER OF SAMPLES
In regular sampling, the number of samples depends only on the sampling frequency and the total duration of the signal. One of the goals of nonuniform sampling is the reduction of the number of samples, but this number is much less predictable from simple parameters and features of the signal.
The example chosen above is a noisy biological signal, which is obviously not the target of peak sampling. The initial signal is regularly sampled with a ts = 5 10−4 s period,
signal number of samples compression
xn 141 95%
yn 1179 58%
zn 14 99.5%
wn 86 97%
TABLE I. NUMBER OF SAMPLES AND COMPRESSION FOR ANECG FRAGMENT.
leading to 2801 samples on the fragment of interest. The num-ber of samples and compression percentages corresponding to Figures 2, 3, 4, and 6, are given in Table I.
In [4], theoretical results are obtained on the number of samples that can be obtained through a level crossing sampling procedure with an assumption on the H¨older regularity of the input signal, leading to an upper bound of the number of sam-ples in the worst case. Such an analysis would be impossible for peak sampling, for which there is no compression at all in the worst case. The level and peak sampling is always better in terms of compression than simple level crossing sampling. The worst case in level crossing sampling is obtained when all levels are crossed successively and it is typically the case when the subsequent peak sampling will cancel samples.
For samplings which add extra parameters to the signal itself —i.e. all but peak sampling— the impact of the variation of the parameters can be studied. For example level crossing leads to peak clipping and a small variation in the position of the levels (offset) can make samples appear or disappear. This is one of the reasons why the problem of the right placement of levels is an important issue.
The impact of noise is another issue. We would want the sampling, and especially the number of samples not to depend too much on noise. The case of additive noise for level crossing sampling has been studied in [18]. As it can also be seen in Figure 2 a noisy system can cross many times levels with no special information carried by all these nonuniform samples. They can of course be decimated a posteriori. Level and peak sampling does not share this drawback since the decimation is part of the sampling process. We can therefore expect the number of samples to be very stable with respect to noise, if of course it is zero mean and its standard deviation remains below the quantum threshold used for the levels.
We explore further the impact of an additive noise in the next section.
IV. IMPACT OF NOISE ON THE NUMBER OF SAMPLES
To test the impact of noise, we perform the following test on the input signal
f (t) = 1 2+
1
2sin(2πt).
This type of signal is not the one targeted by nonuniform sampling, since it is not sporadic and uniform sampling at a Nyquist rate would suit more here. Our aim is to compare the nonuniform methods with respect to noise and to mimic a continuous signal by starting with an oversampled uniform sig-nal. We therefore consider 100 periods of this signal, uniformly sampled at 100 Hz, thus yielding 10000 original samples. We then compare the four sampling methods described in this paper and also add a noise with zero mean and a standard
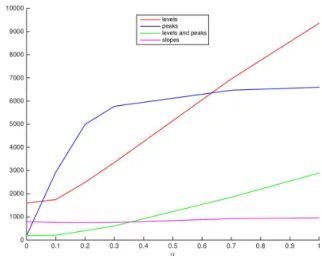
Fig. 7. Number of samples in terms of noise standard deviation (in q units: σ = αq).
deviation σ. We take the quantum q used for level crossing (with 8 levels) as a unit for σ and explore values of σ = αq for α ∈ [0, 1]. The first test case consists in comparing the number of samples yield by the various types of nonuniform sampling. The results are given in Figure 7. The fact that we use 100 periods of the signal provides some averaged results which are quite similar from one run to another. Thus Figure 7 is quite generic and not specific to a given run.
We see that the number of samples is very constant with slope sampling. At least for σ > .1q, the number of samples is linear for level crossing and level and peak sampling. Of course the number of samples for level and peak sampling is lower than for level crossing sampling since it is a decimation of the later. Peak sampling seems to saturate for high values of σ. For σ = 0 it yields exactly the same number of samples as level and peak sampling, namely 198 samples. It increases rapidly for peak sampling since noise, whatever its standard deviation, induces peaks. Let us notice that no genuine compression of the signal is obtained for level crossing and peak sampling for large values of σ since the number of samples have to be compared with the original value of 10000.
V. IMPACT OF NOISE ON THE RECONSTRUCTION
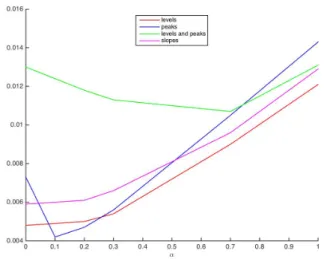
The same test-case as in the previous section is carried out to study the quality of reconstruction. We now plot the mean over one period L1-error between the noisy input signal and the nonuniform signal. To compute this the nonuniform signal is linearly interpolated at the times of the input signal. The results are given in Figure 8, which is once more generic due to the number of studied periods.
For large values of σ all the methods are more or less equivalent in terms of error. Level crossing, peak and slope sampling have a linear behavior away from σ = 0. We expect slope sampling to saturate for even larger values of σ since its criterion is indeed the L1error. A little noise is quite favorable
for peak sampling, since it gives the opportunity to capture a few samples away from the minima and maxima of the sinusoid. Level and peak sampling does not give very good results for small values of σ.
Fig. 8. L1error in terms of noise standard deviation (in q units: σ = αq).
If we now take into account both criteria, quality of reconstruction and number of samples, we see that slope sampling outperforms the others (of course it also depends of the number of levels for level crossing and the tolerance for slope sampling). Indeed we obtain very comparable errors but with much fewer samples for slope sampling.
VI. APPLICATIONS
The above criteria are natural from a mathematical point of view but not always for applications. The number of samples is very important for applications since it triggers the energy that will be necessary to use the samples for subsequent processing. The quality of the reconstruction may not be so important because accuracy is not always the goal of the applications.
In [16], [17], the nonuniform samples are used for pattern recognition. Then accuracy in the samples is not necessary if the pattern is correctly analyzed. These works show that the main issue is the good placement of the levels for the specific application.
In [19] nonuniform samples are only used to detect the ac-tivity of the system. The input signal is sampled nonuniformly. It allows to collect data on time delays. From this information, a classical sampler yielding uniform samples is switched on during the time-windows when time delays in the nonuniform samples are small. These uniform samples are then processed classically. Clearly this application does not need to be very precise in terms of signal reconstruction from the non-uniform signal.
Slope sampling has been introduced to test for the main frequency of a signal. After the capture of the samples an evaluation of this frequency was computed. It is a very costly procedure for nonuniform samples since there is no FFT-like algorithm at hand. The very low number of samples given by slope sampling even in the presence of noise was necessary to make this tractable.
This last type of application is not designed for embedded systems but for off-line computations. In the case of embedded systems that really need a low number of samples for power
saving reasons, another criterion is the capability of imple-menting the sampling in the systems.
VII. CONCLUSION
We have explored four different ways to nonuniformly sample signals. We have compared them from the point of view of the number of samples and the robustness of this criterion when noise is added, as well as the reconstruction error. We demonstrated the potentiality for reducing the amount of data with level-crossing sampling but also using slopes, peaks and a combination of peak and level-crossing techniques. We also indicated their limitations to be practically employed.
Another point of view can be taken when considering the integration of these sampling schemes in an electronic system. Some of these sampling techniques have already been implemented in hardware [5], [17], [20] and dedicated analog-to-digital converters have also been designed, fabricated and tested by Allier [11], Shell [21] and Akopyan [10]. Level-crossing sampling can benefit from the architecture of the existing classical analog-to-digital converters. Even if all the others sampling schemes have not been completely demon-strated in hardware, the implementation of peak detection or slope-crossing is not a real issue and we can have no doubt, that if these sampling techniques are adequate, a circuit will be designed accordingly.
Today’s challenge is clearly to develop a framework able to help designers and practitioners to choose the appropriate sampling scheme for their applications. Indeed, it exists plenty of ways of sampling and that can enhance the integrated system quality by reducing their activity and power consumption but also the amount of data to store and to exchange through the internet. Sampling differently offers several supplementary degrees of freedom to the designers and is probably the key for smart autonomous systems requiring extremely low-power as Le Pelleter [17] demonstrated in his proof of concept applied to a sub-block of a medical implant. Moreover, if we go further, sampling techniques can also be devised for other purposes such as mitigating the circuit electromagnetic emission or security issues.
ACKNOWLEDGMENT
This work has been partially supported by the LabEx PERSYVAL-Lab (ANR-11-LABX-0025-01).
REFERENCES
[1] F. Marvasti, Nonuniform Sampling. Theory and Practice, ser. Infor-mation Technology: Transmission, Processing and Storage. Kluwer Academic Publishers, 2001.
[2] D. Poulton and J. Oksman, “Digital filters for non uniformly sampled signals,” in Nordic Signal Processing Symposium (NORSIG 2000), Vildmarkshotellet Kolmarden, Sweden, Jun. 2000, pp. 421–424. [3] L. Fontaine and J. Ragot, “Filtrage de signaux `a ´echantillonnage
irr´egulier,” Traitement du Signal, vol. 18, no. 2, pp. 89–101, 2001. [Online]. Available: http://hdl.handle.net/2042/2173
[4] B. Bid´egaray-Fesquet and M. Clausel, “Data driven sampling of os-cillating signals,” Sampling Theory in Signal and Image Processing, vol. 13, no. 2, pp. 175–187, 2014.
[5] M. Greitans, R. Shavelis, L. Fesquet, and T. Beyrouthy, “Combined peak and level-crossing sampling scheme,” in 9th International Conference on Sampling Theory and Applications (SAMPTA 2011), Singapore, May 2011, pp. 1–4.
[6] P. Mart´ınez-Nuevo, S. Patil, and Y. Tsividis, “Derivative level-crossing sampling,” IEEE Transactions on Circuits and Systems II, vol. 62, no. 1, pp. 11–15, January 2015.
[7] J. W. Mark and T. D. Todd, “A nonuniform sampling approach to data compression,” IEEE Transactions on Communications, vol. 29, no. 1, pp. 24–32, January 1981.
[8] N. Sayiner, “A level-crossing sampling scheme for A/D conversion,” Ph.D. dissertation, University of Pennsylvania, 1994.
[9] N. Sayiner, H. V. Sorensen, and T. R. Viswanathan, “A level-crossing sampling scheme for A/D conversion,” IEEE Transactions on Circuits and Systems II, vol. 43, no. 4, pp. 335–339, April 1996.
[10] F. Akopyan, R. Manohar, and A. B. Apsel, “A level-crossing flash asynchronous analog-to-digital converter,” in 12th IEEE International Symposium on Asynchronous Circuits and Systems (ASYNC’06), Greno-ble, France, March 2006, pp. 11–22.
[11] E. Allier, G. Sicard, L. Fesquet, and M. Renaudin, “A new class of asynchronous A/D converters based on time quantization,” in 9th Inter-national Symposium on Asynchronous Circuits and Systems, Async’03. Vancouver, Canada: IEEE, May 2003, pp. 196–205.
[12] ——, “Asynchronous level crossing analog to digital converters,” Mea-surement, vol. 37, no. 4, pp. 296–309, Jun. 2005, special Issue on ADC Modelling and Testing, edited by P. Carbone and P. Daponte. [13] F. Aeschlimann, E. Allier, L. Fesquet, and M. Renaudin, “Asynchronous
FIR filters: Towards a new digital processing chain,” in 10th Interna-tional Symposium on Asynchronous Circuits and Systems (Async’04). Hersonisos, Crete: IEEE, April 2004, pp. 198–206.
[14] S. M. Qaisar, L. Fesquet, and M. Renaudin, “Adaptive rate filtering for a signal driven sampling scheme,” in International Conference on Acoustics, Speech, and Signal Processing, ICASSP 2007, vol. 3, Honolulu, Hawai‘i, USA, April 2007, pp. 1465–1568.
[15] A. Grybos, “Event-driven sampling of signal with quadratic prediction,” in Sampling, Theory and Applications, SAMPTA’15, Washington DC, USA, 2015.
[16] T. Le Pelleter, T. Beyrouthy, R. Rolland-Girod, A. Bonvilain, and L. Fesquet, “Non-uniform sampling pattern recognition based on atomic decomposition,” in 10th International Conference on Sampling Theory and Applications (SampTA 2013), Bremen, Germany, July 2013. [17] G. Roa, T. Le Pelleter, A. Bonvilain, A. Chagoya, and L. Fesquet,
“Designing ultra-low power systems with non-uniform sampling and event-driven logic,” in 27th Symposium on Integrated Circuits and Systems Design (SBCCI 2014), Aracaju, Sergipe, Brazil, September 2014.
[18] B. Bid´egaray-Fesquet, “Noise and offset in the iir filtering of event-based sampled data,” in 1rst IEEE International Conference on Event-Based Control, Communication, and Signal Processing (EBCCSP2015). Krakow, Poland: IEEE, Jun. 2015, p. 4.
[19] S. M. Qaisar, L. Fesquet, and M. Renaudin, “A signal driven adaptive resolution short-time Fourier transform,” International Journal of Signal Processing, vol. 5, no. 3, pp. 180–188, 2009.
[20] T. Beyrouthy and L. Fesquet, “An event-driven fir filter: design and implementation,” in 22nd IEEE International Symposium on Rapid System Prototyping (RSP 2011), May 2011.
[21] B. Shell and Y. Tsividis, “A continuous-time adc/dsp/dac system with no clock and with activity-dependent power dissipation,” IEEE Journal on Soli-State Circuits, vol. 43, no. 11, pp. 2472–2481, nov 2008.