Crowdsourcing Affective Responses for Predicting Media
Effectiveness
by
Daniel Jonathan McDuff
M.Eng., University of Cambridge (2009)
B.A., University of Cambridge (2008)
Submitted to the Program in Media Arts and Sciences,
School of Architecture and Planning,
in partial fulfillment of the requirements for the degree of
Doctor of Philosophy in Media Arts and Sciences
at the
MASSACHUSETTS INSTITUTE OF TECHNOLOGY
June 2014
c Massachusetts Institute of Technology 2014. All rights reserved.
Author
Program in Media Arts and Sciences
May 2, 2014
Certified by
Rosalind W. Picard
Professor of Media Arts and Sciences
Thesis Supervisor
Accepted by
Prof. Pattie Maes
Associate Academic Head
Crowdsourcing Affective Responses for Predicting Media Effectiveness
by
Daniel Jonathan McDuff
Submitted to the Program in Media Arts and Sciences, School of Architecture and Planning,
on May 2, 2014, in partial fulfillment of the requirements for the degree of
Doctor of Philosophy in Media Arts and Sciences
Abstract
Emotion is key to the effectiveness of media, whether it be in influencing memory, likability or persuasion. Stories and narratives, even if fictional, have the ability to induce a genuine emotional response. However, the understanding of the role of emotions in media and advertising effectiveness has been limited due to the difficulty in measuring emotions in real-life contexts. Video advertising is a ubiquitous form of a short story, usually 30-60 seconds in length, designed to influence, persuade, entertain and engage, in which media with emotional content is frequently used. The lack of understanding of the effects of emotion in advertising results in large amounts of wasted time, money and other resources; in this thesis I present several studies measuring responses to advertising.
Facial expressions, heart rate, respiration rate and heart rate variability can inform us about the emotional valence, arousal and engagement of a person. In this thesis I demon-strate how automatically-detected naturalistic and spontaneous facial responses and physi-ological responses can be used to predict the effectiveness of stories.
I present a framework for automatically measuring facial and physiological responses in addition to self-report and behavioral measures to content (e.g. video advertisements) over the Internet in order to understand the role of emotions in story effectiveness. Specifically, I will present analysis of the first large scale data of facial, physiological, behavioral and self-report responses to video content collected “in-the-wild” using the cloud. I have developed models for evaluating the effectiveness of media content (e.g. likability, persuasion and short-term sales impact) based on the automatically extracted features. This work shows success in predicting measures of story effectiveness that are useful in creation of content whether that be in copy-testing or content development.
Thesis Supervisor: Rosalind W. Picard Title: Professor of Media Arts and Sciences,
Crowdsourcing Affective Responses for Predicting Media Effectiveness
by
Daniel Jonathan McDuff
The following people served as readers for this thesis:
Thesis Reader
Rosalind W. Picard
Professor of Media Arts and Sciences
MIT Media Lab, Cambridge
Thesis Reader
Jeffrey Cohn
Professor of Psychology
University of Pittsburgh, Pittsburgh
Thesis Reader
Ashish Kapoor
Research Scientist
Microsoft Research, Redmond
Thesis Reader
Thales Teixeira
Assistant Professor of Business Administration
Harvard Business School, Cambridge
Acknowledgements
I would like to express my sincere thanks to all the people that have helped me complete this degree. This work would not have been possible without many friends and colleagues. The following acknowledgements are by no means exhaustive, for which I apologize.
I would like to thank Roz Picard for being the best advisor I could have wished for. It has been a wonderful opportunity to be at the Media Lab for five years and to have unwavering support and encouragement in my academic life. I would like to thank my thesis committee: Ashish Kapoor, Thales Teixeira and Jeffrey Cohn, for all their time spent developing the research, traveling to meetings and reviewing thesis drafts. Their advice and contributions to this thesis have been, and will continue to be, invaluable.
I am grateful to Rana El Kaliouby who has been a great collaborator and helped to make this thesis work possible through collaboration with Affectiva. Rana’s dedication to a strong scientific grounding for the work has been really encouraging.
Ming-Zher Poh inspired me to apply to the Media Lab. I would like to thank him for being a great roommate, labmate, collaborator and most of all friend. I am grateful for all the dinners, movies and basketball games shared with Ming and Yukkee who are two of my favorite people; I wouldn’t be at this point if I hadn’t met them. The support from friends in the Graduate Christian Fellowship (GCF) - Eric, Victoria, Steph, Michelle, Po-Ru, Kunle, Sam, Adam, Keith, Emily, Marcus, Courtney and many more whom I don’t have space to mention here - has been invaluable. The friendships I have found at the Greater Boston Vineyard, in particular through the youth group, have helpful me to get to know my community and grow in ways I wasn’t expecting during graduate school, in particular I’d like to thank Evadne, Matt, Andrew and Nate.
Rob Morris and Javier Hernandez Rivera have been the most fantastic office-mates (even through those crazy days near deadlines). The projects we worked on together were some of the most fun and innovative. I’d like to thank the rest of the Affective Computing group: Akane Sano, Elliot Hedman, Micah Eckhardt, Yadid Ayzenberg, Ehsan Hoque, Yuta Kuboyama. Jackie Lee, Hyungil Ahn, Kristina Bonakowski, for helping me solve
problems and challenges along the way. The creativity of all my colleagues at the Media Lab has been a constant inspiration throughout my time. Thanks to Dustin Smith, Roarke Hortsmeyer, David Sengeh and Aithne Sheng-Pao to name just a few.
Ashish Kapoor and Mary Czerwinski gave me the wonderful opportunity to intern at Microsoft Research and have a memorable summer in Seattle. This was one of the most fruitful experiences of my PhD. I’d also like to thank my friends at Affectiva: Dan Ben-der, Evan Kodra, Thibaud Senechal, Jay Turcot, Seth Plough, Rich Sadowsky and Oliver Wilder-Smith. It is really exciting to see much of this technology having an impact.
I have had the pleasure of supervising some fantastic UROPs. Thanks to Abigail Klein, Miriam Greshenson, Fangheng Zhou, Jennifer Shi and Sarah Gontarek for all their hard work and willingness to explore interesting ideas. I would also like to thank all the people who took part in experiments whether in person or over the Internet. The findings in this research are only possible due to the thousands of individuals who took part - often with no compensation - in our studies.
I am indebted to Sina, Yusef, Lottie, Maria, Jimmy, Kate G., Kate B. and Ian for keeping me in touch with England and being so willing to see me at short notice. I hope that I can stay in touch and that these friendships continue to grow stronger.
Heather Beem has been the best friend I could have hoped to have met. I’d like to thank her for sharing life with me, helping me to appreciate things beyond MIT and for supporting me when life was tough - I hope the adventure continues.
I am deeply grateful to Joel, Abbie, Jake and Evie for letting me be a part of their lives - even when I was far away - in particular for the Skype calls that reminded me about what is most important in life. I’d like to thank Nannie, Rob, Shona, Aaron, Jerry, Keith, Julie, Jo, Thomas, Tim, Jo and Toby for the time we have enjoyed together and I hope that I can see more of you all now! My utmost thanks goes to my parents - they let me follow my desire to apply to MIT and supported me in all my decisions - I could never have done it without them. My final recognition and praise are to God, for from Him and through Him and for Him are all things.
In memory of Luke McDuff. You inspired me to study, read and try to be the best I could be. I will miss you always.
In this thesis I present analysis of large-scale emotion measurement via facial responses recorded over the Internet. Only images from videos with consent to be shared publicly are shown in this thesis and related publications.
Contents
Abstract 3 1 Introduction 34 1.1 Motivation . . . 35 1.2 Status Quo . . . 37 1.3 Proposed Model . . . 38 1.4 Thesis Aims . . . 39 1.5 Thesis Outline . . . 402 Storytelling and Emotion 43 2.1 Advertising . . . 44
2.2 Political Ads and Debates . . . 46
2.3 Movie Clips . . . 47
3 Emotion Models and Measurement 48 3.1 Models of Emotion . . . 48
3.2 Facial Expressions and Emotion . . . 50
3.2.1 Facial Action Coding (FACS) . . . 51
3.3 Physiology and Emotion (Psychophysiology) . . . 53
3.4 Measurement of Emotions . . . 54
3.4.1 Self-Report . . . 55
3.4.3 Autonomic Measures . . . 61
3.4.4 Brain Imaging . . . 62
4 Affective Computing 66 4.1 Automated Analysis of Facial Behavior . . . 66
4.1.1 History . . . 66
4.1.2 State of the Art . . . 67
4.1.3 Dataset for Training . . . 70
4.2 Examples of Machine Learning Approaches . . . 72
4.3 Affective Crowdsourcing . . . 73
5 Overview of the Six Experiments 75 5.1 Experiments . . . 75
5.2 Research Questions . . . 77
6 Data Collection and Processing 79 6.1 Data Collection Over the Internet . . . 79
6.1.1 Methodology . . . 81
6.1.2 Characterizing Data . . . 81
6.2 Automated Facial Expression Analysis . . . 83
6.2.1 Data Labeling . . . 83
6.2.2 The Automated System . . . 84
6.2.3 Facial Action Units . . . 86
6.2.4 Continuous Measures of Emotion . . . 88
6.2.5 Accuracy of the Classifiers . . . 89
6.2.6 Comparison with Dial Measures . . . 89
6.3 Remote Measurement of Physiology . . . 91
6.3.1 Using a Webcam . . . 92
7 Preliminary Analysis of Facial Responses over the Internet 100
7.1 Multiple Viewings and the Impact on Facial Responses . . . 100
7.2 Intra-Person Variability in Facial Response . . . 102
7.3 Inter-Person Variability in Facial Response . . . 103
8 Super Bowl: Predicting Viewer Preferences 107 8.1 Aims and Motivation . . . 107
8.2 Data . . . 108
8.3 Aggregate Responses . . . 110
8.4 Predicting Preferences . . . 111
8.4.1 Pre-Processing Facial Responses Data . . . 113
8.4.2 Classification of Responses . . . 115
8.4.3 Impact of Smile Detector Performance on Preference Prediction . . 116
8.5 Results/Conclusions . . . 119
9 Mars: Predicting Ad Likability and Purchase Intent 122 9.1 Aims and Motivation . . . 122
9.2 Data and Data Collection . . . 123
9.2.1 Video ads . . . 123 9.2.2 Respondents . . . 125 9.2.3 Methodology . . . 127 9.2.4 Facial Coding . . . 129 9.2.5 Expressiveness of Viewers . . . 129 9.2.6 Aggregate Characteristics . . . 133 9.3 Classification . . . 133
9.3.1 Calculating Aggregate Metrics . . . 134
9.3.2 Extracting Summary Features . . . 134
9.3.3 Computing Labels . . . 135
9.4 Results and Discussion . . . 137
9.4.1 Ad Liking Prediction . . . 137
9.4.2 Purchase Intent Prediction . . . 139
9.5 Discussion and Conclusions . . . 142
10 Mars: Predicting Sales 145 10.1 Aims and Motivation . . . 145
10.2 Data and Data Collection . . . 147
10.2.1 Video ads . . . 147
10.2.2 Respondents . . . 147
10.2.3 Methodology . . . 148
10.2.4 Sales Data . . . 148
10.3 Features . . . 149
10.3.1 Calculating Aggregate Metrics . . . 149
10.3.2 Extracting Summary Features . . . 149
10.3.3 Computing Labels . . . 150
10.3.4 Model . . . 150
10.4 Results . . . 150
10.4.1 Comparison of Sales Labels with Human Coding . . . 150
10.4.2 Facial Metrics and Self-report Prediction . . . 151
10.5 Case Studies . . . 152
10.5.1 Case I: Facial responses correctly predict sales (not self-report) . . 153
10.5.2 Case II: Self-report correctly predicts sales (not facial response) . . 153
10.6 Discussion and Conclusions . . . 154
11 Electoral Debate: Predicting Candidate Preferences 156 11.1 Aims and Motivation . . . 156
11.2 Data . . . 158
11.4 Insights from Facial Responses . . . 161
11.5 Predicting Voter Preference . . . 163
11.5.1 Features . . . 163
11.5.2 Model . . . 164
11.5.3 Voter Preferences . . . 164
11.5.4 Independent Voter Preferences . . . 164
11.6 Results/Conclusions . . . 166
12 Complementary Aspects of Facial Expressions and Physiology 168 12.1 Aims and Motivation . . . 168
12.2 Data . . . 169
12.2.1 Experiment One . . . 169
12.2.2 Experiment Two . . . 170
12.3 Results . . . 172
12.3.1 Remote Measurements of the BVP vs. Contact Measurements . . . 172
12.3.2 Arousal and BVP Amplitude . . . 174
12.3.3 Facial Expressions and Physiological Responses . . . 175
12.4 Discussion . . . 175
13 Discussion 177 13.1 Meta-Analysis of Results . . . 177
13.1.1 Preference Prediction . . . 177
13.1.2 Purchase Intent Prediction . . . 178
13.1.3 Sales Prediction . . . 178 13.1.4 Physiological Responses . . . 179 13.2 Research Questions . . . 179 13.3 Demo . . . 182 13.3.1 The system . . . 182 13.3.2 The Interface . . . 182
13.3.3 The Interactions . . . 183
13.3.4 Potential Applications . . . 183
13.4 Social Impact and Participation . . . 185
14 Conclusions 188 14.1 Thesis Contributions . . . 188
14.2 Other Relevant Contributions . . . 190
14.2.1 Exploiting Structure for Facial Action Recognition . . . 190
14.2.2 Acume . . . 190
14.2.3 AM-FED Dataset . . . 191
14.2.4 AffectAura . . . 191
14.2.5 CardioCam and the Affect Mirror . . . 192
14.3 Future Work . . . 195
14.3.1 Realtime Prediction of Ad Effectiveness . . . 195
14.3.2 Affective Responses with Large Data . . . 195
14.3.3 Affective Preference Systems . . . 196
A Classifier Training Data 197 A.1 FACS Coding . . . 197
A.2 Reliability of Labels . . . 198
B Survey Details 200 B.1 Mars . . . 200
C FACS Codes 205
Bibliography 208
List of Figures
1-1 Thesis Model: Automatically measured facial and physiological responses capture dimensions of viewers’ affective responses. These measurements can predict media effectiveness including individual and corporate prefer-ences, purchase intent and sales. . . 39 2-1 In this thesis I will be analyzing affective responses to video
advertise-ments, political debates and Hollywood movies. . . 44 3-1 Action Unit Spectrograms (AUSpec) from the 66 participants watching
clips from ‘The Lion King’ (left) - Sadness and ‘When Harry Met Sally’ - Amusement (right). The color intensity of each block reflects the per-centage of viewers within the population who exhibited the corresponding action unit at that time. Deeper color corresponds to more viewers. The action unit numbers refer to FACS codes (see FACS code glossary in Ap-pendix C). Greater instances of AU4 are present during the sadness clip and greater instances of AU12 are present during the amusement clip. Data from McDuff et al. (2010). . . 51 3-2 The Self-Assessment Manikin (SAM). Top) valence report, middle) arousal
report, bottom) dominance report. . . 58 3-3 Feeltrace is a continuous emotion reporting tool that uses a circumplex. . . 58
4-1 The three main components present in most facial expression or AU recog-nition systems: 1) a method for registering the face, 2) calculation of shape and/or appearance feature descriptors and 3) classification of AUs or ex-pressions using the feature descriptors. . . 68 6-1 Overview of the user experience and web-based framework that is used to
crowdsource the facial videos. The video from the webcam is streamed in real-time to a server where automated facial expression analysis is per-formed. All the video processing can be performed on the server side. . . . 81 6-2 Example frames from the crowdsourced videos. The videos vary in
illumi-nation, image quality, pose, position and movement of the viewer, number of viewers, occlusions and background activity. . . 82 6-3 A) Histogram of head scales for the CK+ (top), MMI (center) and our
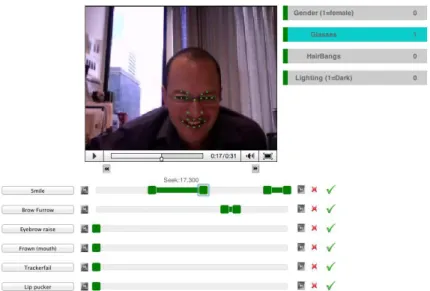
we-bcam (bottom) datasets. The head scale was calculated for every frame in which a head was tracked. Examples of head scales of 0.5, 1 and 1.5 are shown below. B) Histograms of the average luminance for the facial region for CK+, MMI and our webcam datasets. Examples are shown for lumi-nance values of 50, 125 and 216. C) Histograms of the Michelson contrast for the facial region for CK+, MMI and our webcam datasets. Examples are shown for contrast values of 0.60, 0.82 and 1.0. D) Histograms show-ing the pose angles (relative to a fully frontal face) of the heads in the CK+ (top), MMI (center) and our webcam (bottom) datasets. Examples of poses with pitch=-0.13 rads, yaw=-0.26 rads and roll=-0.19 rads are shown. . . . 83 6-4 Screenshot of the video labeling tool ViDL used to label the video data. The
onset and offset of each action unit was labeled by at least three labelers with the majority label being taken as ground truth. . . 84
6-5 Cropped examples of frames from ViDL with positive labels for action units that were coded in the groundtruth labeling stage. Smile and negative AU12 are labeled separately instead of labeling symmetrical AU12. The AU definitions can be found in Appendix C. . . 84 6-6 Locations of the 22 landmark points automatically labeled using the
Neven-vision tracker. . . 85 6-7 Descriptions and examples of the action units (AU2, AU4, AU9/AU10) and
dimensions continuous emotion (valence) which are captured by the facial coding technology. . . 88 6-8 Comparison between action unit classifier predictions (green) and
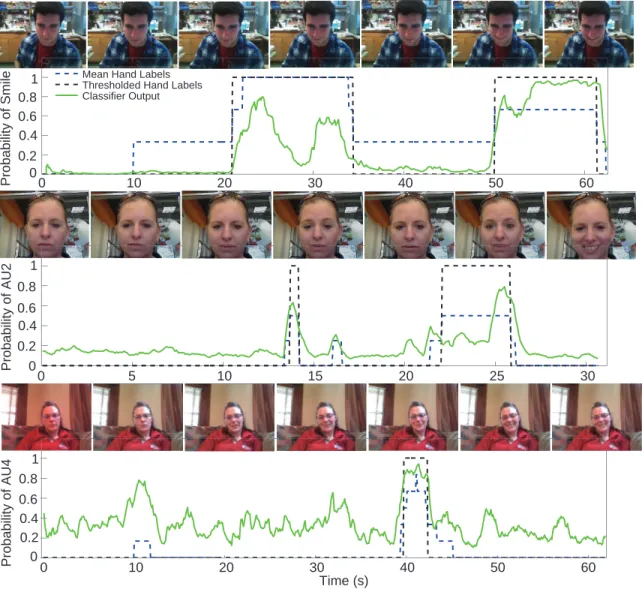
manu-ally coded action unit labels (blue and black dashed). Threshold of hand labels based on > 0.5 agreement between coders. Frames from the se-quences are shown above. Top) Smile classification example, middle) AU2 classification example, bottom) AU4 classification example. . . 90 6-9 Time series plot of aggregate self-report dial responses (self-reported
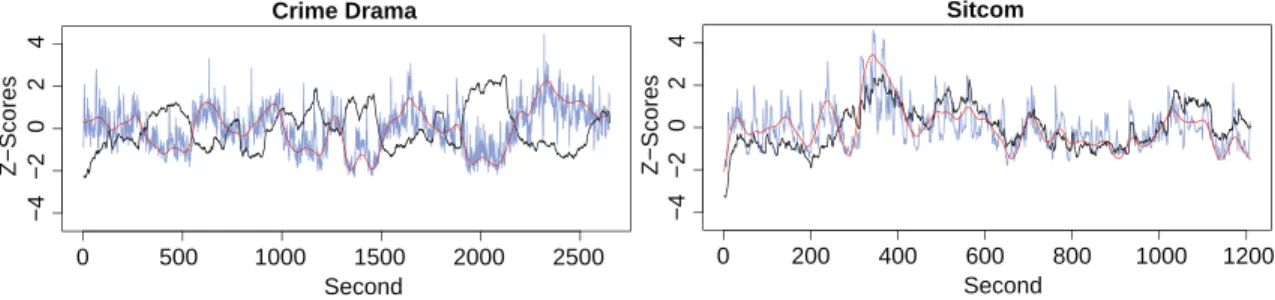
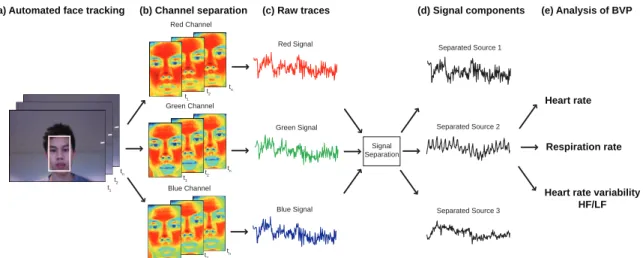
inter-est) (in Black) versus the smoothed facial metrics (in Red: smile metrics for Crime Drama and AU02 metrics for Sitcom). The non-smoothed facial data is shown in faded blue. Correlation between the smoothed metrics and dial data: -0.748 and 0.656 respectively. Self-reported interest is negatively correlated with smile metrics for the crime drama and positively correlated with AU02 metrics for the sitcom. . . 91 6-10 Algorithm for photoplethysmographic measurement from a webcam video
and the extraction of heart rate, respiration rate and HRV from the resulting BVP signal. . . 93
6-11 Left) Five band camera light sensitivity profile. In addition to red, green and blue light sensors this camera can measure orange and cyan bands. Right) Five band camera sensor layout. The image shows the arrangement of the colors in a 4x4 pattern that repeats across the sensor. Each pixel on the sensor measures one color as determined by its position. . . 94 6-12 Comparison of remotely measured physiological parameters for 10
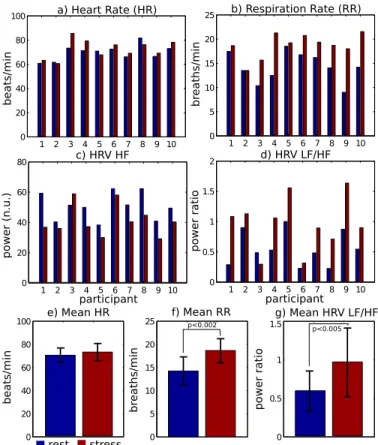
partici-pants during rest and cognitive load conditions. a) Heart rate, b) respiration rate, c) HRV HF, d) HRV LF/HF ratio. Mean parameters are shown for: e) heart rate, f) respiration rate and g) HRV LF/HF. Error bars show one stan-dard deviation either side of the mean. Respiration rate and LF/HF ratio are the most discriminative features between the two states, heart rate was the least discriminative. . . 97 6-13 Heart rate variability spectrograms (normalized amplitude) calculated
us-ing: Top) RGB camera signals, middle) GCO camera signals and bottom) contact finger sensor. Qualitatively the measurements from the GCO chan-nels more closely match those from the contact sensor (reinforcing the quantitative comparisons in Table 6.2). Shown are sessions in which par-ticipants 5 and 10 were at rest and sessions in which parpar-ticipants 5 and 10 were under cognitive load. There are stronger low frequency compo-nents in the latter as we would expect less parasympathetic nervous system activity. The measurements for participant 5, under cognitive load, made using the camera suggest that the camera (using GCO bands) may have been more accurate than the finger sensors. . . 99 7-1 Aggregate (no. of viewers = 23) smile classifier output for a commercial
on first (blue) and second (green) viewing. Correlation = 0.802, p<0.05. Shaded area shows the standard error. . . 101
7-2 Aggregate (no. of viewers = 23) smile classifier output for a commercial on first (blue) and second (green) viewing. Correlation = 0.430, p<0.05. Shaded area shows the standard error. . . 102 7-3 Individual smile (blue) and disgust (red) responses to four video ads
(a-d) and the baby clip (e) for four individuals (i-iv) - chosen to illustrate the variety of responses. Example frames from the first ad for two of the subjects are shown. . . 104 7-4 Aggregate smile and disgust metrics with different population sizes, shaded
area = 95% confidence bounds. Top) mean smile probability for Ad A, middle) mean disgust probability for Ad B, bottom) mean smile probability for baby video. . . 106 8-1 Map showing the location of the 3268 viewers, based on their IP address.
No viewers IP was located outside of the latitudes shown. . . 108 8-2 Screenshots of the web interface in the Super Bowl study. a) Homepage, b)
Webcam permissions, c) Self-report questions, d) Graphical representation of smile intensity. . . 109 8-3 The self-report questions with which the viewers were presented after
watch-ing the ads in the Super Bowl study. . . 109 8-4 Framework for classification of content liking and desire to view again
based on automatically detected smile responses recorded over the web. Smile metrics are extracted from the recorded facial response. The smile metrics are filtered and temporal features extracted from 20 evenly spaced bins. Resulting features used for classification. . . 112 8-5 Funnel chart showing the participation at the early stage of the Super Bowl
experiment. I) 16,366 visitors clicked on a video, II) 7,562 opted-in to all webcam access, III) 5,268 completed watching the video and IV) 3,268 had identifiable faces in greater than 90% frames. . . 113
8-6 Performance characteristics for the two smile detectors. Left) Precision-recall curves for detector V1(blue) and detector V2 (green) tested on im-ages from the AMFED dataset (no. of imim-ages = 52,294). Right) ROC curves for detector V1 (blue) and detector V2 (green) tested on the same images from the AMFED dataset. . . 114 8-7 Linear Discriminant Analysis (LDA) mapping of the individual smile tracks
(calculated using smile detector V1) with labels of reported liking. Smile tracks for those that report disliking (red) and liking (green). Examples of four of the smile tracks are shown. . . 115 8-8 There are significant differences in the smile responses between people
that reported liking the ads more than others. The mean smile intensity and standard error whilst watching the ads for the three self- report classes (top). Histograms of the maximum (blue) and minimum (red) smile inten-sity peak locations whilst watching the Doritos ad for the three self-report classes. . . 116 8-9 Examples of true positives (top), false positive (center) and false negatives
(bottom) using features from smile detector V1. Most of the false negative examples show responses with very low smile intensity despite the viewer reporting liking the commercial. Shown below are frames from examples of TP, FP and FN videos. . . 120 8-10 Examples of true positives (top), false positive (center) and false negatives
(bottom) using features from smile detector V2. Most of the false negative examples show responses with very low smile intensity despite the viewer reporting liking the commercial. Shown below are frames from examples of FP and FN videos. . . 120
8-11 Examples of video misclassified using features from smile detector V1 but correctly classified using smile detector V2. a and b) false positive exam-ples - noisy smile tracks using V1 due to challenging lighting, c and d) false negative examples - missed smiles due to subtle expressions. . . 121 9-1 Screenshots of a subset of the 170 ads tested in this study. The ads were
for products in one of the four categories: pet care, confectionery (choco-late, gum and candy), food (instant rice and pasta products) and cosmet-ics/toiletries. The ads were from different countries: France, Germany, the UK and the US. . . 123 9-2 The a) age (in years), b) gender and c) economic split (annual salary in
$1000s) of the 1,223 viewers who took part in the Mars study. . . 126 9-3 Experimental procedure for the Mars experiment. The experiment was
di-vided into two parts. 1) A pre-survey with baseline questions and 2-4) a main survey with ads and follow-up questions. During the main survey each viewer watched 10 ads and answered questions about liking and de-sire to share following each and then answered questions about purchase intent and brand likability at the end of the survey. . . 130 9-4 Example of the brand recall task. Participants were asked to enter the name
of the brand represented from a forced choice list. . . 130 9-5 Example images from the brand recognition task. Brand names and logos
were pixelated. Participants were asked to enter the name of the brand represented from a forced choice list. . . 130 9-6 Histograms of the number of frames with each expression probability. From
top to bottom: eyebrow raise, smile, disgust, valence. In 82.8% of frames was there no detectable eyebrow raise, smile, disgust or positive/negative valence expression with magnitude above 0.1. Responses to ads in natural-istic settings are sparse but for all the ads there were expressive responses within the 70+ viewers. . . 132
9-7 Mean valence metrics for the 170 ads sorted by ascending mean valence. . . 133 9-8 1) Aggregate metric tracks calculated from all viewers who watched the
ad. 2) Features extracted from each of the aggregate metric tracks: a) mean value, b) minimum value, c) maximum value, d) the gradient of the linear trend. 3) Summary features extracted from the facial expression metrics used to predict ad effectiveness. . . 134 9-9 Distribution of average: left) ad liking response and right) delta in purchase
intent response for all ads. The median, minimum and maximum values are all shown. The report of liking was significantly (p<0.001) greater than neutral. . . 135 9-10 Scatter plot of ads with aggregate smile trend against aggregate disgust
trend. Ads with higher mean ad liking score are shown in blue, ads with lower mean ad liking score are shown in red. The smile gradient is more discriminative than the disgust gradient. . . 136 9-11 Receiver Operating Characteristic (ROC) and Precision-Recall (PR) curves
for the ad liking models varying the SVM decision threshold. Black) the performance using face features, blue) the performance using face and con-text features combined. Unbroken lines) results for all ads, broken lines) results for only the amusing ads. . . 139 9-12 Aggregate ad response metrics that correctly and incorrectly classified by
the ad likability model. True positives, true negatives, false positives and false negatives shown. Aggregate: eyebrow raise - black, smiles - green, disgust - red. High peak levels of positive expressions, high expressiveness and strong increasing trend in positive expressions predict high ad likabil-ity. Low expressiveness predicts low ad likabillikabil-ity. Individual plot outlines indicate the product category the advertised product. . . 140
9-13 Receiver Operating Characteristic (ROC) and Precision-Recall (PR) curves for the purchase intent models varying the SVM decision threshold. Black) the performance using face features, blue) the performance using face and context features combined. Unbroken lines) results for all ads, broken lines) results for only the amusing ads. . . 142 9-14 Aggregate ad response metrics that were correctly and incorrectly classified
by the purchase intent model. True positives (TP), true negatives (TN), false positives (FP) and false negatives (FN) shown. Brand appearances within the ads are indicated by the broken gray lines. Notice how the peak in smile activity is preceded by a brand appearance in the TPs and not in the TNs. Aggregate: eyebrow raise black, smiles green, disgust -red. Individual plot outlines indicate the product category the advertised product. The results seem to generalize across product categories. . . 143 10-1 Flow diagram of the feature extraction for the sales prediction task.
Fa-cial metrics extracted from each video and aggregated. Temporal features extracted from the aggregate metrics. . . 146 10-2 Receiver Operating Characteristic (ROC) and Precision-Recall (PR) curves
for the sales models (for non pet care ads) varying the SVM decision thresh-old. green) the performance using self-report features, red) the perfor-mance using face features, blue) the perforperfor-mance using self-report and face features combined. . . 152 10-3 a) Aggregate self-report and b) aggregate facial responses for the ad in case
study I. The facial responses correctly predicted the sales measure for this ad and the self-report responses did not. Brand appearances within the ad are indicated by the broken gray lines. . . 154
10-4 a) Aggregate self-report and b) aggregate facial responses for the ad in case study II. The self-report responses correctly predicted the sales measure for this ad and the facial responses did not. Brand appearances within the ad are indicated by the broken gray lines. . . 155 11-1 Top) Images from the election debate between President Barack Obama
and Governor Romney. Bottom) Images taken from a subset of facial re-sponses data collected with permission to share publicly. . . 157 11-2 The number of participants who took part in the Electoral Debate study and
watched at least one of the debate clips. . . 159 11-3 Questions asked before the participants watched the debate clips during the
Electoral Debate study. Responses to all questions were required. . . 159 11-4 Mean valence during the debate clips for those that reported a preference
for Obama (blue) and Romney (red) after watching the clip. The shaded area represents the standard error range. Below the plots we show which candidate was speaking and which (or both) was on screen during the clip. The letters and dotted lines correspond to significant parts of the clips -transcripts of these parts of the clips can be found in Table 11.3. . . 160 11-5 Top) Examples of smirks during two parts of the debate clips. Top left)
Smirks that occurred during Clip 1, which were followed by smiles/positive valence. Top right) Smirks that were not followed by smiles/positive va-lence. Bottom) Plots of the aggregate smiles and number of smirks for debate Clip 1, and debate Clip 4. Regions in which a greater number of smirks occurred are highlighted in green. . . 162 11-6 Precision-recall (top) and ROC curves (bottom) for the voter preference
prediction task. Green) Results for all eligible voters. Blue) Results for all eligible voters with no or an independent party affiliation. . . 165
12-1 Arrangement of apparatus for multimodal data collection. EDA, BVP and respiration were measured with contact sensors. EDA was measured from both hands. A video of the viewer was recorded simultaneously. . . 173 12-2 Examples of the physiological data collected during the multimodal
exper-iment. Screenshots of the content and frames of the response are shown above. Notice the sharp pinching of the BVP amplitude as the EDA in-creases at 19 mins and again 40 seconds later. This characteristic was ob-served frequently - see Figure 12-4 for more examples. . . 173 12-3 Bland-Altman plots showing the agreement between 30s epoch heart rate
measurements obtained from participants watching media content using contact BVP and remote camera method (total of 1,607 pairs from 6 partic-ipants). The dotted lines represent the mean and 95% confidence intervals. Different colors represent different participants. . . 174 12-4 BVP, respiration and EDA responses of six viewers watching eight emotion
eliciting clips separated by neutral clips of a beach scene. Clips are the same for all viewers but the viewing order is not. The black lines indicate the transition between clips. Note: the scales for the BVP and EDA plots are not the same. . . 176 13-1 The Affective Billboard. a) Schematic: A webcam and facial expression
toolbox are used to detect the presence of a viewer and analyze their re-sponse to displayed content. A custom prediction engine evaluates view-ers’ preferences based on their facial response and adapts the displayed content. b) Real-time viewer interaction with the Affective Billboard. . . . 183 13-2 Design of the user interface, a) scoreboard showing the performance of
each ad based on the results of the liking prediction algorithm, b) results page showing an individual’s response to an ad and recommended ads, c) flow diagram of the interactions that can occur with the system. . . 184
13-3 Digital advertising displays, such as the ones above, are common and facial analytics could be used intelligently and dynamically to display the content to make them more efficient. . . 185 14-1 A screenshot of Acume, an open-source toolkit for exploring and
visualiz-ing behavioral data on multiple scales. . . 192 14-2 A screenshot of the AffectAura emotional memory visualization tool. . . . 193 14-3 The Affect Mirror. Top left) In vital signs mode measuring and displaying
the user’s heart rate, top right) in life-logging mode with images and EDA measurements, bottom) a diagram of the composition of the affect mirror. . 194 A-1 Bar graph showing the mean in the Spearman-Brown reliability for each of
the labels . . . 199 B-1 Instructions... . . 201
List of Tables
3.1 Summary of the self-report measurement of emotions in media and mar-keting. VB = Verbal Self-report, VA = Visual Analogue Self-report, MM = Moment-to-Moment Self-report. . . 64 3.2 Summary of the autonomic measurement of emotions in media and
mar-keting. SR = Self-report, EDA = Electrodermal Activity, EMG = Facial Electromyography, FC = Facial coding. . . 65 5.1 Summary of datasets collected in the five experiments, including the
num-ber of videos tests, the numnum-ber of responses and labels. SR = Self-report, M=Memory tests, S=Sales. U = unknown. . . 76 6.1 Number of videos and frames used for training the action unit and
ex-pression classifiers and the area under the receiver operating characteristic (ROC) curve for testing. . . 89 6.2 Comparison of the correlations between the contact finger sensor
measure-ments and camera measuremeasure-ments for all combinations of the camera color channel signals. For all correlations p < 0.01. On the right are the chan-nel combinations ordered from lowest mean correlation to highest mean correlation. The GCO channel combination performed best. . . 95 6.3 Classification accuracy for prediction of rest vs. cognitive load using
8.1 Distribution of responses to self-report questions “Did you like the video?” and “Would you like to watch this video again?”. . . 111 8.2 Prediction performance for liking and desire to watch again classifiers
us-ing features from smile detector V1 and smile detector V2. . . 117 8.3 Confusion matrices for the best performing liking classifier: left) using
smile detector V1, right) using smile detector V2. . . 117 9.1 Number of videos tested from each product category and emotion category
(categorized using MTurk labelers). A majority of the ads were intention-ally amusing. . . 124 9.2 Percentage of the 3,714,156 frames with expressions metrics within 10
evenly spaced classifier output bins centered on the values shown. . . 131 9.3 Area under the ROC and PR curves for the ad liking classifier: top) all ads
(N=165), bottom) only amusing ads (N=75). . . 138 9.4 Confusion matrices for the optimal liking classifier: top) all ads (N=165),
bottom) only amusing ads (N=75). Based on threshold of point closest to (0,1) on the ROC curve. . . 138 9.5 Area under the ROC and PR curves for the purchase intent classifier: top)
all ads (N=163), bottom) only amusing ads (N=74). . . 141 9.6 Confusion matrices for the best performing purchase intent classifier: top)
all ads (N=170), bottom) only amusing ads (N=75). Based on threshold of point closest to (0,1) on the ROC curve. . . 141 10.1 Number of videos tested from each product category and emotion category
(categorized using MTurk labelers). . . 147 10.2 Confusion matrix for the human coding of sales performance. . . 151 10.3 Area under the ROC and PR curves for the sales classifier: top) all ads
(N=163), middle) only non pet care product ads (N=111), bottom) only pet care product ads (N=52). . . 152
10.4 Confusion matrices for the best performing sales classifier: top) all ads (N=163), middle) only non pet care product ads (N=111), bottom) only per care product ads (N=52). Based on threshold of point closest to (0,1) on the ROC curve. . . 153 11.1 Demographic profile of the participants in the 611 facial responses videos
collected. . . 158 11.2 Synopses and lengths of the five debate clips that viewers watched during
the Electoral Debate study. The number of trackable face video responses collected is also shown on the right. . . 160 11.3 Excerpts from the debate transcript which correspond to the marked points
on Figure 11-4. The color of the dots refers to the speaker: blue = Obama, red = Romney. . . 160 11.4 Top) Confusion matrix for prediction of voter preference across all the
el-igible voters. Bottom) Confusion matrix for prediction of voter prefer-ence across the eligible voters with no or an independent party affiliation. Threshold determined as the case closest to the ROC (0,1) point. . . 166 12.1 Order, descriptions and durations of the media clips viewed. Ads were
placed in between the emotion eliciting clips that were viewed in the Mul-timodal studies. . . 169 A.1 Definitions of the labels for the dataset and the number of frames and
videos in which each label was present (agreed by majority of labelers). Positive examples of each of the labels are shown in Figure 6-5 . . . 199
Chapter 1
Introduction
“You kids don’t know what you want! That’s why you’re still kids, because you’re stupid! Just tell me what’s wrong with the freakin’ show!”
Roger Meyers Jr. - The Simpsons
Thesis Statement
The Internet can be used to crowdsource responses to media content more quickly and efficiently than traditional methods of research. Rich affective information can be measured from ubiquitous sensors (e.g. webcams). Taking advantage of these qualities via
an online framework and state-of-the-art computer vision methods we can drastically improve our understanding of the effectiveness of media content and storytelling and build
models to predict self-report and behavioral outcomes. In addition, the data collected can reveal fundamental information about the way humans express their feelings.
1.1 Motivation
Emotions influence perception (Zadra & Clore, 2011; Phelps, Ling, & Carrasco, 2006; Scott et al., 1997), memory (Reisberg & Hertel, 2004), decision making (LeDoux, 2002; Damasio, 1994) and many other processes. Stories, even if fictional, have the ability to induce a genuine emotional response and this is something people experience many times a day. As such, emotions are key to the effectiveness of narratives and storytelling whether it be in influencing one’s memory of the content, liking of the characters or how much one is persuaded to change an opinion or behavior. These processes may not be consciously accessible or easy to verbalize.
Despite its power, the understanding of the role of emotions in storytelling and adver-tising effectiveness has been limited due to the difficulty of measuring emotions in real-life contexts. The epigraph above is a quotation from a scene in the TV show “The Simpsons” in which the creator of an amusing cartoon series, Roger Meyers Jr., is trying to use a focus group of children in order to understand how to make his cartoon show (“The Itchy and Scratchy Show”) more appealing after the ratings have dropped. The children have diffi-culty verbally expressing what they would like the show to feature; attempts to measure their attitudes toward the show are clearly lacking. The scene highlights the challenges presented by verbal and dial based self-report measures in such a context.
There are many examples of stories and narratives used around us. Advertisements -from traditional print, radio and TV adverts to Internet banner and online video adverts - are increasingly placing more emphasis on emotional content. Indeed, advertisers have long strived to design ads that elicit emotions in viewers and have struggled to measure the extent with which they have been successful in doing so. A case in point: in one ad for a popular chocolate bar, two construction workers are driving excavators and having fun playing a crazy game of soccer with oil barrels; in another, several Monks in a monastery have a chocolate bar then start ringing the bells while jumping up and down in a crazy way. Both ads are clearly aiming to entertain, but one of the two ads yielded a much greater positive impact on sales.
Online video is growing fast with viewing figures consistently being broken year after year. In the US in November 20131 over 189 million viewers watched videos online and
the average viewer watched 19 hours of video online. In the US billions of dollars are spent on online video ads each year. A total of nearly 27 billion ads were viewed in November 2013 and this reached more than 50% of the US population. This is almost three times the number of viewings compared to the same month in 2012. Video ads accounted for 36.2% of all videos viewed. In addition to viewing videos more and more people are sharing video content with others. In 2013 72% of adult Internet users used video-sharing sites.2. Internet
TV sites like Hulu and Netflix frequently ask viewers about the relevance or their enjoyment of ads in an attempt to target them more effectively and measure performance. However, there remains truth in Ray and Batra’s (1982) statement: “an inadequate understanding of the role of affect in advertising has probably been the cause of more wasted advertising money than any other single reason.” This statement applies beyond advertising to many other forms of media and is due in part to the lack of understanding about how to measure emotion accurately in real-life contexts.
This thesis deals with evaluating the effectiveness of emotional content in storytelling and advertising beyond the laboratory environment and traditional measurement techniques using remotely measured facial and physiological responses and an online data collection framework. I analyze challenging ecologically valid data collected over the Internet in the same contexts in which the media would normally be consumed and build a framework and set of models for automatic prediction of effectiveness based on affective responses. In particular I will look at stories in the form of TV advertisements, movie clips, TV shows and political debates.
1http://www.comscore.com
1.2 Status Quo
Traditionally, consumer testing of video advertising, whether by self-report, facial response or physiology, has been conducted in laboratory settings. Lab-based studies have many benefits such as allowing highly accurate measurement of physiological parameters or mus-cle movements. However, there are also a number of challenges. Subjects can be influenced by the presence of an experimenter and/or their comfort with the situation, factors that are unrelated to the stimulus of interest. These may impact the participant’s emotional expe-rience (Wilhelm & Grossman, 2010) and the influence is difficult to quantify. In addition, running such studies is labor intensive and may not be cost effective. Conducting exper-iments outside a lab-based context, and without the use of expensive, obtrusive and un-comfortable sensors, can avoid such problems. However, this type of data collection does present a number of technical challenges that must be overcome. How can you measure emotions without physical contact with the viewer? How can you collect data reliably and efficiently?
Self-report is the current standard measure of affect, where people are typically inter-viewed, asked to rate their feeling on a Likert scale or turn a dial to quantify their state (affect dial approaches). While convenient and inexpensive, self-report is problematic be-cause it is also subject to biasing from the context, increased cognitive load and other factors of little relevance to the stimulus being tested (Schwarz & Strack, 1999). Other drawbacks of self-report methods include the difficulty for people to access information about their emotional experiences and their willingness to report feelings even if they didn’t have them (Cornelius, 1996). For many the act of introspection is challenging to perform in conjunction with another task and may in itself alter that state (Lieberman et al., 2007). Survey methods are limited in resolution as questions can only be asked at discrete time points. Although affect dial approaches provide a higher resolution report of a subject’s response compared to a post-hoc survey, subjects are often required to view the stimuli twice in order to help the participant introspect on their emotional state. Self-reporting ex-periences can become laborious too. New ways of tapping into the emotional exex-periences
of a viewer/reader without constant interruptions could be very powerful.
Kassam (2010) performed one of the largest analyses of facial responses to media con-tent. However, due to the time and expertise required to hand code Facial Action Coding System (FACS) annotations this was limited to 88 participants watching eight one to two minute videos clips (with coding performed at one second intervals). Kassam showed facial expressions are related to self-reported experiences but the two measurements do not cap-ture exactly the same information. The results presented in this thesis support and extend these findings with real-world data collected outside the lab from a much greater number of clips and many orders of magnitude more participants. This thesis is the first to conduct fa-cial analysis studies with large crowd-sourced online data. I show that fafa-cial, physiological and self-report measures of affective information can be used to predict viewer preferences and other measures of success and that they yield deeper insights than are available from conventional techniques. I will focus on facial expressions as the main remote measure of affect but I also consider physiological measures of emotion beyond the face in the form of heart and respiration rate and heart rate variability - which can all be measured remotely using methods I have developed.
1.3 Proposed Model
In this thesis I propose a model for predicting measures of storytelling impact and effec-tiveness from automatically measured affective responses. Specifically, I focus on data collected remotely over the Internet. The measured features include facial expressions, physiological responses and self-report responses. Figure 1-1 shows the model design. The remote measurements capture different dimensions of the affective response. These are modeled as discrete expressions such as smiles and disgust and continuous dimensions such as valence. I propose that these measures of affect (captured remotely) can predict success of content in a number of contexts. Firstly, that emotional responses to content are closely related to individual’s reported preferences of content they like or would like
Figure 1-1: Thesis Model: Automatically measured facial and physiological responses capture dimensions of viewers’ affective responses. These measurements can predict media effectiveness including individual and corporate preferences, purchase intent and sales. to watch (b). Secondly, that emotional responses to content can predict behavioral and aggregated metrics of success (e.g. short-term sales lift) (d). Finally, I hypothesize that predicted effectiveness of content measured via cognitively evaluated self-report will not be as accurate as predicted effectiveness that takes into account automatic measures of emotional response (c) < (d). Further to this, the combination of self-reported measures and automatically measured emotional responses will be more predictive still (d) < (b) + (c) + (d).
1.4 Thesis Aims
The aims of this thesis, and as outlined in my thesis proposal, are as follows:
• To use a custom cloud-based framework for collecting a large corpus of response videos to online media content (advertisements, debate clips) with self-report re-sponses and measures of success (sales). To make use of this framework to collect data from a diverse population to a broad range of content.
• To collect supplementary data in more controlled settings with gold-standard phys-iological measurements alongside facial coding. In order to improve and validate remote physiological measurement techniques and to demonstrate how these can be useful for media measurement.
• To design, train and evaluate a set of models for predicting key measures of story/advertisement effectiveness based on facial responses automatically extracted from the videos and
self-report ratings collected online.
• To propose generalizable emotional profiles that describe an effective story/advertisement in order to practically inform the development of new content.
• To implement an intelligent real-time system (demo) that incorporates the findings into a fully automated intelligent classification of a responses to advertisements on a digital public display - The Affective Billboard.
1.5 Thesis Outline
The remainder of this thesis will cover the following material:
Chapters 2, 3 and 4 provide a background on the role of emotion in storytelling and an introduction to the related work on emotion and media measurement and affective comput-ing on which this thesis is built. I will motivate the need for the development of technology for measuring emotional responses to media “in-the-wild.”
Chapter 5 presents a summary of the experiments performed during my thesis work and the hypotheses they were designed to test.
Chapter 6 describes the novel cloud-based framework and methodology used for data collection. I will also describe technical details about the automated analysis of facial
ex-pressions and physiology from video. Here I will present the details of existing systems I have employed in addition to systems I have designed during the course of my thesis work. Chapter 7 presents general observations from the analysis of crowdsourced affective re-sponses that will be relevant in the following chapters (7-11). These results include: effects of familiarity, range of expressiveness and baseline differences. The large-scale data pre-sented in this thesis not only allow us to better understand viewer responses to video content but also to examine more fundamental questions about the variability in facial behavior and expressiveness of viewers.
Chapter 8 describes how affective measurements can be used to predict liking and de-sire to watch again preferences in advertising/media. In particular, I show that it is possible to predict individuals’ preferences (liking, desire to watch again) for online media based on smile responses. This was the pilot study that laid the ground work for the experiments described in the following chapters.
Chapter 9 describes how affective measurements to video advertising can be used to pre-dict ad liking and purchase intent. I will analyze aggregate responses from over 12,000 videos and evaluate how automated copy-testing based on affective responses would per-form.
Chapter 10 describes how affective measurements can be used to predict short-term sales effectiveness of ads. I show that for intentionally humorous ads, those which induce in-creasing positive valence and low levels of negative expressions (such as disgust) are likely to be more successful.
Chapter 11 shows how facial expressions can be used in contexts other than advertise-ments and short film clips. I demonstrate that it is possible to predict candidate preferences
in an election debate based on affective responses. In addition, I show that the cloud based framework presents a very efficient and fast way to collect facial responses to media con-tent.
Chapter 12 presents multi-modal experiments that show the relationship between facial responses and physiological responses to ads and other media clips. In addition, I show further validation of remote physiological measurements using a webcam.
Chapter 13 is a generalized discussion of the results from all the experiments and the key findings. I will present a demo system that I have built to integrate the findings of this thesis into a real-time intelligent public display.
Chapter 14 summarizes the conclusions and contributions of this thesis and provides a discussion of future work. This chapter will also mention other contributions I have made that are beyond the main topic area of this thesis.
Chapter 2
Storytelling and Emotion
Emotion is key to the effectiveness of narratives and storytelling (Green, Strange, & Brock, 2002). Stories, even if fictional, have the ability to induce a genuine emotional response (Green, 2004; Kassam, 2010). However, there are nuances in the emotional response to narrative representations compared to everyday social dialogue (Parkinson & Manstead, 1993) and therefore context specific analysis is important. Imagery, music and dialogue can all con-tribute to inducing emotions within a viewer. The temporal nature of a viewer, listener or reader’s emotional response is important (Baumgartner, Sujan, & Padgett, 1997), with peo-ple reporting to prefer sequences of outcomes that improve over time (G. F. Loewenstein & Prelec, 1993) and rapid increases in improvement rather than slower increases (Hsee & Abelson, 1991). However, their memory may not capture all aspects of the temporal affec-tive response. There is evidence that peak moments and final moments are weighted more heavily in post-hoc evaluations (Kahneman, Fredrickson, Schreiber, & Redelmeier, 1993). Context plays a significant role in how emotion influences the effectiveness of a story. In this thesis I will focus mainly on emotional responses to TV advertisements - short stories which typically aim to persuade, inform and/or appeal to viewers. However, I will also present analysis of responses to election debates and movie clips.
Figure 2-1: In this thesis I will be analyzing affective responses to video advertisements, political debates and Hollywood movies.
2.1 Advertising
Marketing, and more specifically advertising, makes much use of narratives and stories. In advertising, the states of surprise and amusement are often intended emotions (Alden, Mukherjee, & Hoyer, 2000). In addition, when communicating a story or message confu-sion is of particular interest to the storyteller. Surprise, amusement and confuconfu-sion could be modeled as discrete states or continuous measures of valence and arousal could be used to distinguish between them - depending on the model of emotion used.
The role of emotion in marketing and advertising effectiveness has been considered extensively since early work by Zajonc (1980) that argued emotion functions independently of cognition and can indeed override it. Since then, emotions in advertising have been shown to enhance the emotional connection consumers have with brands (Mehta & Purvis, 2006), viewer engagement (Teixeira, Wedel, & Pieters, 2010), ad recall (Hazlett & Hazlett, 1999; Ambler & Burne, 1999) and decisions to share (virality) (Berger & Milkman, 2011). “Ad liking” was found to be the best predictor of sales success in the Advertising Re-search Foundation Copy validation ReRe-search Project (Haley, 1990). Biel (1990) and Gor-don (2006) state that likability is the best predictor of sales effectiveness. Haley (1990)
concluded that the concept of “likability” of a commercial was the best predictor of sales effectiveness.
Memory of stories, advertisements and brands is an important measure for success when it is not possible to measure sales effects directly. By creating advertisements that surprise, that engage, and entertain, advertisers and storytellers hope to create memorable material. Explicit memory of advertising (recall and recognition) is one of the most fre-quently used metrics for measuring advertising success. Independent studies have demon-strated the sales validity of recall (Haley, 1990; Mehta & Purvis, 2006). Indeed, recall was found to be the second best predictor of advertising effectiveness (after ad liking) as mea-sured by increased sales in the Advertising Research Foundation Copy validation Research Project (Haley, 1990). Ambler and Burne (1999) and Mehta and Purvis (2006) show that emotion plays an important role in the relationship between brand and advertising recall and that emotional content in well-executed commercials can boost recall.
Companies will frequently place their commercials on free video broadcasting web-sites such as YouTube with the hope that they will be shared by people. If a video circu-lates rapidly across the Internet it can be considered as being “viral”. Berger and Milk-man (2011) investigated what makes online content viral and found that positive affect inducing content was more viral than negative affect inducing content and that virality was also driven by high physiological arousal. Although their study focuses on written content it is reasonable to think that similar principles may apply to videos and that commercials that induce higher intensity positive responses would be more likely to go viral.
Behavioral methods such as ad zapping or banner click-through rates are frequently used methods of measuring success. Teixeira et al. (2010) show that inducing affect is important in engaging viewers in online video adverts and in reducing the frequency of “zapping” (skipping the advertisement). They demonstrated that joy was one of the states that stimulated viewer retention in the commercial. Micu and Plummer (2010) measured zygomatic major activity using facial electromyography (EMG) whilst people watched TV ads. They showed that physiological measurements capture different information compared
to self-reported responses.
The previous work provides compelling evidence that the emotions elicited by a video ad are related to its success. This evidence generalizes across many different measures of success. Ultimately, purchase decisions are the truest measure of advertising effec-tiveness. When making decisions, our past and current emotion experiences bias our decision-making unconsciously, making emotions an important influencer on our deci-sions (G. Loewenstein & Lerner, 2003). Sales as a measure of the success of advertising and predicting sales success from affective responses will be one focus. However, the suc-cess of an advertisement varies from person to person and sales figures at this level are often not available. I will also consider other measures of success, in particular liking, desire to view again and stated purchase intent (PI).
2.2 Political Ads and Debates
Brader (2005) found that political campaigning - in particular TV advertising - achieves its goal in part by appealing to the emotions of the viewers and that different emotional states led to different self-report responses. In particular, whether an ad appeals to fear or enthusiasm can have a considerable effect on its persuasive power. The success of political media is typically measured by polling audiences. This may be performed via telephone interviews or focus groups. Luntz (1994) highlights the power in audience measurement. However, he also identifies that focus groups, in which people gather in a single room and report their feelings via a button- or dial-operated computer, can be the least financially profitable tool in political polling. Focus groups present many challenges, reporting emo-tions using a dial or slider can detract from the experience of interest and participants are typically limited to those within a small geographic area. I will show that analyzing facial responses to election debates clips can reveal information about viewers’ reported pref-erences of candidates and potentially represent a much more efficient method of polling audiences in a short space of time.
2.3 Movie Clips
Gross and Levenson (1995) compiled a widely used dataset of Hollywood film clips that have been validated to induce certain emotions in a majority of viewers. Well validated emotion eliciting material, whether it be images (P. J. Lang, Bradley, & Cuthbert, 1999), music (Strapparava, Mihalcea, & Battocchi, 2012) or movie clips (Gross & Levenson, 1995), are a very useful resource in emotion research (Coan & Allen, 2007). Using movie clips provides a well known and controlled set of stimuli by which we can understand the relationship between different modalities in different types of emotional response. In addition, we can compare these responses to responses to other media (TV ads, political de-bates, etc) which have not been validated to elicit a specific emotional state and may elicit a variety of emotions. I use the standard dataset presented in Gross and Levenson (1995) in order to collect facial and physiological responses to well known and widely used stimuli and provide reference point for the comparison of responses to media over the Internet.
Chapter 3
Emotion Models and Measurement
3.1 Models of Emotion
Emotion theorists have long debated the exact definition of an emotion and a number of models and taxonomies of emotion have been proposed. Three commonly used approaches are discrete or categorical models, continuous or dimensional models and cognitive-appraisal models. I will briefly summarize these main approaches; a deeper discussion can be found in Fox (2008).
The discrete categorization of emotion posits that there are “affect” programs that drive a set of core basic emotions (Silvan & McCarter, 1964). The model makes the assump-tion that there is high agreement in the way that people express and perceive expressions with respect to emotion. Most discrete theories of emotion list a set of prototypical (basic) states. A commonly used set of basic states is: happiness, sadness, fear, anger, disgust, and surprise. This set was first proposed by Ekman, Friesen and Ellsworth (1972). Ortoney and Turner (1990) present the different categories of basic emotions that have been pro-posed. These vary from two to 11 emotion labels. Other researchers (e.g. El Kaliouby and Robinson (2005)) have used categorizations of affective and cognitive mental states (such as agreeing, concentrating and disagreeing) rather than basic emotions. For some applica-tions these may be more appropriate. However, there is much less evidence to suggest that
they are universally expressed.
Russell (1980) argues for a continuous model of affect rather than a discrete model. The most commonly used continuous model of the emotion space is the circumplex model. A circumplex is a circular two-dimensional space in which points close to one another are highly correlated. Valence (pleasantness) and arousal (activation) are the most frequently selected descriptions used for the two axes of the circumplex (J. A. Russell, 1980). A third dimension of dominance, or power, is in some cases added. The most appropriate principal axes of the emotion space have been debated (R. J. Larsen & Diener, 1992). A popular interpretation is to use main axes of “Positive Affect” (PA) and “Negative Affect” (NA) with each of these axes containing an activation component.
The third model of affect that is commonly used is the cognitive-appraisal model, in which the influences of emotions on judgements are considered. There have been a number of different presentations of this theory (K. R. Scherer, 1999). However, the central tenet to all is that emotions are elicited and differentiated based on the person’s evaluation of an event or object. In this case a person’s appraisal of a situation (such as viewing a video) will have a bearing on the emotion that they experience and people in different contexts watching the same video will not necessarily experience the same emotion.
Details of discrete and continuous scales used for eliciting reports of emotions are dis-cussed later in the chapter. In this thesis I will utilize both discrete and dimensional repre-sentations of affect, classifying responses in categories such as disgust or amusement but also characterizing the response in terms of a continuous measure of valence. In certain cases it will be helpful to consider specific discrete emotion labels (in particular amuse-ment and disgust) in order to communicate the conclusions drawn. Appraisal models of emotion are very interesting and powerful. However, I will not be using this type of model in my thesis. The following subsections will discuss theories of how emotions relate to facial expressions and physiological changes.
3.2 Facial Expressions and Emotion
Charles Darwin was one of the first to demonstrate universality in facial expressions in his book, “The Expression of the Emotions in Man and Animals” (Darwin, Ekman, & Prodger, 2002). His work was partially inspired by that of surgeon Sir Charles Bell and anatomist Duchenne de Bologne (who was studying the muscular anatomy of the face using electrical stimulation). Since then a number of other studies have demonstrated that facial actions communicate underlying emotional information and that some of these expressions are consistent across cultures (Silvan & McCarter, 1964; Ekman & Friesen, 1971; Ekman, 1993; R. Larsen & Fredrickson, 1999). In the 1960s and 1970s Tomkins and McCarter (1964), Izard (1971) and Ekman and Friesen (1971) presented a series of studies finding cross-cultural universality in expression and interpretation of expressions - beyond Darwin’s somewhat anecdotal evidence - that they suggested was innate. More recently, researchers have shown that universality of expression extends to infants not just adults (Camras, Oster, Campos, Miyake, & Bradshaw, 1992).
This idea of an innate and universal link between emotions and facial expression is not without its critics (J. Russell, 1994). To clarify before we begin, I am going to use facial expression to describe facial actions here rather than the term “facial display” or “facial behavior”. However, the use may not always imply an emotional input as might be sug-gested by an emotion-expression compared to a motive-communication view. This follows a reasoning similar to that of Schmidt and Cohn (2001) and will simplify the discussion somewhat.
Kassam’s analysis of facial expressions (Kassam, 2010) demonstrates that both facial expressions and self-report responses have significant variance. Results show that expres-sion analysis provides unique insight into emotional experiences, different to information obtained via self-report questioning. Examples of the data collected are shown in the Af-fect Unit Spectrograms (AUSpec) (D. J. McDuff et al., 2010) shown in Figure 3-1. The color intensity of each block represents the percentage of people within the population of viewers who exhibited the corresponding action unit at that time. For the two clips, one
AU1 AU2 AU4 AU5 AU6 AU7 AU8 AU9 AU10 AU11 AU12 AU25 AU26 AU1 AU2 AU4 AU5 AU6 AU7 AU8 AU9 AU10 AU11 AU12 AU25 AU26 time time
Figure 3-1: Action Unit Spectrograms (AUSpec) from the 66 participants watching clips from ‘The Lion King’ (left) - Sadness and ‘When Harry Met Sally’ - Amusement (right). The color intensity of each block reflects the percentage of viewers within the population who exhibited the corresponding action unit at that time. Deeper color corresponds to more viewers. The action unit numbers refer to FACS codes (see FACS code glossary in Appendix C). Greater instances of AU4 are present during the sadness clip and greater instances of AU12 are present during the amusement clip. Data from McDuff et al. (2010). eliciting sadness (left) and one eliciting amusement (right), the aggregate facial expressions are clearly different. Futhermore, responses vary with time and the actions present during each clip are not mutually exclusive.
3.2.1 Facial Action Coding (FACS)
When using facial behavior as a measure of a person’s response it is important to clearly state how the behavior is quantified. There are two main approaches for coding of facial displays, “sign judgment” and “message judgment.” “Sign judgment” involves the labeling of facial muscle movements or actions, such as those defined in the Facial Action Coding Scheme (FACS) (Ekman & Friesen, 1977) taxonomy. “Message judgments” are labels of human perceptual judgment of the underlying state. In my work I will use facial expression classifiers trained on “sign judgments”, specific action units or combinations of action units, as they are objective and not open to contextual variation.
The Facial Action Coding System (FACS) (Ekman & Friesen, 1977) is the most widely used and descriptive system for coding facial actions. It is based on an initial system pro-posed by Hjortsjo (1969). A number of other coding systems also exist; EMFACS (Friesen