HAL Id: hal-03034904
https://hal.archives-ouvertes.fr/hal-03034904
Submitted on 7 Dec 2020HAL is a multi-disciplinary open access archive for the deposit and dissemination of sci-entific research documents, whether they are pub-lished or not. The documents may come from teaching and research institutions in France or abroad, or from public or private research centers.
L’archive ouverte pluridisciplinaire HAL, est destinée au dépôt et à la diffusion de documents scientifiques de niveau recherche, publiés ou non, émanant des établissements d’enseignement et de recherche français ou étrangers, des laboratoires publics ou privés.
Excited-State Proton Transfer in Oxyluciferin and Its
Analogues
Pauline Gosset, Gregory Taupier, Olivier Cregut, Johanna Brazard, Yves
Mely, Kokou Dodzi Dorkenoo, Jérémie Léonard, Pascal Didier
To cite this version:
Pauline Gosset, Gregory Taupier, Olivier Cregut, Johanna Brazard, Yves Mely, et al.. Excited-State Proton Transfer in Oxyluciferin and Its Analogues. Journal of Physical Chemistry Letters, American Chemical Society, 2020, 11 (9), pp.3653-3659. �10.1021/acs.jpclett.0c00839�. �hal-03034904�
Page 1 sur 17
Excited-State Proton Transfer in Oxyluciferin and
its Analogues
Pauline Gosseta,b, Grégory Taupiera, Olivier Créguta, Johanna Brazarda, Yves
Mélyb, Kokou-Dodzi Dorkenooa, Jérémie Léonarda,*, Pascal Didierb,*
aIPCMS, Département d’Optique ultrarapide et de Nanophotonique (DON) UMR 7504 CNRS
23 rue du Loess BP 43, 67034, STRASBOURG Cedex 2, France
bLaboratoire de Bioimagerie et Pathologies, UMR 7021 CNRS, Université de Strasbourg,
67000 STRASBOURG, France
*corresponding authors: jeremie.leonard@ipcms.unistra.fr and pascal.didier@unistra.fr
Abstract: One of the most characterized bioluminescent reactions involves the firefly
luciferase that catalyzes the oxidation of the luciferin producing oxyluciferin in its first excited state. While relaxing to the ground state, oxyluciferin emits visible light with an emission maximum that can vary from green to red. Oxyluciferin exists under six different chemical forms resulting from a keto/enol tautomerization and the deprotonation of the phenol or enol moieties. The optical properties of each chemical form have been recently characterized by the investigations of a variety of oxyluciferin derivatives, indicating unresolved excited-state proton transfer (ESPT) reactions. In this work, femtosecond pump-probe spectroscopy and picosecond-resolved fluorescence are used to investigate the picosecond kinetics of the ESPT reactions and demonstrate the excited state keto to enol conversion of oxyluciferin and its derivatives in aqueous buffer as a function of pH. A comprehensive photophysical scheme is provided describing the complex luminescence pathways of oxyluciferin in protic solution.
TOC Graphic
Bioluminescence refers to the fascinating phenomenon of natural conversion of
chemical energy into light1 by living organisms. It is observed in the deep sea from sharks2,
dinoflagellates3,4, jellyfishes3 or on earth from bacteria3,5 or worms6. Up to now, firefly is the
Page 2 sur 17
reaction7. The light is emitted through the luciferase-catalyzed oxidation of D-luciferin resulting
in the formation of oxyluciferin (OxyLH2) in its first singlet excited state (S1), which then
decays radiatively to the ground state8–11. Due to its high quantum yield and the absence of
autofluorescence (no photo-excitation) that enable a high signal-to-noise ratio, the
luciferin/luciferase complex is very popular and widely used as a luminescent probe11,12 for
bioassays13–15 and for in vivo and in vitro bioimaging16–20.
Natural bioluminescence wavelengths are observed to vary from green to red1,21. Due to
its increasing number of applications, it is essential to understand the origin of the color
modulation which depends on several factors such as temperature, pH or nature of the luciferase
enzyme1,22–24. OxyLH
2 can exist under six different chemical forms resulting from keto/enol
tautomerization (see Scheme 1) and the deprotonation of the phenol and enol moieties25,26.The
main obstacle to the understanding of the OxyLH2 fluorescence emission is the high complexity
of its environment-sensitive photochemistry, which implies several ground-state equilibria and
excited-state interconversions between various protonated/deprotonated and keto/enol forms.
In addition, a major limiting experimental factor has long been related to the chemical synthesis
of OxyLH2, its lability being due to the presence of both keto and enol forms in protic solution
that permits a Mannich-type dimerization27. For these reasons, most spectroscopic
investigations were performed on luciferin in solution in the absence of the enzyme28–32 or only
recently on OxyLH2 and model compounds where excited state proton transfer (ESPT) or
keto-enol tautomerization are blocked. The steady-state optical properties of these derivatives have
been extensively investigated both theoretically26,33–41 and experimentally31,42,43 allowing for
instance to determine the relative concentrations of each chemical form as a function of pH31,42.
We recently characterized the pH dependence of oxyluciferin photophysics by using the
5,5-Cpr-OxyLH (Cpr = (spiro) cyclopropyl) and the 6’-Me-5,5-Cpr-OxyL to mimic the keto species
Page 3 sur 17
allowed us to propose a complete model to account for the photoluminescence cycle of OxyLH2
in aqueous solution. However, the limited temporal resolution of these experiments prevented
the characterization of the sub-50 ps dynamics associated to excited state reactions (ESPT and
tautomerization).The majority of the ultrafast spectroscopy investigations to characterize the
ESPT of D-luciferin, and more recently of OxyLH2 in solution were performed by the group of
D. Huppert44–47 by time-resolved fluorescence up-conversion or photon counting techniques.
Presiado I. et al. work with D-luciferin to mimic the keto form and dehydroluciferin to model
the enol form44, other groups use the 5,5-dimethyloxyluciferin to inhibit the keto-enol
tautomerization6,11. Erez et al. characterized the excited-state intermolecular proton transfer
using fluorescence up-conversion and determined the ESPT rate constant in water (3.0 x 10¹⁰ s
-1). They were however not able to disentangle the contributions of the various forms of OxyLH 2
which were since then shown to coexist in their experimental conditions (pH=6)31. The only
transient absorption experiment we are aware of was carried out on luciferin, with ps time
resolution48.
Scheme 1: Possible ground-state chemical forms of OxyLH2 in solution.
The above mentioned excited state reaction is also supported by theoretical calculations
performed to model the proton transfer for OxyLH2 and its analogues49–52. Another key step of
the OxyLH2 photophysics relies on the keto-enol tautomerization. Indeed, according to the
Page 4 sur 17
which can, during its excited state lifetime, undergo partial enolization and deprotonation.
Experiments performed by Naumov et al. using oxyluciferin analogues evidenced that in a
nonpolar and basic environment the keto form in the excited state can tautomerize into the enol
form, which subsequently undergoes excited state proton transfer to produce the enolate ion26,32.
These authors were however unable to determine the time scale of the keto-enol conversion.
To decipher the ps kinetics associated to the conversion between the OxyLH2 species,
we report here on femtosecond transient absorption (TA) and nanosecond fluorescence decay
measurements (see experimental details in the SI) performed on OxyLH2 and its analogues
(Scheme 2) in acidic (pH = 5) and basic (pH = 11) aqueous buffer solutions for which it is
possible to avoid a mixture between protonated and deprotonated forms in the ground state.
Still, the ground state keto-enol tautomerism results in the coexistence of both phenol-keto
(Scheme 2 a) and phenol-enol (Scheme 2b) tautomers for the OxyLH2 at pH=5 as previously
reported.31
Scheme 2: Model compounds used to mimic various forms of OxyLH2.
Hence, we first studied compounds 1a and 1b which mimic the keto species, since the
Cpr cycle prevents the conversion to the enol form (see Scheme1). In 1a, the phenol form is
“locked” since the hydroxyl group is replaced by a methoxy substituent (red) that precludes
Page 5 sur 17
the phenol-phenolate conversion of the keto form, in both S0 and S1. Figure 1 displays the TA
data obtained for these compounds as a function of pH.
Figure 1 : Excited-state signatures of the phenol-keto analogues. TA spectroscopy of 1a for
all pH values (right) and 1b at pH=5 (middle) and pH=11 (left). (a), (b) and (c) are steady-state absorption (green) and emission (blue) spectra, (d), (e) and (f) are 2D maps, false-color representations of the transient absorption (ΔA) signal as a function of probe wavelength and pump-probe delay. Positive (red) and negative (blue) contributions are Excited State Absorptions (ESA) and Stimulated emissions (SE), respectively. (g), (h) and (i) are the Decay Associated Spectra (DAS) obtained from global analysis (see SI for details).
The absorption and emission maxima wavelengths of 1a are 388 nm and 525 nm
respectively, independent of the pH value (Figure 1a). At pH=5, 1b is protonated and its
absorption spectrum is the same as 1a, characterizing the phenol-keto form. At pH=11, 1b
deprotonated (i.e. phenolate-keto) and its absorption maximum is shifted to 482 nm. For both
pH values, the emission spectrum of 1b is the same, centered at 640 nm, indicating that the
same emissive state is observed.
For 1a, two contributions are clearly apparent in the TA data (Figure 1d), a positive
signal (in red) at 460 nm associated to an Excited-State Absorption (ESA) and a negative signal
(in blue) at 525 nm corresponding to Stimulated Emission (SE) band that matches the
steady-a
e
R=
c
a
b
R=
R=
-R
=
-c
e
b
R=
-R=
-d
f
Page 6 sur 17
state emission spectrum of the phenol-keto form later denoted R=. For 1b at pH=5, the early
ESA and SE bands at 470 nm and 525 nm respectively, are associated to the same S1. signature
of the phenol-keto form (R=). After a few picoseconds, these bands undergo a red-shift to 550
nm and 640 nm respectively, which correspond to the S1 signature of the phenolate-keto form
(―R=) form as evidenced by the TA data obtained at pH=11 in Figure 1f. We conclude that the
TA data for 1b at pH=5, reveal the deprotonation of the phenol-keto form in S1, namely an
ESPT reaction. At long time delays at pH=5 (Figure 1e), a positive signal at 480 nm remains
up to 4 ns (and beyond), after the decay of the two ―R= S
1 contributions. This long-lived signal
corresponds to the absorption band of the deprotonated, ground-state photoproduct.
The results of the global analysis of the TA data (see methods in SI) are reported Figure
1g,h,i. The long time constants (yellow) were obtained from fluorescence decay measurements
and fixed for the TA analysis. The short time constants of 0.6 ps and 2.2 ps for 1a, 0.43 ps for
1b at pH=5, and 0.5 ps and 4.25 ps for 1b at pH=11 characterize spectral relaxations likely due
to vibrational and solvent relaxation. The 3-ps time constant for 1b at pH=5, is a time scale on
which we may expect further vibrational and solvent relaxation in line with the 2.2-ps DAS
obtained for 1a, but on this time scale, the rise of the 640 nm SE band of the deprotonated form
(―R=) is clearly observed. On the 22 ps time constant, we observe the complete decay of the
initial ESA band at 470 nm, as well as the decay of the initial SE and rise of the subsequent
ESA both around 540 - 570 nm. Hence, both the 3 ps and 22 ps time constants are associated
to the ESPT reaction kinetics. The DAS associated to the infinite time constant is similar to the
steady-state absorption spectrum measured at pH=11, confirming its assignment to the
deprotonated ground-state. Therefore, reprotonation of the ground-state is significantly slower
Page 7 sur 17
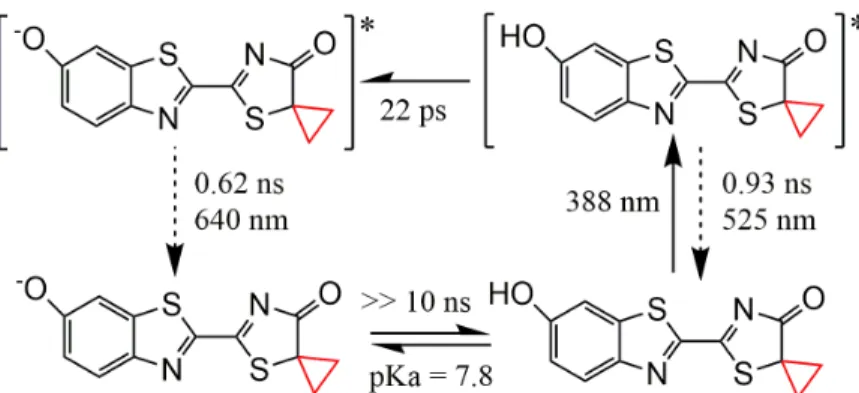
Scheme 3 : Photoluminescence pathway of the phenol-keto species.
Scheme 3 summarizes the photoluminescence pathway of the phenol-keto form and the
characteristic time associated to the ESPT reaction from the phenol-keto to phenolate-keto
form, as determined here by TA absorption spectroscopy.
Figure 2 : Excited-state signatures of the phenol-enol analogues. TA spectroscopy of 2a
for all pH values (right) and 2b at pH=5 (middle) and pH=11 (left). (a), (b) and (c) are steady-state absorption (green) and emission (blue) spectra, (d), ( e) and (f) are 2D map of the transient absorption (ΔA) signal as a function of probe wavelength and pump-probe delay. Positive contributions (red) are the Excited State Absorption (ESA) and the negative contributions (blue) corresponds to the Stimulated Emission (SE). (g), (h) and (i) are the DAS obtained after the global analysis.
We next report on the excited-state dynamics of 2a and 2b. For 2a, where two methoxy
Page 8 sur 17
and 445 nm, respectively (Figure 2a). For 2b, only one methoxy group is present to lock the
“phenol” moity – i.e. methoxyphenyl – such that the enol-keto conversion may occur. At pH=5,
the absorption spectrum is maximum at 367 nm and corresponds to a mixture of both tautomers
which indeed coexist at equilibrium in the ground state. Upon excitation at 400nm, the fraction
of light absorbed by the enol and keto forms are 66% and and 33%, respectively.42 Only the
enol moiety can undergo an ESPT. At pH=11 instead, the enolate form is pure in the ground
state with an absorption band (415 nm) characterizing the phenol-enolate form. The 2b emission
maximum is 555 nm for both pH values.
The TA spectra for 2a are characterized by two ESA bands centered at 475 nm and
675 nm (Figure 2d), the former one overcoming – and therefore masking - the SE signal
expected in the same spectral range. The 675 nm ESA will next be used as a specific signature
of the phenol-enol form in S1 and is denoted R hereafter. For 2b at pH=5, the same two ESA
bands as in 2a (R signature) are observed at early times, and are replaced after several tens of
ps by the S1 signatures SE of the phenol-enolate (R―), observed at pH=11 (Figure 2f). We note
here already, that since both tautomers are present in the ground state, we should also expect to
observe in the 2b TA map the R= signature as illustrated in Figure 1d (remember that 2b cannot
deprotonate on the phenol moiety, like 1a). However, while the R= signature is not easily
identified by visual inspection of figure 2e, it will clearly arise from its quantitative analysis
and corresponding DAS as discussed below.
The DAS resulting from global analysis are displayed in Figure 2g, h and i. Here again,
the shortest time constants of 1.6 ps for 2a, 0.3 ps for 2b at pH=5 and 0.2 ps and 2.1 ps for 2b
at pH=11 are attributed to intramolecular and solvent relaxations, and the longest time constants
(yellow) are those obtained from fluorescence decay measurements (Table S2). The remaining
15 ps and 630 ps components for 2b at pH=5 are not present at pH=11. The 15 ps DAS is clearly
Page 9 sur 17
decay of the 675 nm ESA band characterizing R, and the rise of the R- SE band around 580
nm. Finally, the 630 ps DAS (Figure 2h, grey vurve) displays - below 600nm - a spectral shape
similar to that of the 930 ps DAS characterizing the decay of the phenol-keto (R=) signature as
identified with 1a (Figure 1g), in full line with our expectations above since both tautomers are
excited at 400 nm.
This analysis is confirmed by time-resolved fluorescence spectroscopy of 2b at pH=5,
which also reveals a 630 ps lifetime - significantly different from the 930 ps one measured for
1a - together with a 7.9 ns time constant associated to the decay of the phenol-enolate form. As
we will further argue below for the case of OxyLH2, we propose here that the decrease in the
lifetime of the phenol-keto species in 2b with respect to 1a is due to the keto to enol conversion,
which is an additional decay channel for 2b, as compared to 1a where the cyclopropyl group
prevents it. We thus infer the rate constant of the S1 keto to enol conversion of 2b as being (2ns)
-1 = (630ps)-1 - (930ps)-1. Scheme 4 summarizes the photoluminescence pathway accounting for
the ESPT leading to the formation of the phenol-enolate form as well as the excited-state
keto-enol conversion.
Page 10 sur 17
Figure 3: Excited-state signatures of OxyLH2 measured at pH 5. (a) Steady-state absorption
(green) and emission (blue) spectra, (b) 2D map of the transient absorption (ΔA) signal as a function of probe wavelength and pump-probe delay. Positive contributions (red) are the ESA and the negative contributions (blue) correspond to SE. (c) DAS obtained after global analysis.
After identifying the spectral signatures and kinetics of 1a and 2b, we conclude this
work by discussing the photoluminescence pathway of OxyLH2 at pH=5. TA spectroscopy data
are displayed in Figure 3. At pH=5, OxyLH2 is a 30%/70% keto/enol mixture, characterized
by an absorption maximum at 371 nm, and a dual emission spectrum with a dominating band
centered at 555 nm and a weaker one at 450 nm (Figure 3a). Upon 400 nm excitation of both
tautomers, the TA data (Figure 3b) reveals the 675 nm ESA band characterizing the S1 signature
of the phenol-enol form (R) at early time delays. On the few-10-ps time scale, this signature
disappears to give rise to a red (640 nm) SE while the high energy ESA red-shifts from 475 nm
to ~520 nm. This indicates the formation of phenolate-keto (―R=) form, as observed in Figure
1e, produced upon direct excitation of the phenol-keto form already present in S0. Finally, the
SE band broadens down to below 600 nm on the few-100-ps time scale and remains long-lived,
which is the signature identified for the phenol-enolate (R-, Figure 2e) formed via ESPT upon
Page 11 sur 17
The quantitative analysis of the TA data is reported in Figure 3c. The longest lifetime
of 7.9 ns was determined by TCSPC fluorescence spectroscopy. The spectral shape of the 7.9 ns
DAS is thought to correspond to the sum of the phenol-enolate ESA (7.9 ns DAS in Figure 2i)
and the ground state absorption of the phenolate-keto observed for 1b (“inf” DAS in Figure 2h).
The 590 ps DAS has a spectral shape recalling the 630 ps DAS observed in Figure 1h and is
thus assigned to the phenolate-keto (―R=) decay. The 21 ps DAS component (Figure 3c) likely
accounts for both ESPT reactions occurring on similar time scales. The shortest time constant
(0.2 ps) and corresponding DAS are assigned to spectral relaxations due to intramolecular
and/or solvent relaxations. Similarly to the experiments performed on compounds 1b and 2b in
bsic conditions, the excited state dynamics of oxyluciferin at pH=11 (Figure S2) is described
by a single species displaying a fluorescence lifetime of 6.2 ns significantly different from the
phenol-enolate lifetime (7.9 ns). This contribution is associated to the dianion OxyL2- (i.e.
phenolate-enolate) which was shown to be the only ground state species in basic condition31,
and does not contribute to the photoluminescence pathway in acidic conditions.
We next wonder if the S1 keto to enol conversion observed with 2b may also occur for
OxyLH2 at pH 5. We were best able to address this question based on fluorescence spectroscopy
after shifting the excitation wavelength to 430 nm, where only the phenol-keto form absorbs in
the initial tautomer mixture (Figure S3). The measured fluorescence decays and emission
spectrum clearly evidence the contribution of both phenolate-keto and phenol-enolate forms
(Figure S5), demonstrating the excited state phenol-keto to phenol-enol conversion. Both forms
are also rapidly converted, through an ESPT reaction, into the phenolate-keto and
phenol-enolate anions, respectively. More precisely, the relative amplitudes associated to the decay
components of the phenolate-keto (0.62 ns) and of the phenol-enolate (7.9 ns) - see Figure S5a
- allow us to infer the phenol-keto to phenol-enol conversion rate k1, on the basis of the global
Page 12 sur 17
Independently, the relative weight of both anion emission spectra in the OxyLH2 steady-state
fluorescence (Figure S5b) can be analyzed (see SI) to infer k1 as well. Both the analyses of
time-resolved and steady-state emission data reveal the same value of k1 = (60 ps)-1. All time
constants associated to the kinetics of the complex photoluminescence pathway of OxyLH2
determined in this work are summarized in Scheme 5.
In conclusion, spectrally-resolved femtosecond transient absorption experiments and
TCSPC fluorescence decay measurements were used to characterize the excited-state dynamics
of OxyLH2 and its analogues as a function of the pH in water solution. With the help of
derivatives where deprotonations or keto-enol tautomerization are blocked, it was possible to
determine for the first time the characteristic time constants associated to the excited-state
reactions. For the phenol-keto and phenol-enol model compounds, the measured ESPT time
scales are on the order of 15-20 ps. Moreover, the DAS analysis performed on the model
compounds allowed us to identify their specific S1 spectral signatures. The results obtained with
these compounds were used to interpret the dynamics observed on the natural emitter: OxyLH2.
In particular, the characteristic spectral signatures of the model compounds were used to
disentangle the contributions from the phenol-enol and phenol-keto forms in the complex
photophysics of OxyLH2, including site-specific ESPT reactions and their kinetics. In addition,
Page 13 sur 17
experiments with red-shifted excitation were performed to characterize the excited-state
conversion of OxyLH2 from the phenol-keto to phenol-enol forms. All these results were used
to fully unravel the complex photoluminescence pathways of OxyLH2 at pH=5 by providing
the excited-state reaction timescales (Scheme 5). Though these results do not directly apply to
the photoreactivity within the luciferase active pocket, they demonstrate the role played by the
pH on the excited-state photophysics, and the key role of specific hydrogen bonds between the
chromophore and the protein binding pocket for controlling the bioluminescence spectrum via
the tuning of excited- state proton transfer or tautomerism reaction kinetics. They also suggest
that the same strategy could be used by incorporating these synthetic compounds in the natural
binding pocket of Luciferase in order to unravel the photoluminescence mechanism of the
oxyluciferin-luciferase complex. This work is in progress in our labs.
Acknowledegments
This work was supported by the Agence Nationale de la Recherche (BIOLUM ANR-16-CE29-0013).
Supporting Information Available
Experimental details; fluorescence decays and singular transient measured at pH=5 and pH=11; table containing all the measured lifetimes; description of the model used to determine the keto to enol excited state conversion rate.
References
(1) Seliger, H. H.; McElroy, W. D. The Colors Of Firefly Bioluminescence: Enzyme Configuration And Species Specificity. Proc. Natl. Acad. Sci. U. S. A. 1964, 52 (1), 75–81.
(2) Duchatelet, L.; Claes, J. M.; Mallefet, J. Embryonic Expression of Encephalopsin Supports Bioluminescence Perception in Lanternshark Photophores. Mar. Biol. 2019, 166 (21).
https://doi.org/10.1007/s00227-019-3473-9.
(3) Woodland, J.; Gibson, H. Intermediates in the Bioluminescent Oxidation of Reduced Flavin Mononucleotide. J. Biol. Chem. 1963, 238 (7), 2537–2554.
(4) Lindström, J.; Grebner, W.; Rigby, K.; Selander, E. Effects of Predator Lipids on
Dinoflagellate Defence Mechanisms - Increased Bioluminescence Capacity. Sci. Rep. 2017, 7 (13104). https://doi.org/10.1038/s41598-017-13293-4.
(5) Lee, J. Perspectives on Bioluminescence Mechanisms. Photochem. Photobiol. 2017, 93 (2), 389–404. https://doi.org/10.1111/php.12650.
Page 14 sur 17
(6) Branchini, B. R.; Southworth, T. L.; Murtiashaw, M. H.; Magyar, R. A.; Gonzalez, S. A.; Ruggiero, M. C.; Stroh, J. G. An Alternative Mechanism of Bioluminescence Color Determination in Firefly Luciferase. Biochemistry 2004, 43 (23), 7255–7262. https://doi.org/10.1021/bi036175d. (7) Ando, Y.; Niwa, K.; Yamada, N.; Enomoto, T.; Irie, T.; Kubota, H.; Ohmiya, Y.; Akiyama, H. Firefly Bioluminescence Quantum Yield and Colour Change by PH-Sensitive Green Emission. Nat. Photonics 2008, 2 (1), 44–47. https://doi.org/10.1038/nphoton.2007.251.
(8) White, E. H. The Chemi and Bioluminescence of Firefly Luciferin : An Efficient Chemical Production of Electronically Excited States. Biooganic 1971, 1 (1–2), 92–122.
(9) McCapra, F. Chemical Mechanisms in Bioluminescence. Acc. Chem. Res. 1976, 9 (6), 201– 208. https://doi.org/10.1021/ar50102a001.
(10) Mccapra. The Chemistry of Bioluminescence. Proc. R. Soc. Lond. Ser. B 1982, 215, 247–272. (11) Branchini, B. R.; Murtiashaw, M. H.; Magyar, R. A.; Portier, N. C.; Ruggiero, M. C.; Stroh, J. G. Yellow-Green and Red Firefly Bioluminescence from 5,5-Dimethyloxyluciferin. J. Am. Chem. Soc. 2002, 124 (10), 2112–2113. https://doi.org/10.1021/ja017400m.
(12) Branchini, B. R.; Southworth, T. L.; Fontaine, D. M.; Kohrt, D.; Welcome, F. S.; Florentine, C. M.; Henricks, E. R.; DeBartolo, D. B.; Michelini, E.; Cevenini, L.; Roda, A.; Grossel, M. J. Red-Emitting Chimeric Firefly Luciferase for in Vivo Imaging in Low ATP Cellular Environments. Anal. Biochem. 2017, 534, 36–39. https://doi.org/10.1016/j.ab.2017.07.001.
(13) Roura, S.; Gálvez-Montón, C.; Bayes-Genis, A. Bioluminescence Imaging: A Shining Future for Cardiac Regeneration. J. Cell. Mol. Med. 2013, 17 (6), 693–703.
https://doi.org/10.1111/jcmm.12018.
(14) Minekawa, T.; Ohkuma, H.; Abe, K.; Maekawa, H.; Arakawa, H. Practical Application of Bioluminescence Enzyme Immunoassay Using Enhancer for Firefly Luciferin-Luciferase
Bioluminescence. Luminescence 2011, 26 (3), 167–171. https://doi.org/10.1002/bio.1200.
(15) Takakura, H.; Kojima, R.; Urano, Y.; Terai, T.; Hanaoka, K.; Nagano, T. Aminoluciferins as Functional Bioluminogenic Substrates of Firefly Luciferase. Chem. - Asian J. 2011, 6 (7), 1800–1810. https://doi.org/10.1002/asia.201000873.
(16) Sun, Y.-Q.; Liu, J.; Wang, P.; Zhang, J.; Guo, W. D-Luciferin Analogues: A Multicolor Toolbox for Bioluminescence Imaging. Angew. Chem. Int. Ed. 2012, 51 (34), 8428–8430. https://doi.org/10.1002/anie.201203565.
(17) Greer, L. F.; Szalay, A. A. Imaging of Light Emission from the Expression of Luciferases in Living Cells and Organisms: A Review. Luminescence 2002, 17 (1), 43–74.
https://doi.org/10.1002/bio.676.
(18) Shinde, R.; Perkins, J.; Contag, C. H. Luciferin Derivatives for Enhanced in Vitro and in Vivo Bioluminescence Assays. Biochemistry 2006, 45 (37), 11103–11112.
https://doi.org/10.1021/bi060475o.
(19) Tian, X.; Li, Z.; Lau, C.; Lu, J. Visualization of in Vivo Hydrogen Sulfide Production by a Bioluminescence Probe in Cancer Cells and Nude Mice. Anal. Chem. 2015, 87 (22), 11325–11331. https://doi.org/10.1021/acs.analchem.5b03712.
(20) Buckley, S. M. K.; Delhove, J. M. K. M.; Perocheau, D. P.; Karda, R.; Rahim, A. A.; Howe, S. J.; Ward, N. J.; Birrell, M. A.; Belvisi, M. G.; Arbuthnot, P.; Johnson, M. R.; Waddington, S. N.; McKay, T. R. In Vivo Bioimaging with Tissue-Specific Transcription Factor Activated Luciferase Reporters. Sci. Rep. 2015, 5 (11842). https://doi.org/10.1038/srep11842.
Page 15 sur 17
(21) Cheng, Y.-Y.; Liu, Y.-J. Theoretical Development of Near‐Infrared Bioluminescent Systems. Chem. – Eur. J. 2018, 24 (37), 9340–9352. https://doi.org/10.1002/chem.201800416.
(22) Hiyama, M.; Akiyama, H.; Koga, N. Theoretical Insights into the Effect of PH Values on Oxidation Processes in the Emission of Firefly Luciferin in Aqueous Solution. Luminescence 2017, 32 (6), 1100–1108. https://doi.org/10.1002/bio.3308.
(23) Orlova, G.; Goddard, J. D.; Brovko, L. Yu. Theoretical Study of the Amazing Firefly Bioluminescence: The Formation and Structures of the Light Emitters. J. Am. Chem. Soc. 2003, 125 (23), 6962–6971. https://doi.org/10.1021/ja021255a.
(24) Hosseinkhani, S. Molecular Enigma of Multicolor Bioluminescence of Firefly Luciferase. Cell. Mol. Life Sci. 2011, 68 (7), 1167–1182. https://doi.org/10.1007/s00018-010-0607-0.
(25) Snellenburg, J. J.; Laptenok, S. P.; DeSa, R. J.; Naumov, P.; Solntsev, K. M. Excited-State Dynamics of Oxyluciferin in Firefly Luciferase. J. Am. Chem. Soc. 2016, 138 (50), 16252–16258. https://doi.org/10.1021/jacs.6b05078.
(26) Ran, X. Q.; Zhou, X.; Goddard, J. D. The Spectral-Structural Relationship of a Series of Oxyluciferin Derivatives. ChemPhysChem 2015, 16 (2), 396–402.
https://doi.org/10.1002/cphc.201402611.
(27) Maltsev, O. V.; Nath, N. K.; Naumov, P.; Hintermann, L. Why Is Firefly Oxyluciferin a Notoriously Labile Substance? Angew. Chem. Int. Ed. 2014, 53 (3), 847–850.
https://doi.org/10.1002/anie.201307972.
(28) Cheng, Y.-Y.; Liu, Y.-J. What Exactly Is the Light Emitter of a Firefly? J. Chem. Theory Comput. 2015, 11 (11), 5360–5370. https://doi.org/10.1021/acs.jctc.5b00659.
(29) White, E. H.; Wörther, H.; Field, G. F.; McElroy, W. D. Analogs of Firefly Luciferin. J. Org. Chem. 1965, 30 (7), 2344–2348. https://doi.org/10.1021/jo01018a054.
(30) Kakiuchi, M.; Ito, S.; Yamaji, M.; Viviani, V. R.; Maki, S.; Hirano, T. Spectroscopic Properties of Amine-Substituted Analogues of Firefly Luciferin and Oxyluciferin. Photochem. Photobiol. 2017, 93 (2), 486–494. https://doi.org/10.1111/php.12654.
(31) Ghose, A.; Rebarz, M.; Maltsev, O. V.; Hintermann, L.; Ruckebusch, C.; Fron, E.; Hofkens, J.; Mély, Y.; Naumov, P.; Sliwa, M.; Didier, P. Emission Properties of Oxyluciferin and Its
Derivatives in Water: Revealing the Nature of the Emissive Species in Firefly Bioluminescence. J. Phys. Chem. B 2014, 119 (6), 2638–2649. https://doi.org/10.1021/jp508905m.
(32) Solntsev, K. M.; Laptenok, S. P.; Naumov, P. Photoinduced Dynamics of Oxyluciferin Analogues: Unusual Enol “Super”Photoacidity and Evidence for Keto–Enol Isomerization. J. Am. Chem. Soc. 2012, 134 (40), 16452–16455. https://doi.org/10.1021/ja3045212.
(33) García-Iriepa, C.; Gosset, P.; Berraud-Pache, R.; Zemmouche, M.; Taupier, G.; Dorkenoo, K. D.; Didier, P.; Léonard, J.; Ferré, N.; Navizet, I. Simulation and Analysis of the Spectroscopic Properties of Oxyluciferin and Its Analogues in Water. J. Chem. Theory Comput. 2018, 14 (4), 2117– 2126. https://doi.org/10.1021/acs.jctc.7b01240.
(34) Pinto da Silva, L.; Esteves da Silva, J. C. G. Theoretical Study of the Nontraditional Enol-Based Photoacidity of Firefly Oxyluciferin. ChemPhysChem 2015, 16 (2), 455–464.
https://doi.org/10.1002/cphc.201402533.
(35) Pinto da Silva, L.; Esteves da Silva, J. C. G. Quantum/Molecular Mechanics Study of Firefly Bioluminescence on Luciferase Oxidative Conformation. Chem. Phys. Lett. 2014, 608, 45–49. https://doi.org/10.1016/j.cplett.2014.05.061.
Page 16 sur 17
(36) Pinto da Silva, L.; Simkovitch, R.; Huppert, D.; Esteves da Silva, J. C. G. Theoretical Study of the Efficient Fluorescence Quenching Process of the Firefly Luciferin. J. Photochem. Photobiol. Chem. 2013, 266, 47–54. https://doi.org/10.1016/j.jphotochem.2013.06.001.
(37) Pinto da Silva, L.; Esteves da Silva, J. C. G. Theoretical Analysis of the Color Tuning Mechanism of Oxyluciferin and 5-Hydroxyoxyluciferin. Comput. Theor. Chem. 2012, 988, 56–62. https://doi.org/10.1016/j.comptc.2012.02.029.
(38) Silva, L. P. da; Silva, J. C. G. E. da. Computational Investigation of the Effect of PH on the Color of Firefly Bioluminescence by DFT. ChemPhysChem 2011, 12 (5), 951–960.
https://doi.org/10.1002/cphc.201000980.
(39) Chen, S.-F.; Liu, Y.-J.; Navizet, I.; Ferré, N.; Fang, W.-H.; Lindh, R. Systematic Theoretical Investigation on the Light Emitter of Firefly. J. Chem. Theory Comput. 2011, 7 (3), 798–803. https://doi.org/10.1021/ct200045q.
(40) Navizet, I.; Roca-Sanjuán, D.; Yue, L.; Liu, Y.-J.; Ferré, N.; Lindh, R. Are the Bio- and Chemiluminescence States of the Firefly Oxyluciferin the Same as the Fluorescence State? Photochem. Photobiol. 2013, 89 (2), 319–325. https://doi.org/10.1111/php.12007.
(41) Falklöf, O.; Durbeej, B. Distinguishing between Keto-Enol and Acid-Base Forms of Firefly Oxyluciferin through Calculation of Excited-State Equilibrium Constants. J. Comput. Chem. 2014, 35 (30), 2184–2194. https://doi.org/10.1002/jcc.23735.
(42) Rebarz, M.; Kukovec, B.-M.; Maltsev, O. V.; Ruckebusch, C.; Hintermann, L.; Naumov, P.; Sliwa, M. Deciphering the Protonation and Tautomeric Equilibria of Firefly Oxyluciferin by
Molecular Engineering and Multivariate Curve Resolution. Chem. Sci. 2013, 4 (10), 3803–3809. https://doi.org/10.1039/c3sc50715g.
(43) Hirano, T.; Hasumi, Y.; Ohtsuka, K.; Maki, S.; Niwa, H.; Yamaji, M.; Hashizume, D.
Spectroscopic Studies of the Light-Color Modulation Mechanism of Firefly (Beetle) Bioluminescence. J. Am. Chem. Soc. 2009, 131 (6), 2385–2396. https://doi.org/10.1021/ja808836b.
(44) Presiado, I.; Erez, Y.; Simkovitch, R.; Shomer, S.; Gepshtein, R.; Pinto da Silva, L.; Esteves da Silva, J. C. G.; Huppert, D. Excited-State Proton Transfer of Firefly Dehydroluciferin. J. Phys. Chem. A 2012, 116 (44), 10770–10779. https://doi.org/10.1021/jp308818r.
(45) Erez, Y.; Presiado, I.; Gepshtein, R.; Pinto da Silva, L.; Esteves da Silva, J. C. G.; Huppert, D. Comparative Study of the Photoprotolytic Reactions of D-Luciferin and Oxyluciferin. J. Phys. Chem. A 2012, 116 (28), 7452–7461. https://doi.org/10.1021/jp301910p.
(46) Presiado, I.; Erez, Y.; Huppert, D. Excited-State Intermolecular Proton Transfer of Firefly Luciferin III. Proton Transfer to a Mild Base. J. Phys. Chem. A 2010, 114 (51), 13337–13346. https://doi.org/10.1021/jp107360d.
(47) Erez, Y.; Presiado, I.; Gepshtein, R.; Huppert, D. Excited-State Intermolecular Proton Transfer of Firefly Luciferin IV. Temperature and PH Dependence. J. Phys. Chem. A 2011, 115 (9), 1617– 1626. https://doi.org/10.1021/jp110889v.
(48) Cherednikova, E. Y.; Chikishev, A. Y.; Kosobokova, O. V.; Mizuno, M.; Sakai, M.; Takahashi, H. Picosecond Time-Resolved Absorption Spectroscopy of Luciferin. Chem. Phys. Lett. 1999, 308 (5–6), 369–372. https://doi.org/10.1016/S0009-2614(99)00625-9.
(49) Pinto da Silva, L.; Esteves da Silva, J. C. G. Chemiexcitation Induced Proton Transfer: Enolate Oxyluciferin as the Firefly Bioluminophore. J. Phys. Chem. B 2015, 119 (6), 2140–2148. https://doi.org/10.1021/jp5036458.
Page 17 sur 17
(50) Pinto da Silva, L.; Simkovitch, R.; Huppert, D.; Esteves da Silva, J. C. G. Oxyluciferin Photoacidity: The Missing Element for Solving the Keto-Enol Mystery? ChemPhysChem 2013, 14 (15), 3441–3446. https://doi.org/10.1002/cphc.201300402.
(51) Pinto da Silva, L.; Santos, A. J. M.; Esteves da Silva, J. C. G. Efficient Firefly
Chemi/Bioluminescence: Evidence for Chemiexcitation Resulting from the Decomposition of a Neutral Firefly Dioxetanone Molecule. J. Phys. Chem. A 2013, 117 (1), 94–100.
https://doi.org/10.1021/jp311711p.
(52) Silva, L. P. da; Silva, J. C. G. E. da. Firefly Chemiluminescence and Bioluminescence: Efficient Generation of Excited States. ChemPhysChem 2012, 13 (9), 2257–2262.