THE EVOLUTION OF QUANTITATIVE TRAITS IN RESPONSE TO
DROUGHT IN ARABIDOPSIS LYRATA
Thèse présentée à la faculté des Sciences Institut de Biologie
Université de Neuchâtel
Pour l’obtention du grade de docteur ès Sciences de la vie (Ph.D.) Par
Antoine Paccard
Présentée aux membres du jury: Prof. Yvonne Willi, directrice de thèse
Prof. Tadeusz J. Kawecki, rapporteur Prof. Félix Kessler, rapporteur
Soutenance réalisée le 25 Mars 2013
Université de Neuchâtel 2013
Rue Emile-Argand 11 2000 Neuchâtel - Suisse Tél: + 41 (0)32 718 2100 E-mail: [email protected]
IMPRIMATUR POUR THESE DE DOCTORAT
La Faculté des sciences de l'Université de Neuchâtel
autorise l'impression de la présente thèse soutenue par
Monsieur Antoine PACCARD
Titre:
“The evolution of quantitative traits in response to drought
in Arabidopsis lyrata”
sur le rapport des membres du jury:
Prof. Yvonne Willi, Université de Neuchâtel, directrice de thèse Prof. Felix Kessler, Université de Neuchâtel
Prof. Tadeusz Kawecki, Université de Lausanne
In spite of the great advances in population genetic and quantitative genetics over the last decades, many central questions of these fields are still not satisfactorily answered. In particular, we still have a poor understanding of how species are limited in their adaptation to changing environmental conditions and to habitats present beyond their natural distribution. In addition, our knowledge about the effect of habitat heterogeneity on the maintenance of genetic variation remains poor. In the context of global climate changes, many species will have to respond to different environmental conditions in order to survive. Therefore, understanding species’ ability to adapt and how high levels of the genetic variance necessary for adaptation can be maintained within populations is highly important. Such knowledge will be very useful for building new conservation strategies.
During this thesis I have investigated these questions using the Arabidospsis lyrata plant system. Its ability to grow on different substrates and the development of comprehensive genomic resources makes it a powerful system for studying adaptation. Several seed families occurring in a heterogeneous landscape and across two latitudinal clines in North America were raised in a common garden environment and in two different treatments: wet and dry. By measuring several traits all related to drought adaptation and by performing intense linear and multivariate statics, I discovered that genetic constraints and low levels of genetic variation are limiting northern populations to adapt to higher latitudes. In addition, I observed that habitat heterogeneity did not greatly impact the adaptive potential of this species. Results of this thesis offer a greater understanding of adaptive limits met at distribution edges. This new knowledge will help constructing models evaluating the impact of global changes on many plant and animal populations.
Keywords : adaptation, Arabidopsis lyrata, drought, water-use efficiency, G-matrix, latitudinal cline,
Contents
Acknowledgments
General introduction ……… 1
Chapter 1. Fine-scale landscape heterogeneity impacts evolutionary potential in Arabidopsis lyrata Abstract ……… 8
Introduction ……… 9
Material and methods ……… 13
Results ……… 19
Discussion ……… 21
Literature cited ……… 26
Tables and figures ……… 31
Supplementary material ……… 36
Chapter 2. Latitudinal variation in response to drought in Arabidopsis lyrata Abstract ……… 42
Introduction ……… 43
Material and methods ……… 47
Results ……… 54
Discussion ……… 56
Literature cited ……… 61
Tables and figures ……… 67
Chapter 3. A comparison of trait integration under drought stress along latitudinal clines in Arabidopsis lyrata Abstract ……… 80
Introduction ……… 81
Material and methods ……… 85
Results ……… 93
Discussion ……… 96
Literature cited ……… 101
Tables and figures ……… 106
Supplementary material ……… 114
Acknowledgments
This work was carried out at the Faculty of Science, Laboratoire de Botanique Évolutive at the University of Neuchâtel. I am grateful to my supervisor Professor Yvonne Willi for her constant availability, enthusiasm and support throughout this Ph.D. I also thank committee members Professor Tad Kawecki, Professor John Stinchcombe and Christian Parisod for their regular advices over the last three years. I want to thank Félix Kessler for accepting to be part of the examination Jury.
I acknowledge the Swiss National Science Foundation and the fondation Pierre Mercier pour la Science for founding this project. Thank to Chistiane Bobilier and the Doctoral School of Neuchâtel. I would like to thank the Michigan Department of Natural Resources, the US Army at Fort Leonard Wood, the Iowa State Preserves Advisory Board, the Iowa Department of Natural Resources, the Virginia Department of Conservation and Recreation, the Nature Conservancy of Maryland, the United States National Park Service and the New York State Office of Parks for collection permits. I thank the UNH Stable Isotope Laboratory for analyzing my samples. Thank to the staff of the Botanical Garden of Neuchâtel for their help and support with my first experiment
My warm thanks to my colleague and friend Philippa Griffin for her fulfilling help and advises. I particularly want to thank Anouk Sarr for her help in the lab. Thank to Julien Vieu, Emmanuel Bonjour and Marco Fracassetti for having the courage to share an office with me! I wish to thank the present and past members of the Evebot team: Julien, Manu, Marco, Pip, Georgi, Sara, Nina, Nat, Céline, Alexandre, Benj, Adnan, Katia, Olivier, Vincent, Anouk, Christian, Yvonne, Jason and Jonathan. I feel lucky to have been part of this research team. Many thanks to Alexandre Fruleux, Reyhan Sonmez, Anouk Sarr, Olivier Bachmann, Emmanuel Bonjour, Philippa Griffin, Katia Presani, Marta Anda Perez, Benjamin Dauphin, Adnan Peco, Julien Vieu for helping measuring plants. Thank to Josh Van Buskirk for his regular help in G-matrix analysis. I specially want to thank Anne-Marie Labouche and Romain Piault for their help in statistical analysis and for letting me sleep on their coach a few times! I also wish to thank Gwen, John and Valérie for welcoming me at their place regularly towards the end of this Ph.D. I want to thank my friends Sam Yeaman and Rowan Barrett for very inspiring scientific discussions.
I would have not chosen such a carrier path without the education I received from my parents. It is thank to them if I became curious and wanted to understand the living world. Thank to my siblings Anaïs, François and Aurélien for the constant support. Thank you Pierre, Marianne and Lily for your encouragements. Finally, I want to dedicate this thesis to my wife Krista who had the courage to follow me from Canada and settle in Europe so I could accomplish my study. Thank you for believing in me, supporting me and correcting my English! I would not be at this stage without you. Thanks for helping me keeping my feet on the ground!
General introduction
Context and research questions
In spite of the great advances in population genetics and quantitative genetics over the last decades, many central questions of these fields are still not satisfactorily answered. In particular, our understanding of how genetic variation is maintained in populations and how species are limited in their adaptation to changing environmental conditions remains unresolved. In the context of global climate change, it is important to improve our knowledge about the ability of species to adapt, as many conservation strategies will depend on the outcome of such research. This thesis has been devoted to finding answers to mainly three questions. I present them below and provide some information about the theory and past empirical insights.
How is genetic variation for polygenic traits maintained in populations?
After decades of debate, we are still in doubt about the evolutionary processes driving the maintenance of genetic variation within populations. The following processes have been considered important: heterogeneous selection regime and dispersal. While mutation-selection models appear to offer inconsistent results with empirical data (Johnson & Barton, 2005), many models have demonstrated that heterogeneous environments have the potential to create and maintain levels of genetic variance within populations (Gillespie & Turelli, 1989; Bürger & Gimelfarb, 2002; Spichtig & Kawecki, 2004; Turelli & Barton, 2004). In particular, the combination of habitat heterogeneity and low dispersal can sustain levels of genetic variance under local adaptation (Spichtig & Kawecki, 2004). Other processes such as specific genotype-by-environment interactions are also known to maintain genetic variance (Bürger, 2010) but examples of such interactions are still scarce (but see Via & Lande, 1985).
Despite these theoretical advances, empirical work demonstrating the role of environmental heterogeneity on the maintenance of genetic variance remains poor. Several experimental studies on Drosophila were performed but revealed conflicting results about the function of environmental variation on genetic variance (Mackay, 1981; García-Dorado et al., 1991; Yeaman et al., 2010). These! studies! commonly! assessed! only!one!or!two!focal!traits!for!which!genetic!variances!were!compared.!However,!it! may!be!that!genetic architecture between traits is important in shaping genetic variance in populations as well (Falconer & Mackay, 1996; Arnold et al., 2008). Therefore, progress may come from the use of the genetic variance-covariance matrix to describe genetic variation in many traits (Arnold, 1992).
Are species adapted to current climatic differences? Are adaptive differences fixed or plastic?
According to theory, long-term adaptation relies on both the actual level of genetic variation and the presence of new mutations (Hill & Rasbash, 1986; Wei et al., 1996). The selection regime and its consistency is another determinant of adaptation to local environmental variables (Robertson, 1960; Grant & Grant, 2002). And, both population size and the different levels of gene flow are known to greatly impact adaptation to habitat conditions (Kawecki & Ebert, 2004; Willi et al., 2006; Willi & Hoffmann, 2009). Basically, if genetic variation is plentiful, and if selection relative to gene flow is strong, then we expect adaptation. Climatic conditions can be assumed important enough to impose divergent selection among populations and to cause divergent climate adaptation, particularly at latitudinal margins of distribution.
At range margins, both fixed adaptive differences and phenotype plasticity can play a significant role in the adaptation of species. Recently, it has been proposed that such adaptation could be facilitated by phenotypic plasticity (Chevin & Lande, 2011). With high gene flow creating maladaptation (Kawecki, 2008; Sexton et al., 2009), strong directional selection would favour plasticity.
We still lack a clear picture of the adaptation patterns along large-scale climatic gradients and the role of adaptive phenotypic plasticity at range margins. In plant species, recent studies have looked at adaptation across altitudes (Hoffmann et al., 2009; Haider et
al., 2012) and latitudes (Stinchcombe & Weinig, 2004; Etterson, 2004a) but empirical
evidence of co-gradient variation, when trait differences correlate with environmental changes, are still rare (Conover & Schultz, 1995; Johnson & Barton, 2005; Conover et
al., 2009). Additionally, few of these studies looked at the extent of phenotypic plasticity
along large ecological gradients and particularly at range margins.
Why do species have spatially restricted distributions?
This question, central to the fields of ecology and evolutionary biology, remains open. Several factors can explain limits to adaptation at range margins. The selection regime may be different between core and marginal habitats (Bridle & Vines, 2006; Kawecki, 2008), but strong directional selection is expected at distribution edges (Sexton et al., 2009). As a consequence, both directional selection and small population size will diminish genetic variation and slow down adaptation at range margins (Wright, 1931). Additionally, gene flow may strongly influence adaptation to range margins (Bürger & Lynch, 1995; Sexton et al., 2009). However its effect has been differentially discussed, and models have proposed that gene flow can either promote or limit adaptation (Holt & Gaines, 1992; Lynch & Lande, 1993; Hoffmann & Blows, 1994; Bürger & Lynch, 1995; Kirkpatrick & Barton, 1997; Holt, 2003; Bridle & Vines, 2006).
Extensive progress of theoretical work is based on one- or two-locus models. However, adaptation is more likely to happen in a multivariate fashion, and limits to adaptation in marginal habitats should be investigated by the use of the genetic variance-covariance matrix for deducing evidence for genetic constraints (Lande, 1979; Arnold,
fasciculata, Etterson (2004a; b) looked at the evolutionary potential to climate change of
three populations growing across latitudes. Comparisons of G-matrices revealed that the northern population might be more constrained in its adaptation. Using a similar method Colautti and Barrett (2008) discovered that the invasive plant Lythrum salicaria had been strongly challenged in its invasion to new environments. Despite these results, almost no empirical work looked at the evolution of G across large ecological clines under different conditions and particularly at range margins.
Study system
To answer these general questions I used Arabidopsis lyrata subsp lyrata as a study system. A. lyrata is a close relative of the model species A. thaliana and is easy to cultivate and cross-pollinate in the lab. This species has genetically diverse populations and grows over a wide range of habitats (sand dunes, rocky parts, forests). Moreover, A.
lyrata is an outcrossing diploid and like A.thaliana has spatially restricted populations.
Finally, this species is found over latitudinal gradients in Europe and North America (Schmickl et al., 2010), suggesting an adaptive potential to the many environmental conditions present across latitudes (e.g. water availability, temperatures, light intensity). Therefore, Arabidopsis lyrata is an ideal species for the study of adaptation and evolution of quantitative traits.
This thesis
In this thesis, I tackled these questions, each in a separate chapter. Below is a summary of the approaches taken.
In Chapter 1, we investigated whether fine-scale habitat heterogeneity helps maintain genetic variation in ecologically relevant traits. In this study, we used plant material from a heterogeneous sand dune landscape on the eastern side of Lake Michigan, USA. Maternal seed families were harvested from two microhabitats known to differ in their soil water content: the top and bottom of sand dunes. Several individuals per family were raised in a common garden environment under either dry or control/wet conditions. Various traits, all known to be associated with a plant’s water balance, were measured and compared across treatment and habitats. Moreover, broad-sense genetic variance-covariance matrices (G) were constructed for all four microhabitat-treatment combinations. Several analyses were carried out to compare G across microhabitats so that the impact of a heterogeneous landscape on the maintenance of genetic variance could be revealed.
In Chapter 2, I explored whether populations occurring along two latitudinal gradients in North America displayed trait differences linked to local climatic conditions. Plants were raised under two environmental treatments. I investigated whether differences between
enhanced at the range margins. Seeds of nine populations were sampled across a range of 13° latitude. Replicate individuals per family were raised under either dry or control/wet conditions for a total of 1620 plants. Several physiological, morphological and leaf history traits were measured. Differences across treatments and populations were revealed by mixed model analysis. Plasticity to drought condition was calculated and differences between central and marginal populations were assessed by linear regression statistics.
Chapter 3 focused on the signature of limits to adaptive evolution at range margins in
comparison to centers of distribution. The study was based on the data set of the previous chapter and performed a multivariate statistical analysis to investigate such limitations. Accordingly, I constructed broad-sense G-matrices for each population-treatment combination and compared the ones estimated from populations of range margins with those estimated from populations of the center of distribution. Effects of latitudinal parameters on statistical outputs were revealed by mixed model analysis. Furthermore, comparisons were performed in a pairwise-fashion, and significance was revealed by re-sampling.
Literature cited
Arnold, S.J. 1992. Constraints on phenotypic evolution. The American Naturalist 140: S85–S107.
Arnold, S.J., Bürger, R., Hohenlohe, P.A., Ajie, B.C. & Jones, A.G. 2008. Understanding the evolution and stability of the G-matrix. Evolution 62: 2451–2461.
Bridle, J.R. & Vines, T.H. 2006. Limits to evolution at range margins: when and why does adaptation fail? Trends in Ecology & Evolution 22: 140–147.
Bürger, R. 2010. Evolution and polymorphism in the multilocus Levene model with no or weak epistasis. Theoretical Population Biology 78: 123–138. Elsevier Inc.
Bürger, R. & Gimelfarb, A. 2002. Fluctuating environments and the role of mutation in maintaining quantitative genetic variation. Genetical Research 80: 31–46.
Bürger, R. & Lynch, M. 1995. Evolution and extinction in a changing environment: a quantitative-genetic analysis. Evolution 49: 151–163.
Chevin, L.M. & Lande, R. 2011. Adaptation to marginal habitats by evolution of increased phenotypic plasticity. Journal of Evolutionary Biology 24: 1462–1476. Colautti, R.I., Maron, J.L. & Barrett, S.C.H. 2008. Common garden comparisons of
native and introduced plant populations: latitudinal clines can obscure evolutionary inferences. Evolutionary Applications 2: 187–199.
Conover, D.O. & Schultz, E.T. 1995. Phenotypic similarity and the evolutionary significance of countergradient variation. Trends in Ecology & Evolution 10: 248– 251.
Conover, D.O., Duffy, T.A. & Hice, L.A. 2009. The covariance between genetic and environmental influences across ecological gradients. Annals of the New York
Academy of Sciences 1168: 100–129.
Great Plains. Evolution 58: 1446–1458.
Etterson, J.R. 2004b. Evolutionary potential of Chamaecrista fasciculata in relation to climate change. ll. Genetic architecture of three populations reciprocally planted along an environmental gradient in the Great Plains. Evolution 58: 1459–1471. Falconer, D.F. & Mackay, T.F.C. 1996. Introduction to Quantitative Genetics (4th ed).
Addison Wesley Longman, Harlow, UK.
García-Dorado, A., Martin, P. & García, N. 1991. Soft selection and quantitative genetic variation: a laboratory experiment. Heredity 66 ( Pt 3): 313–323.
Gillespie, J.H. & Turelli, M. 1989. Genotype-environment interactions and the maintenance of polygenic variation. Genetics 121: 129–138.
Grant, P.R. & Grant, B.R. 2002. Unpredictable evolution in a 30-Year study of Darwin's finches. Science 296: 707–711.
Haider, S., Kueffer, C., Edwards, P.J. & Alexander, J.M. 2012. Genetically based differentiation in growth of multiple non-native plant species along a steep environmental gradient. Oecologia 170: 89–99.
Hill, W.G. & Rasbash, J. 1986. Models of long-term artificial selection in finite population with recurrent mutation. Genetics Research 48: 125–131.
Hoffmann, A.A. & Blows, M.W. 1994. Species borders: ecological and evolutionary perspectives. Trends in Ecology & Evolution 9: 223–227.
Hoffmann, A.A., Griffin, P.C. & Macraild, R.D. 2009. Morphological variation and floral abnormalities in a trigger plant across a narrow altitudinal gradient. Austral Ecology
34: 780–792.
Holt, R.D. 2003. On the evolutionary ecology of species' ranges. Evolutionary Ecology
Research 5: 159–178.
Holt, R.D. & Gaines, M.S. 1992. Analysis of adaptation in heterogeneous landscapes: Implications for the evolution of fundamental niches. Evolutionary Ecology 6: 433– 447.
Johnson, T. & Barton, N. 2005. Theoretical models of selection and mutation on quantitative traits. Philosophical Transactions of the Royal Society B-Biological
Sciences 360: 1411–1425.
Kawecki, T.J. 2008. Adaptation to marginal habitats. Annual Review of Ecology
Evolution and Systematics 39: 321–342.
Kawecki, T.J. & Ebert, D. 2004. Conceptual issues in local adaptation. Ecology Letters 7: 1225–1241.
Kirkpatrick, M. & Barton, N.H. 1997. Evolution of a species' range. The American
Naturalist 150: 1–23.
Lande, R. 1979. Quantitative genetic analysis of multivariate evolution, applied to brain: body size allometry. Evolution 33: 402–416.
Lynch, M. & Lande, R. 1993. Evolution and extinction in response to environmental change. In: Biotic Interactions and Global Change (P. Kareiva, J. G. Kingsolver, & R. B. Huey, eds), pp. 234–250. Sinauer Associates, Sunderland, MA.
Mackay, T.F.C. 1981. Genetic variation in varying environments. Genetical Research 37: 79–93.
Robertson, A. 1960. A theory of limits in artificial selection. Proceedings of the Royal
Schmickl, R., Jorgensen, M.H., Brysting, A.K. & Koch, M.A. 2010. The evolutionary history of the Arabidopsis lyrata complex: a hybrid in the amphi-Beringian area closes a large distribution gap and builds up a genetic barrier. BMC Evolutionary
Biology 10: 98.
Sexton, J., McIntyre, P. & Angert, A. 2009. Evolution and ecology of species range limits. Annual Review of Ecology Evolution and Systematics 40: 415–436.
Spichtig, M. & Kawecki, T.J. 2004. The maintenance (or not) of polygenic variation by soft selection in heterogeneous environments. The American Naturalist 164: 70–84. Stinchcombe, J.R. & Weinig, C. 2004. A latitudinal cline in flowering time in
Arabidopsis thaliana modulated by the flowering time gene FRIGIDA. Proceedings of the National Academy of Sciences, USA 101: 4712–4117.
Turelli, M. & Barton, N.H. 2004. Polygenic variation maintained by balancing selection: pleiotropy, sex-dependent allelic effects and G x E interactions. Genetics 166: 1053– 1079.
Via, S. & Lande, R. 1985. Genotype-environment interaction and the evolution of phenotypic plasticity. Evolution 39: 505–522.
Wei, M., Caballero, A. & Hill, W.G. 1996. Selection response in finite populations.
Genetics 144: 1961–1974.
Willi, Y. & Hoffmann, A.A. 2009. Demographic factors and genetic variation influence population persistence under environmental change. Journal of Evolutionary Biology
22: 124–133.
Willi, Y., Van Buskirk, J. & Hoffmann, A.A. 2006. Limits to the adaptive potential of small populations. Annual Review of Ecology Evolution and Systematics 37: 433– 458.
Wright, S. 1931. Evolution in mendelian populations. Genetics 16: 97–159.
Yeaman, S., Chen, Y. & Whitlock, M.C. 2010. No effect of environmental heterogeneity on the maintenance of genetic variation in wing shape in Drosophila melanogaster.
Chapter 1. Fine-scale landscape heterogeneity impacts evolutionary potential in
Arabidopsis lyrata
Antoine Paccard†, Marie Vance, Yvonne Willi
Institute of Biology, Evolutionary Botany, University of Neuchâtel, 2000 Neuchâtel, Switzerland
† Correspondence: Antoine Paccard Institute of Biology University of Neuchâtel Rue Emile-Argand 11 CH - 2000 Neuchâtel Tel. + 41 32 718 23 40 Fax + 41 32 718 30 01 E-mail [email protected]
Abstract
Microhabitat heterogeneity can lead to fine-scale local adaptation when gene flow is highly restricted, and fine-scale adaptation may in turn be important for maintaining genetic variation within populations. This study tested for microhabitat adaptation within a population of Arabidopsis lyrata growing across a heterogeneous sand-dune landscape and studied its impact on the genetic variance-covariance (G) matrix. Maternal seed families were collected from dune tops and bottoms, two microhabitats known to vary significantly in water availability. In a common-garden experiment, we raised replicate individuals per family under dry and well-watered conditions and assessed physiological, morphological and life history traits. Plants from the two microenvironments differed in their response to treatment in several performance components, most strongly in flowering time. Under well-watered conditions, plants originating from dune bottoms flowered five weeks earlier than those from dune tops. One measure of genetic variation when assessed under control conditions – the number of independent trait dimensions – was larger in the entire population than within subpopulations separated by microhabitat. However genetic variation expressed as the size of the G-matrix was no larger in the entire population than within subpopulations separated by microhabitat, and trait correlation structure between microhabitats and treatments was not significantly different. These results indicate that fine-scale habitat heterogeneity can lead to local adaptation, which in turn weakly affects levels of across-trait genetic variation.
Introduction
Understanding how high levels of genetic variation are maintained in quantitative traits under stabilizing selection remains a major puzzle in evolutionary biology (Barton & Turelli, 1989; Johnson & Barton, 2005). One explanation that is often overlooked arises from three factors acting together: limited gene flow, spatial environmental heterogeneity and selection acting on multiple traits (Barton & Turelli, 1989; Byers, 2005). Environmental heterogeneity can impose divergent selection, even over relatively small spatial scales (e.g., Mojica et al., 2012). Divergent selection may maintain genetic diversity directly (Spichtig & Kawecki, 2004; Bürger, 2010) or indirectly if it affects several traits via pleiotropy (Barton, 1990). We addressed this hypothesis by testing for microhabitat adaptation in a plant species distributed across a spatially heterogeneous landscape and by comparing genetic variance-covariance (G) matrices between two microenvironments.
One-locus models show that if dispersal between two habitat types is smaller than a critical value given by the difference in selection between habitats, local adaptation evolves and genetic polymorphism is maintained (Bulmer, 1972; Lenormand, 2002). Quantitative genetic models agree that spatial heterogeneity in selection and limited dispersal promote local adaptation (e.g., Kirkpatrick & Barton, 1997). Also, spatial heterogeneity in selection and limited dispersal can maintain genetic variation under soft selection – that is if selection acts locally (Spichtig & Kawecki, 2004). Certain additional conditions, such as the presence of particular genotype-by-environment interactions (G x E), may further help maintain genetic variation (Bürger, 2010). Examples of such G x E interactions include a correlation of breeding values across habitats of exactly ± 1 (Via &
Lande, 1985) and the situation in which fitter alleles are partially dominant within each deme, where demes differ in the selection regime (Bürger, 2010).
Mating among nearby individuals is common within populations of many species, and it is in these cases that microhabitat adaptation should be especially pronounced. This expectation is upheld in herbaceous plants, which often show fine-scale genetic structure at neutral loci (Vekemans & Hardy, 2004). Adaptation at a very local spatial scale does occur in nature, appearing on a scale of around 5m in Hydrocotyle bonariensis across a dune landscape (Knight & Miller, 2004), on a scale of < 12m in Impatiens capensis (Schmitt & Gamble, 1990), and on a scale of a few hundred meters in Collinsia
sparsiflora growing across a mosaic of serpentine and non-serpentine soils (Wright et al.,
2006).
Local adaptation may affect more than just the mean and genetic variance of one trait. Selection acts by necessity at the level of the whole phenotype, not on individual traits, making evolution a multivariate process (Lande, 1979). Divergent multivariate selection may therefore maintain genetic diversity in many traits simultaneously, either directly or indirectly. If genetic correlations are strong, selection on one trait may indirectly promote divergence in other, correlated traits (Arnold et al., 2008). Also, because genetic relationships between traits may be strengthened, weakened, or may even change sign depending on the environment in which they are expressed (Falconer & Mackay, 1996; Bégin & Roff, 2001), correlated selection is likely to maintain different patterns of genetic (co-)variance across different environments. Thus divergent multivariate selection combined with environment-specific trait expression may significantly shape genetic variation in quantitative traits.
The genetic variance-covariance (G) matrix is a convenient way of encapsulating multivariate genetic variation because it depicts both the signature of past adaptive evolution and potential genetic constraints on future evolution (Lande, 1979; Arnold, 1992). Comparisons among closely related populations indicate that G-matrices can reflect recent changes in the selection environment. A beautiful example is the comparison of G-matrices of Brassica rapa collected on a mesic and a dry site both before and after a five-year drought (Franks & Weis, 2008). The authors assessed traits under control and dry conditions and found that the pre- and post-drought matrices of the mesic site were similar under control conditions but shared little similarity under experimental water shortage. In contrast, pre- and post-drought matrices of the dry site were very similar under water shortage. A classic example where the G-matrix has been used to predict limits to future evolution has been studied in the annual prairie plant
Chamaecrista fasciculata (Etterson & Shaw, 2001). The authors found that the predicted
evolutionary response of the northernmost population to more southern conditions was slower than the predicted rate of climate change, mainly due to the presence of genetic correlations antagonistic to the direction of selection. Commonly, G-matrix comparisons are used to compare populations whose shared history is not especially recent, but the same method could prove useful for elucidating the effect of microhabitat adaptation on the maintenance of genetic variation within populations.
Here we examined the effects of divergent selection on the maintenance of genetic variation in a population of Arabidopsis lyrata inhabiting a heterogeneous sand dune landscape on the shore of Lake Michigan, USA. This species is most abundant on un- or weakly forested fore-dunes that provide environmental heterogeneity on the scale
of 5-20m. Dune tops are subject to strong wind, erosion and sand burial, while dune bottoms provide a more stable, sheltered environment. On dune tops, A. lyrata co-occurs predominantly with grasses, whereas the dune-bottom areas have more herbs and a few trees (e.g., Pinus banksiana). Soil moisture during late spring is about an order of magnitude lower in open dune-top areas than in dune bottoms with Pinus stands (Leege & Murphy, 2001). Plant material for this study was collected from Saugatuck Dunes State Park, Michigan. There, A. lyrata is outcrossing, but spatial autocorrelation analysis has shown that gene flow is limited beyond about 10m (Willi & Määttänen, 2010, 2011; Appendix S1). Thus limited gene flow and fine-scale environmental heterogeneity provide the conditions for the evolution of microhabitat adaptation. Moreover, this population is not strongly influenced by genetic drift: it has high neutral microsatellite gene diversity, and little impact of drift load on population mean performance was found (Willi & Määttänen, 2011; Willi, 2013; Willi et al., 2013). To test for local adaptation and phenotypic plasticity in plants from unforested dune-top areas and from forest edges of dune-bottom areas, we used a common-garden approach with two watering treatments. We then compared G-matrices to assess overall changes in the genetic (co)variance structure in response to divergent selection. Specifically, we tested (1) whether pooled families occupied larger genotypic “trait space” than families from either microhabitat alone, (2) whether the number of effective dimensions of genetic variation – as defined by Kirkpatrick (2009) – was larger in the two habitats pooled than in the sub-populations occurring in the separate microhabitats, and (3) whether families from different microhabitats differed in G-matrix structure.
Materials and Methods Sampling and Plant Rearing
In June 2009 we sampled siliques from plants on unforested dune-top areas (22 plants) and adjacent dune-bottom areas bordering forest (22 plants). Nearest plants were on average 23m apart within habitat (range: 7-56m) and 20m between habitats (4-49m), over a total surface area of 200m by 250m (Fig. 1A) at Saugatuck Dunes State Park, Lake Michigan, USA (42°42’, 86°12’). One silique was harvested per plant; these potentially contained full- and half-sib seeds. In June 2010 we measured volumetric soil moisture content (VMC) at 200 sites including open dune tops and forested dune bottoms on three consecutive days, using a soil moisture meter (Decagon ECH2O, Pullman, USA; calibrated as per manufacturer’s manual). The data are not reported here because they agree with Leege & Murphy’s (2001) finding that soil water is lower on open dune tops (e.g., foredunes and blowouts some meters away from pines) than on forested dune bottoms (e.g., under P. banksiana at wetpanne edges).
Siblings were grown under well-watered (control) and dry conditions. Twelve seeds were haphazardly selected from each maternal seed family and photographed against a white background so that seed size could be measured using ImageJ (Rasband, 2010). Two seeds were planted in each of six pots per family (7x7x8cm) in soil containing one part peat and one part sand. Families were divided equally among six blocks, with pot position randomized within block. Seeds were stratified at 4°C for five days before removal to the greenhouse in mid-February (average temperature 25°C, photoperiod increasing from 10-12h). Throughout the germination period, we watered pots to saturation every 1-2 days and germination was recorded every 2-3 days. A fine mesh
sheet was placed over the pots to maintain humidity around the germinating seeds until >60% germination had been achieved. After one month in the greenhouse, six seedlings per family (one per pot where applicable) were selected and transplanted into newly prepared pots. Individuals from each maternal seed family were randomly assigned to experimental blocks (3 levels) and treatments within blocks (2 levels). Within blocks, plants from a given treatment were spread over two separate holding trays. Pot position was random within holding tray, and holding trays were randomized weekly within block.
Transplants remained in the greenhouse for a 10d adjustment period before being subjected to a 12d vernalization treatment (4°C, 8h day) and then moved to indoor culturing facilities (22°C days, 18°C nights, 16h light at approximately 200 µmol m-2 s-1). We initiated the two treatments, defined by soil moisture content (VWC), one week after vernalization and maintained them for four weeks. Controls were watered to saturation every two days (mean VWC ~30%) while plants in the dry treatment were watered on average twice a week (mean VWC < 10%).
Trait Measures
We assessed multiple traits thought to be associated with plant performance and drought tolerance. Rosette diameter was recorded at weekly intervals during the experiment by measuring the length of the longest line through the center of each rosette. Relative growth was calculated by taking the rosette diameter at the end of treatment and dividing it by rosette diameter after one week of treatment.
traits were assessed. To ensure that the sampled leaves were of the same age, the youngest leaf on each plant was marked with acrylic nail polish prior to treatment. Since
A. lyrata produces leaves in a circular pattern of overlaid “growth rings”, leaves
harvested from above the marked leaf were known to have been produced during the treatment period. We then sampled leaves that were fully extended and hardened, and at the same position relative to the marked leaf on each plant.
We measured carbon isotope ratio (δ13C), an integrated measure of water-use efficiency, by collecting 50 mg of fresh leaf material from each plant and immediately drying it for 24 h in a lyophiliser (Edwards freeze dryer Modulyo, Thermo Scientific, USA). Once dry, samples were ground for 30 seconds with a steel bullet in a milling machine (MM300, Retsch, Germany) and analyzed by isotope mass spectrometry at the University of New Hampshire Stable Isotope Laboratory (as per Farquhar & Richards, 1984). The result is the carbon isotope ratio of the probe, Rp, relative to the Pee Dee belemnite standard (RPDB) (δ13C [‰] = (Rp/RPDB - 1) x 1000) (Farquhar et al., 1989). Data were corrected for ambient δ13C by subtracting the average δ13C value obtained from six corn plants that were raised alongside experimental plants. Because corn utilizes C4 and not C3 photosynthetic metabolism, it does not discriminate between the two carbon isotopes and is therefore a useful reference for the ambient carbon isotope ratio.
Leaf dissection and trichome density were measured on two leaves per plant. We photographed the leaves and used ImageJ to estimate leaf perimeter and leaf area. An index of leaf dissection (DI) was calculated by Fourier transformation, where DI = perimeter / (2√(area*π)) (Kincaid & Schneider, 1983). DI values are unitless but reach a minimum of 1 for a perfect circle.Trichome density was calculated as the total number of
trichome counted on the upper part of hole-punched discs taken from along the central vein of each leaf, divided by the total disc area (24.15 mm2). Because leaf dissection and trichome density were assessed on two leaves, we averaged the two measures by plant prior to analysis.
Stomata density per mg dry weight and average stomata length were estimated from one leaf per plant. On each harvested leaf, a small portion was cut from the middle of the leaf, next to the central vein. The abaxial side of the leaf fragment was immediately glued to a microscope slide (Thermo Scientific, USA) using liquid adhesive (Ulrich SA, Switzerland) and the leaf epidermis was removed, leaving 1 µm thickness of clear cuticle glued to the slide. We photographed cuticle impressions and counted stomata on a surface of 0.206 mm2 using ImageJ. Stomata density was expressed relative to a unit of dry leaf mass, measured from leaf discs dried for 24 h in an oven at 60°C. Average stomata length was obtained by measuring the distance in micrometers between the guard-cell junctions, averaged over eight stomata (Maherali et al., 2002).
We calculated flowering time (FT) as the number of days between germination and the appearance of the first open flower. FT was assessed every 1-3 days throughout the flowering period. The 21 individuals that did not flower by the end of the experiment, 262 days after planting, were counted as having flowered 20 days later.
Statistical Analysis
Trait differences between microhabitat and treatment. Genetic differences between
habitats and treatment effects were tested using general linear models in SAS (PROC GLM, SAS Institute Inc., 2002). Two traits measured before applying treatments, seed
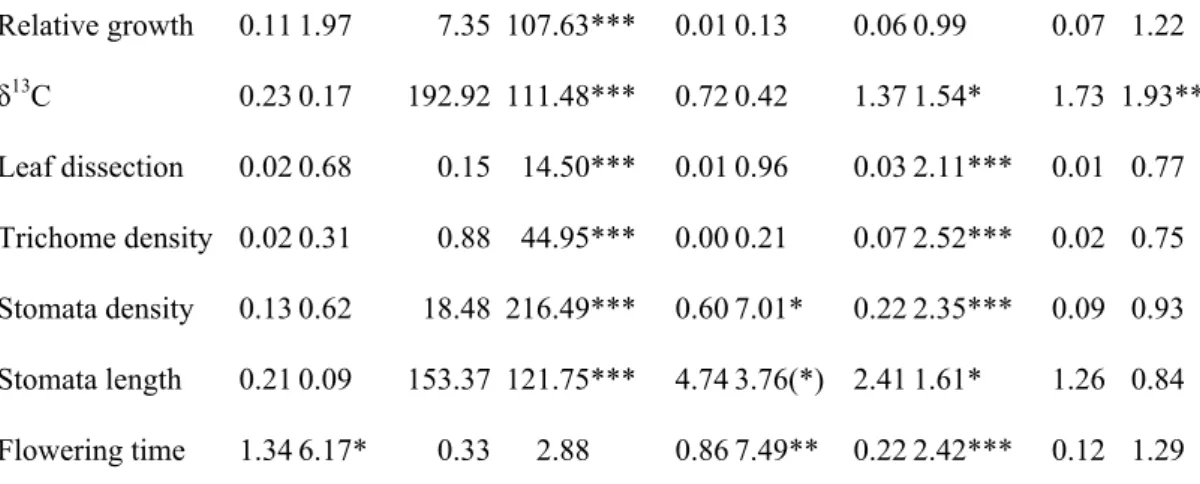
size and mean number of days to germination within a pot, were analyzed with a model testing effects of microhabitat (error term: family within habitat) and family nested within microhabitat. All other traits were analyzed in a multivariate analysis of variance that included microhabitat of origin, family nested within microhabitat, and treatment (error terms reported in Table 1). To improve the distribution of residuals, relative growth, leaf dissection, trichome density, stomata density and flowering time were ln-transformed. Days-to-germination was corrected for spatial block prior to analysis using general linear models, while all other traits were corrected for the effects of days to germination and block, separately for the two watering treatments.
G-matrix comparison. Before genetic variance-covariance matrices were
calculated, all traits were standardized to a mean of 0 and a standard deviation of 1 in order to correct for scalar differences. Broad-sense G-matrices were estimated for each of the four habitat-by-treatment combinations using the following mixed-effects model: Yijk = µ + Fi + Ij(i) + εijk
where the grand mean (µ) is a fixed effect and maternal family (F) and individual (I) nested within family were random effects (Dmitriew et al., 2010). Variance components were estimated by Baysian analysis with the MCMCglmm package of R v2.15.2 (R Development Core Team, 2011; Hadfield, 2010; script in Appendix S2). Total number of iterations was set to 100’000, burn-in to 2’000 and thinning to 40. Priors for G-matrices were taken from a mixed model analysis based on restricted maximum likelihood (lme4 package of R; Bates et al., 2011) with a moderate degree of freedom parameter. We used DIC values to evaluate the importance of broad-sense genetic variances and covariances in explaining phenotypic variation, in each case comparing two models with and without
the variance components of interest. Three models were involved: one with the full G-matrix, one without covariances among traits, and one with neither covariances nor genetic variances at the level of family. MCMC settings were the same as mentioned above.
We implemented three approaches for comparing G-matrices. The first two compared the G-matrix estimated from the whole population with the two matrices estimated from the separate microhabitats. This process was repeated for each of the two treatments. The question was whether microhabitat adaptation expands the dimensionality of genetic variation in the population. First, Bartlett’s test – based on a comparison of the discriminants – asked whether the size of the G-matrix was greater in the whole population (Goodnight & Schwartz, 1997; Roff et al., 2012). Second, we used Kirkpatrick’s (2009: eqn. 2) measure of the effective number of dimensions of the G-matrix to assess the impact of microhabitat adaptation on multivariate variation and genetic correlations. Finally, we estimated the angles between all four combinations of G-matrices (two microhabitats, two treatments) in a two-dimensional subspace using Krzanowski's (1979) test. Significance of all three comparisons was revealed by randomly re-sampling individual plants, estimating the G-matrices and re-calculating test statistics 500 times. G-matrices of resampled data were calculated based on 30’000 iterations, a burn-in of 1000 and thinning of 25. Priors for G-matrices were taken from a mixed model analysis based on restricted maximum likelihood.
Results
Differences between microhabitats and treatments. Seed size did not differ between the
two habitat types (P > 0.8) but significantly varied among families within habitat type (N = 523, F42,479 = 20.04, P < 0.0001). Similarly, timing of germination did not differ between the two habitat types (P > 0.7), but significantly varied among families within habitat type (N = 263, F42,219 = 2.66, P < 0.0001). The MANOVA revealed a very strong overall treatment effect, reflecting substantial phenotypic plasticity in response to drought (Table 1). Under dry conditions, plants grew less, had larger δ13C values, less dissected leaves, more trichome per leaf surface area, more stomata per dry leaf matter and shorter stomata (Fig. 2). The less negative δ13C values imply less discrimination against 13CO2 and therefore higher water-use efficiency. The only trait that did not significantly differ between treatments was flowering time. There was no habitat effect across treatments, but MANOVA detected a significant interaction between habitat and treatment, caused mostly by flowering time (Table 1). Dune-bottom plants flowered about five weeks earlier than those from the dune tops in the control treatment but they flowered at the same time in the dry treatment (Fig. 1B, Fig. 2G). Also, plants from the bottom of dunes had fewer stomata per unit dry matter in the wet treatment (Fig. 2E) and the length of the stomata tended to be shorter under dry conditions (Fig. 2F). Separate analyses also revealed significant variation among families for all traits except growth rate, and no family-by-treatment interactions except for δ13C.
G-matrix comparisons. There were considerable genetic variances and
covariances among traits in most of the four habitat-treatment combinations (estimates in Appendix S3). The first component of principal component analyses on the G-matrices
explained 37-46% of the variation; the second principal components explained 24-30% of the variation (Appendix S4). Comparison between a model with no genetic variances-covariances and one with only variances among families (diagonal elements of the G-matrix), respectively, supported the importance of broad-sense genetic variances (bottom-dry: DIC = 1016.7/987.1, top-(bottom-dry: DIC = 1023.0/981.0; bottom-control: DIC = 1036.2/1000.6; top-control, DIC = 1139.6/1096.2; a lower DIC-value indicates that the model is better at explaining variation). The comparison between models without and with the off-diagonal elements that represent covariances among traits revealed that covariance terms contributed considerably to explain variation (bottom-dry: DIC = 987.1/971.8, dry: DIC = 981.0/967.7; bottom-control: DIC = 1000.6/985.6; top-control, DIC = 1096.2/1086.0).
There was no evidence that habitat heterogeneity expanded the size of the pooled-family G-matrix (Table 2). Bartlett’s statistic was never significantly larger in the total population than in the separate microhabitats. However, habitat heterogeneity increased the dimensionality of the pooled-family G-matrix in the wet but not the dry treatment (Table 2). In the wet treatment, the effective number of dimensions was higher in the total population than in the separate microhabitats. Kirkpatrick’s (2009) effective number of dimensions were low (between 2 and 3), confirming the presence of some considerable genetic covariances among traits. Krzanowski’s comparison of subspaces revealed angles of only 10-20° for subspace 1, but a much larger 50-80° for subspace 2. These values were neither greater nor smaller than angles expected at random (Table 2).
Discussion
This study discovered small-scale microhabitat adaptation in Arabidopsis lyrata in a heterogeneous sand-dune landscape. Time from germination to flowering was the trait that showed the strongest differentiation between plants derived from open dune tops and forested dune bottoms, but only under control conditions (Fig. 1B, Fig. 2G). Stomata density and stomata length also somewhat differed between microhabitats depending on treatment (Fig. 2E, F). Our test of the association between microhabitat adaptation and maintenance of genetic variation in quantitative traits revealed mixed results. A first measure of genetic variation – the overall “size” of the genetic variance-covariance (G-) matrix – did not become larger when the families from dune tops and bottoms were pooled. However, a second measure of genetic variation –the effective number of dimensions of the G-matrix – was larger for pooled families than for the two microhabitats in the wet treatment, where flowering time strongly differed. Furthermore, the correlation structure of G-matrices did not significantly vary between microhabitats. Thus, habitat heterogeneity and multivariate selection only weakly impacted evolutionary potential, and not by simply increasing variances.
Our finding of local differentiation between dune tops and bottoms is unusual in two respects. First, it occurred over the relatively fine spatial scale of about 20 m. Empirical studies often report population divergence and local adaptation in plants but the scale of comparison is usually regional or geographic rather than local (Leimu & Fischer, 2008). Local adaptation in plants can occur over short distances if selection varies sharply across a distinct microhabitat boundary, such as when plants adapt to heavy metals at mine boundaries, to roadsides, edaphic heterogeneity on serpentine soils,
or dune position (e.g., Antonovics & Bradshaw, 1970; Wu & Antonovics, 1976; Knight & Miller, 2004; Baythavong et al., 2009). Second, the magnitude of micro-habitat divergence in flowering time – a five week difference in the control treatment – is considerably larger than that observed in European A. lyrata over a latitudinal cline of 14° (Riihimäki & Savolainen, 2004). In our study this difference amounted to a shift in flowering time of 6 broad-sense-genotypic standard deviations.
The common garden experiment demonstrated that plants differ between microhabitats, but did not demonstrate which environmental features are responsible for divergence. Although the two microhabitats differ substantially in soil moisture (Leege & Murphy, 2001), divergence in this case may not be caused by water stress because plants from both habitats were about equally water-use efficient (judging from δ13C) and had similar growth rates. A more likely factor is canopy cover, which may have imposed selection on plants from the shadier dune bottoms to use lower cue thresholds to initiate flowering under high water availability. Donohue et al. (2000) also observed selection for earlier flowering under shaded conditions. Of course other environmental factors that vary over larger spatial scales are also known to favor early flowering in plants, including high altitude (Hall & Willis, 2006), high latitude (Riihimäki & Savolainen, 2004; Griffith & Watson, 2005) and mowing (Reisch & Poschlod, 2011). Curiously, dry conditions can select for either earlier or later flowering, depending on whether the plant tolerates or avoids drought (Geber & Dawson, 1997; McKay et al., 2003; Juenger et al., 2005; Franks
et al., 2007).
Our sampling design produced broad-sense estimates of genetic differentiation, which potentially confound genetic differences with maternal effects. In this case,
though, maternal environmental effects were probably small because there was no microhabitat difference in the early-life traits that are commonly associated with maternal effects, such as seed size and timing of germination. In fact, genetic divergence of established plants in the field could be even stronger because the offspring assessed here were the product of some gene flow and had not yet been subjected to selection.
Habitat heterogeneity in space has been suggested to help maintain genetic diversity within populations (Barton & Turelli, 1989) although there is now conflicting evidence from experimental evolution studies. Mackay (1981) investigated the effect of a spatially varying environment and found a moderate positive effect on additive genetic variance in bristle traits and body size of Drosophila. Yeaman et al. (2010) manipulated the degree of migration in addition to spatial heterogeneity, and found no changes in additive genetic variance or heritability in wing traits and size. García-Dorado et al. (1991) manipulated the environmental grain within Drosophila cages, and found mixed results in the heritability of sternopleural bristle numbers. These experiments had good power to detect differences if there were any, which suggests that increases in quantitative genetic variation were not very important. Our approach was quite different – comparing the configuration of G-matrices estimated for the entire population with that estimated from families in only one habitat type – but the outcome confirmed that the overall quantity of genetic variation was not affected by microhabitat divergence.
However, the quantity of genetic variation is not the only consideration; diverse patterns of covariance in different microhabitats is another level at which habitat heterogeneity could contribute to maintaining diversity in a population. Broad sense G-matrices showed that the seven traits, even though they represent quite different
functional aspects, harbored considerable genetic correlations, such that the number of effective trait dimensions was around 2-3 for all habitat-treatment combinations although 7 traits were assessed. The measure of effective number of dimensions of a G-matrix is strongly influenced by genetic correlations, and it was larger for pooled families than for the two microhabitats depending on treatment. A further comparison of the G-matrix structure showed that although angles between subspaces did not deviate from random, they were also not more similar than random. Depending on the orientation of selection within the two microhabitats, the different directions of trait correlations may slightly facilitate adaptive evolution because of more overall diversity in G-matrix structure.
The structure of G-matrices did not significantly differ among treatments even though dry versus wet conditions in the experiment had a strong effect on most of the traits. Subspace analysis revealed a small shared angle between the first subspaces between habitats and treatments. The similarity across habitat type may not surprise because of regular gene flow, but the similarity across treatments is stunning as we found strong plastic responses to treatment for six of the seven traits assessed in directions generally considered adaptive. Under drought, A. lyrata plants had higher trichome density, higher density of stomata per dry weight, shorter stomata, higher δ13C and less dissected leaves (Fig. 2). Higher trichome density reduces leaf contact with the air, high stomata density allows for rapid CO2 diffusion into the leaf and small stomata can close faster, all leading to less water loss under drought (Hetherington & Woodward, 2003; Picotte et al., 2009). Increased δ13C values result from the less selective use of carbon isotopes and the minimizing of stomata opening (Farquhar et al., 1989). Only the smaller DI values observed under dry conditions seemed maladaptive as increased lobbing is
thought to lower leaf temperature (Nicotra et al., 2011). The fact that first subspaces had small angles despite large plastic differences between treatments suggests that multi-trait evolvability of the population is to a substantial extent environment-insensitive. In line, G-matrices based on morphological and performance traits of another drought tolerant plant, Avena barbata, subjected to the same two treatments showed high similarity (Sherrard et al., 2009).
Our results illustrate that heterogeneous environments combined with restricted gene flow can lead to microhabitat adaptation over small spatial scales. In A. lyrata, flowering time plays an important role in microhabitat adaptation. The response to heterogeneous selection seems to be multivariate, either as a direct consequence of selection or as an indirect consequence due to genetic correlations. Our results show that environmental heterogeneity combines with the multivariate response to selection to somewhat weaken trait integration within the population, without actually increasing genetic variances for individual traits. We suggest that the maintenance of quantitative genetic variation should include properties of the G-matrix and changes in genetic correlations.
Acknowledgements
We thank Josh Van Buskirk for help with G-matrix comparisons and comments on the manuscript. We thank the UNH Stable Isotope Laboratory for analyzing our samples. The collection permit was granted by the Michigan Department of Natural Resources. Support came from the Swiss National Science Foundation (PP00P3-123396/1) and the Fondation Pierre Mercier pour la Science.
Literature cited
Antonovics, J. & Bradshaw, A.D. 1970. Evolution in closely adjacent plant populations. VIII. Clinal patterns at a mine boundary. Heredity 25: 349–362.
Arnold, S.J. 1992. Constraints on phenotypic evolution. Am. Nat. 140: S85–S107.
Arnold, S.J., Bürger, R., Hohenlohe, P.A., Ajie, B.C. & Jones, A.G. 2008. Understanding the evolution and stability of the G-matrix. Evolution 62: 2451–2461.
Barton, N.H. 1990. Pleiotropic models of quantitative variation. Genetics 124: 773–782. Barton, N.H. & Turelli, M. 1989. Evolutionary quantitative genetics: How little do we
know? Annu. Rev. Genet. 23: 337–370.
Bates, D., Maechler, M. & Bolker B. 2011. Lme4: linear mixed-effects models using the S4 classes. R package version 0.999999-0. In. cran.r-project.org.
Baythavong, B.S., Stanton, M.L., Rice, K.J. 2009. Understanding the consequences of seed dispersal in a heterogeneous environment. Ecology 90: 2118–2128.
Bégin, M. & Roff, D.A. 2001. An analysis of G matrix variation in two closely related cricket species, Gryllus firmus and G. pennsylvanicus. J. Evol. Biol. 14: 1–13. Bulmer, M.G. 1972. Multiple niche polymorphism. Am. Nat. 106: 254–257.
Bürger, R. 2010. Evolution and polymorphism in the multilocus Levene model with no or weak epistasis. Theor. Pop. Biol. 78: 123–138.
Byers, D.L. 2005. Evolution in heterogeneous environments and the potential of maintenance of genetic variation in traits of adaptive significance. Genetica 123: 107–124.
Dmitriew, C., Blows, M.W. & Rowe, L. 2010. Ontogenetic change in genetic variance in size depends on growth environment. Am. Nat. 175: 640–649.
Donohue, K., Messiqua, D., Pyle, E.H., Heschel, M.S. & Schmitt, J. 2000. Evidence of adaptive divergence in plasticity: density- and site-dependent selection on shade-avoidance responses in Impatiens capensis. Evolution 54: 1956–1968.
Etterson, J.R. & Shaw, R.G. 2001. Constraint to adaptive evolution in response to global warming. Science 294: 151–154.
Falconer, D.S. & Mackay, T.F.C. 1996. Introduction to Quantitative Genetics (4th ed). Addison Wesley Longman, Harlow, U.K.
Farquhar, G.D. & Richards, R.A. 1984. Isotopic composition of plant carbon correlates with water-use efficiency of wheat genotypes. Aust. J. Plant Physiol. 11: 539– 552.
Farquhar, G.D, Ehleringer J.R. & Hubick K.T. 1989. Carbon isotope discrimination and photosynthesis. Annu. Rev. Plant Phys. 40: 503–537.
Franks, S.J. & Weis, A.E. 2008. A change in climate causes rapid evolution of multiple life-history traits and their interactions in an annual plant. J. Evol. Biol. 21: 1321– 1334.
Franks, S.J., Sim, S. & Weis, A.E. 2007. Rapid evolution of flowering time by an annual plant in response to a climate fluctuation. Proc. Natl. Acad. Sci. USA 104: 1278– 1282.
García-Dorado, A., Martin, P. & García, N. 1991. Soft selection and quantitative genetic variation: a laboratory experiment. Heredity 66: 313–323.
Geber, M.A. & Dawson, T.E. 1990. Genetic variation in and covariation between leaf gas exchange, morphology, and development in Polygonum arenastrum, an annual plant. Oecologia 85: 153–158.
Goodnight, C.J. & Schwartz, J.M. 1997. A bootstrap comparison of genetic covariance matrices. Biometrics 53: 1026–1039.
Griffith, T.M. & Watson, M.A. 2005. Stress avoidance in a common annual: reproductive timing is important for local adaptation and geographic distribution. J. Evol. Biol.
18: 1601–1612.
Hadfield, J.D. 2010. MCMC methods for multi-response generalized linear mixed models: the MCMCglmm R package. J. Stat. Software 33: 1–22.
Hall, M.C. & Willis, J.H. 2006. Divergent selection on flowering time contributes to local adaptation in Mimulus guttatus populations. Evolution 60: 2466–2477.
Hetherington, A.M. & Woodward, F.I. 2003. The role of stomata in sensing and driving environmental change. Nature 424: 901–908.
Johnson, T. & Barton, N. 2005. Theoretical models of selection and mutation on quantitative traits. Phil. Trans. R. Soc. B 360: 1411–1425.
Juenger, T.E., McKay, J.K., Hausmann, N., Keurentjes, J.J.B., Sen, S., Stowe, K.A., Dawson, T.E., Simms, E.L. & Richards, J.H. 2005. Identification and characterization of QTL underlying whole-plant physiology in Arabidopsis
thaliana: δ13C, stomatal conductance and transpiration efficiency. Plant Cell Environ. 28: 697–708.
Kincaid, D.T. & Schneider, R.B. 1983. Quantification of leaf shape with a microcomputer and Fourier transform. Can. J. Bot-Rev. Can. Bot. 61: 2333–2342. Kirkpatrick, M. 2009. Patterns of quantitative genetic variation in multiple dimensions.
Genetica 136: 271–284.
Kirkpatrick, M. & Barton, N.H. 1997. Evolution of a species' range. Am. Nat. 150: 1–23. Knight, T.M. & Miller, T.E. 2004. Local adaptation within a population of Hydrocotyle
bonariensis. Evol. Ecol. Res. 6: 103–114.
Krzanowski, W.J. 1979. Between-groups comparison of principal components. J. Am.
Stat. Assoc. 74: 703–707.
Lande, R. 1979. Quantitative genetic analysis of multivariate evolution, applied to brain: body size allometry. Evolution 33: 402–416.
Leimu, R. & Fischer, M. 2008. A meta-analysis of local adaptation in plants. PLoS ONE
3: e4010.
Lenormand, T. 2002. Gene flow and the limits to natural selection. Trends Ecol. Evol. 17: 183–189.
Leege, L.M. & Murphy, P.G. 2001. Ecological effects of the non-native Pinus nigra on sand dune communities. Can. J. Bot. 79: 429–437.
Mackay, T.F.C. 1981. Genetic variation in varying environments. Genet. Res. 37: 79–93. Maherali, H., Reid, C.D., Polley, H.W., Johnson, H.B. & Jackson, R.B. 2002. Stomatal
acclimation over a subambient to elevated CO2 gradient in a C3/C4 grassland. Plant Cell Environ. 25: 557–566.
McKay, J.K., Richards, J.H. & Mitchell-Olds, T. 2003. Genetics of drought adaptation in
Arabidopsis thaliana: I. Pleiotropy contributes to genetic correlations among
ecological traits. Mol. Ecol. 12: 1137–1151.
Mojica, J.P., Lee, Y.W., Willis, J.H. & Kelly, J.K. 2012. Spatially and temporally varying selection on intrapopulation quantitative trait loci for a life history trade-off in
Mimulus guttatus. Mol. Ecol. 21: 3718–3728.
Nicotra, A.B., Leigh, A., Boyce, C.K., Jones, C.S., Niklas, K.J., Royer, D.L. & Tsukaya, H. 2011. The evolution and functional significance of leaf shape in theangiosperms. Func. Plant Biol. 38: 535–552.
Picotte, J.J., Rhode, J.M. & Cruzan, M.B. 2009. Leaf morphological responses to variation in water availability for plants in the Piriqueta caroliniana complex.Plant Ecol. 200: 267–275.
R Development Core Team. 2011. R: a language and environment for statisticalcomputing. In. R Foundation for Statistical Computing, Vienna, Austria. Rasband, W. 2010. ImageJ. http://rsb.info.nih.gov/ij/, National Institute of Mental Health,
Bethesda, Maryland, USA.
Reisch, C. & Poschlod, P. 2011. Morphology and phenology of Scabiosa columbaria from mown and grazed habitats – results of a simulation experiment. Flora 206: 887–891.
Riihimäki, M. & Savolainen, O. 2004. Environmental and genetic effects on flowering differences between northern and southern populations of Arabidopsis lyrata (Brassicaceae). Am. J. Bot. 91: 1036–1045.
Roff, D.A., Prokkola, J.M., Krams, I. & Rantala, M.J. 2012. There is more than one way to skin a G matrix. J. Evol. Biol. 25: 1113–1126
SAS Institute Inc 2002. SAS: version 9.2. In: Cary, NC, USA.
Schmitt, J. & Gamble, S.E. 1990. The effect of distance from the parental site on offspring performance and inbreeding depression in Impatiens capensis: a test of the local adaptatoin hypothesis. Evolution 44: 2022–2030.
Sherrard, M.E., Maherali, H. & Latta, R.G. 2009. Water stress alters the genetic architecture of functional traits associated with drought adaptation in Avena
barbata. Evolution 63: 702–715.
Spichtig, M. & Kawecki T.J. 2004. The maintenance (or not) of polygenic variation by soft selection in heterogeneous environments. Am. Nat. 164: 70–84.
Vekemans, X. & Hardy, O.J. 2004. New insights from fine-scale spatial genetic structure analyses in plant populations. Mol. Ecol. 13: 921–935.
Via, S. & Lande, R. 1985. Genotype-environment interaction and the evolution of phenotypic plasticity. Evolution 39: 505–522
Willi, Y. 2013. Mutational meltdown in selfing Arabidopsis lyrata. Evolution, in press. Willi, Y. & Määttänen, K. 2010. Evolutionary dynamics of mating system shifts in
Arabidopsis lyrata. J. Evol. Biol. 23: 2123–2131.
Willi, Y. & Määttänen, K. 2011. The relative importance of factors determining genetic drift: mating system, spatial genetic structure, habitat and census size in
Willi, Y., Griffin, P. & Van Buskirk, J. 2013. Drift load in populations of small size and low density. Heredity!110:!396–202.
Wright, J.W., Stanton, M.L. & Scherson, R. 2006. Local adaptation to serpentine and non-serpentine soils in Collinsia sparsiflora. Evol. Ecol. Res. 8: 1–21.
Wu, L. & Antonovics, J. 1976. Experimental ecological genetics in Plantago II. Lead tolerance in Plantago lanceolata and Cynodon dactylon from a roadside. Ecology
57: 205–208.
Yeaman, S., Chen, Y. & Whitlock, M.C. 2010. No effect of environmental heterogeneity on the maintenance of genetic variation in wing shape in Drosophila