doi: 10.3389/fnmol.2018.00262 Edited by: Oliver Stork, Universitätsklinikum Magdeburg, Germany Reviewed by: Michael J. Schmeisser, Universitätsklinikum Magdeburg, Germany Yuri Bozzi, University of Trento, Italy Laurence Goutebroze, Institut National de la Santé et de la Recherche Médicale (INSERM), France *Correspondence: Beat Schwaller [email protected] Received: 08 May 2018 Accepted: 12 July 2018 Published: 02 August 2018 Citation: Lauber E, Filice F and Schwaller B (2018) Dysregulation of Parvalbumin Expression in the Cntnap2−/− Mouse Model of Autism Spectrum Disorder. Front. Mol. Neurosci. 11:262. doi: 10.3389/fnmol.2018.00262
Dysregulation of Parvalbumin
Expression in the Cntnap2−/−
Mouse Model of Autism Spectrum
Disorder
Emanuel Lauber, Federica Filice and Beat Schwaller*
Anatomy Unit, Section of Medicine, University of Fribourg, Fribourg, Switzerland
Due to the complex and heterogeneous etiology of autism spectrum disorder (ASD), identification of convergent pathways and/or common molecular endpoints in the pathophysiological processes of ASD development are highly needed in order to facilitate treatment approaches targeted at the core symptoms. We recently reported on decreased expression of the Ca2+-binding protein parvalbumin (PV) in three well-characterized ASD mouse models, Shank1−/−, Shank3B−/− and in utero VPA-exposed mice. Moreover, PV-deficient mice (PV+/− and PV−/−) were found to show behavioral impairments and neuroanatomical changes closely resembling those frequently found in human ASD individuals. Here, we combined a stereology-based approach with molecular biology methods to assess changes in the subpopulation of PV-expressing (Pvalb) interneurons in the recently characterized contactin-associated protein-like 2 (Cntnap2−/−) knockout mouse model of ASD. The CNTNAP2 gene codes for a synaptic cell adhesion molecule involved in neurodevelopmental processes; mutations affecting the human CNTNAP2 locus are associated with human ASD core symptoms, in particular speech and language problems. We demonstrate that in Cntnap2−/− mice, no loss of Pvalb neurons is evident in ASD-associated brain regions including the striatum, somatosensory cortex (SSC) and medial prefrontal cortex (mPFC), shown by the unaltered number of Pvalb neurons ensheathed by VVA-positive perineuronal nets. However, the number of PV-immunoreactive (PV+) neurons and also
PV protein levels were decreased in the striatum of Cntnap2−/− mice indicating that PV expression levels in some striatal Pvalb neurons dropped below the detection limit, yet without a loss of Pvalb neurons. No changes in PV+ neuron numbers were detected in the cortical regions investigated and also cortical PV expression levels were unaltered. Considering that Cntnap2 shows high expression levels in the striatum during human and mouse embryonic development and that the cortico-striato-thalamic circuitry is important for speech and language development, alterations in striatal PV expression and associated (homeostatic) adaptations are likely to play an important role in Cntnap2−/− mice and, assumingly, in human ASD patients with known Cntnap2 mutations.
Keywords: parvalbumin interneurons, calcium-binding proteins, contactin-associated protein-like 2, autism spectrum disorder, hyperpolarization-activated cyclic nucleotide-gated channels, perineuronal nets
INTRODUCTION
The etiology of autism spectrum disorder (ASD) is highly complex and diverse. A combination of genetic, epigenetic and environmental factors is assumed to ultimately lead to the ASD phenotype characterized by impairments in social interaction and language/communication, and the presence of restricted or stereotyped patterns of behavior (Kleijer et al., 2014). The genetic architecture of ASD is extremely heterogeneous and difficult to apprehend. Common, rare, and de novo mutations are known to contribute to the genetic risk of ASD and the number of risk genes is steadily increasing (Bourgeron, 2015). Amongst the identified ASD risk genes, contactin-associated protein-like 2 (Cntnap2), coding for a synaptic cell adhesion molecule, is listed as a “strong candidate (2S)” in the Simons Foundation Autism Research Initiative database (SFARI)1. The CNTNAP2 gene is one of the largest genes in humans spanning 2.3 Mb of genomic DNA, thus with an increased probability of structural rearrangements such as copy number variations (CNVs), insertions or deletions, single nucleotide polymorphisms (SNPs), altered transcription factor binding and epigenetic modifications affecting the CNTNAP2 locus (Poot, 2015). Several studies identified CNVs, common and rare SNPs and/or polymorphisms in the CNTNAP2 locus associated with syndromic neurodevelopmental disorders such as cortical dysplasia-focal epilepsy (CDFE) syndrome (Strauss et al., 2006), Pitt-Hopkins syndrome (Zweier et al., 2009), Gilles de la Tourette syndrome (Belloso et al., 2007), intellectual disability (ID) (Mikhail et al., 2011), obsessive compulsive disorder (Verkerk et al., 2003), attention deficit hyperactivity disorder (ADHD) (Elia et al., 2010), schizophrenia (Friedman et al., 2008) and autism (Alarcon et al., 2008;
Arking et al., 2008). Although patients with CNTNAP2 mutations display a complex phenotype, most of these patients manifest autistic characteristics; language impairments such as dysarthric language, language delay or absent speech/language are particularly frequent (Rodenas-Cuadrado et al., 2014;
Penagarikano et al., 2015). Accordingly, Cntnap2−/− mice show impairments in social behavior and reduced vocalizations (Penagarikano et al., 2011; Brunner et al., 2015; Liska et al., 2017), deficits in learning and memory (Rendall et al., 2016) and epileptiform activity (Penagarikano et al., 2011;Thomas et al., 2016).
Due to the complex and heterogeneous etiology of ASD, major efforts are aimed to possibly identifying convergent pathways across different ASD mouse models in order to facilitate treatment approaches. One cell type, whose function is consistently impaired in different ASD mouse models (Wöhr et al., 2015) and post-mortem brains of human ASD patients (Hashemi et al., 2016) and thus representing a promising point-of-convergence with respect to ASD heterogeneity is a subset of GABAergic interneurons expressing parvalbumin (PV); hereafter termed Pvalb neurons. PV is a slow-onset Ca2+ buffer (more precisely described as a neuronal Ca2+ signal modulator) and a characteristic marker for fast-spiking 1https://gene.sfari.org
interneurons (FSI). The number of Pvalb neurons (solely based on PV immunohistochemistry) was reported to be decreased in the cortex, striatum and hippocampus of Cntnap2−/− mice compared to WT mice (Penagarikano et al., 2011). However, we have shown in several validated ASD mouse models that the previously described “loss” of Pvalb neurons is caused by the down-regulation of PV in some neurons below a detectable threshold, while the number of Pvalb neurons is unchanged (Filice et al., 2016;Lauber et al., 2016). This is of great functional importance and was consistently found in PV+/−, PV−/−, Shank1−/−, Shank3B−/− and in utero VPA-exposed mice (VPA) mice; the genetic ASD mouse models also listed in the SFARI database. Here we show that the number of Pvalb neurons, identified by Vicia Villosa Agglutinin-positive (VVA+
) perineuronal nets (PNN), is unchanged in Cntnap2−/− compared to WT mice in the somatosensory cortex, medial prefrontal cortex and striatum, three brain regions often implicated in ASD pathophysiology. However, decreased protein expression of PV was detected exclusively (selectively) in the striatum of Cntnap2−/− mice, as before in Shank3B−/− and VPA mice (Filice et al., 2016; Lauber et al., 2016), further supporting the hypothesis that PV down-regulation represents a common molecular endpoint across different ASD models. These findings thus closely link the Cntnap2−/− model with other previously validated ASD mouse models such asShank3B−/− and VPA mice.
MATERIALS AND METHODS
Animals
Mice were group-housed at the University of Fribourg, Switzerland, in temperature-controlled animal facilities (24◦
C, 12:12 h light/dark cycle). Mice had free access to water and were fed ad libitum. C57Bl/6J (WT), B6.129(Cg)-Cntnap2tm1Pele/J (Cntnap2−/−), B6.129-Shank3tm2Gfng/J (Shank3B−/−) mice were purchased from Jackson Laboratory (Bar Harbor, ME, United States). B6.Pvalbtm1Swal (PV−/−)
mice were generated by homologous recombination as described before (Schwaller et al., 1999). All strains were backcrossed to C57Bl/6J for more than ten generations and therefore considered congenic with C57Bl/6J. Thus, alterations at the level of morphology, biochemistry and molecular biology are assumed to be the result of genotypic differences and not related to mouse strain. Pups obtained from at least 3 different litters per group were used in order to exclude a litter bias. Mice were euthanized either with Esconarkon (300 mg/kg body weight; Streuli Pharma AG, Uznach, Switzerland) for subsequent perfusion, or by cerebral dislocation, if followed by dissection and isolation of selected brain regions. Only male mice participated in the experiments. All experiments were executed with the permission of the local animal care committee (Canton of Fribourg, Switzerland) and according to the present Swiss law and the European Communities Council Directive of 24 November 1986 (86/609/EEC).
Tissue Preparation and
Immunohistochemistry
Mice were anesthetized and perfused using 0.9% NaCl solution followed by 4% paraformaldehyde (PFA). Brains were removed and post-fixed in 4% PFA at RT for 24 h before they were transferred to 30% sucrose-TBS 0.1 M, pH 7.3 solution for cryopreservation at 4◦
C. After cryopreservation, brains were cut coronally in rostro-caudal direction using a freezing microtome (Frigomobil, Reichert-Jung, Vienna, Austria). Following stereological systematic random sampling principles, every sixth section was collected. Floating sections were then blocked for 1 h at RT in TBS 0.1 M, pH 7.3 containing 10% bovine serum albumin (BSA) and 0.4% Triton X-100. Afterward, sections were rinsed 3 times in TBS before being incubated using a PV antibody (anti-rabbit PV25, Swant, Marly, Switzerland) diluted 1:1000 and Vicia Villosa Agglutinin (biotinylated-VVA, Reactolab, Servion, Switzerland) at 10 µg/ml in TBS containing MgCl2, MnCl2, CaCl2 (final salt concentration:
0.1 mM each) for 16 h at 4◦
C. Next, sections were washed once in TBS and twice in Tris-HCl 0.1 M, pH 8.2 before incubation with the following antibodies: anti-rabbit Cy3-conjugated (diluted 1:200) and Cy2 streptavidin-Cy3-conjugated (diluted 1:200, Milan Analytic AG, Switzerland) in Tris-HCl for 2 h at RT protected from light. After rinsing, sections were stained with DAPI (diluted 1:1000; LuBio Science GmbH, Luzern, Switzerland) in PBS 0.1 M, pH 7.4. After final rinsing, sections were mounted and cover-slipped using Hydromount mounting medium (National Diagnostics, Atlanta, GA, United States).
Stereological Quantification and
Counting Criteria
A Stereo Investigator system (Version 11, MicroBrightField, Williston, VT, United States) coupled to a Zeiss Axioplan microscope carrying a motorized x-y stage (Ludl Electronic Products, Ltd, Hawthorne, NY, United States) and connected to a Hamamtsu Orca Camera was used. Estimation of the total number of PV-positive (PV+
) and Vicia Villosa Agglutinin-binding (VVA+
) cells in pre-defined brain regions of interest (ROIs) was performed using the optical fractionator method (West et al., 1991) as described previously (Lauber et al., 2016). Stereotactic coordinates provided by the Paxinos and Franklin atlas (Paxinos, 2001) were used to define ROIs. The striatum (caudate-putamen) was defined at 1.10 to −0.82 mm from bregma, the SSC at 1.94 to −1.82 mm from bregma and the mPFC at 1.94 to 1.10 mm from bregma. Cell counting was performed on images obtained with the following objective lenses: 100x; NA = 1.40, oil immersion for the SSC; and 63x; NA = 1.30, oil immersion for the mPFC and striatum. The Cavalieri estimator (Gundersen et al., 1988) was used to estimate the total volume of the analyzed ROI. 6 WT mice and 5 Cntnap2−/− mice including pups obtained from at least three different litters per group were analyzed. All stereological parameters and results are reported in Tables 1, 2, respectively.
PV+
and VVA+
cells were quantified independently and according to the following criteria: (1) presence of a DAPI-stained nucleus; (2) well-defined and roundish perineuronal net (PNN) for VVA+
cells; (3) nucleus-surrounding PV staining for PV+
TABLE 1 | Stereological sampling parameters.
Brain region Cutting plane No. of sections Section evaluation interval (µm) Height of disector (µm) Guard zone (µm) Counting frame area (µm) Sampling grid area (µm) Measured section thickness mean (µm) Cavalieri grid size (µm) Striatum coronal 6–7 6 20.0 0.5 110 × 90 350 × 350 21.61 150 × 150 SSC coronal 14–15 6 20.0 0.5 70 × 55 450 × 450 21.35 200 × 200 mPFC coronal 4 6 20.0 0.5 90 × 70 150 × 200 20.55 100 × 100
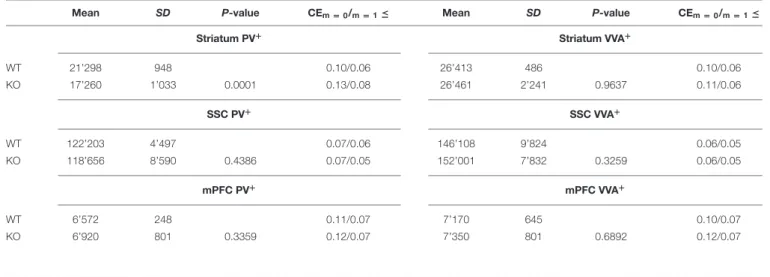
TABLE 2 | Mean total number of PV+and VVA+cells in the striatum, SSC and mPFC of WT and Cntnap2−/− mice.
Mean SD P-value CEm = 0/m = 1≤ Mean SD P-value CEm = 0/m = 1≤
Striatum PV+ Striatum VVA+ WT 21’298 948 0.10/0.06 26’413 486 0.10/0.06 KO 17’260 1’033 0.0001 0.13/0.08 26’461 2’241 0.9637 0.11/0.06 SSC PV+ SSC VVA+ WT 122’203 4’497 0.07/0.06 146’108 9’824 0.06/0.05 KO 118’656 8’590 0.4386 0.07/0.05 152’001 7’832 0.3259 0.06/0.05 mPFC PV+ mPFC VVA+ WT 6’572 248 0.11/0.07 7’170 645 0.10/0.07 KO 6’920 801 0.3359 0.12/0.07 7’350 801 0.6892 0.12/0.07
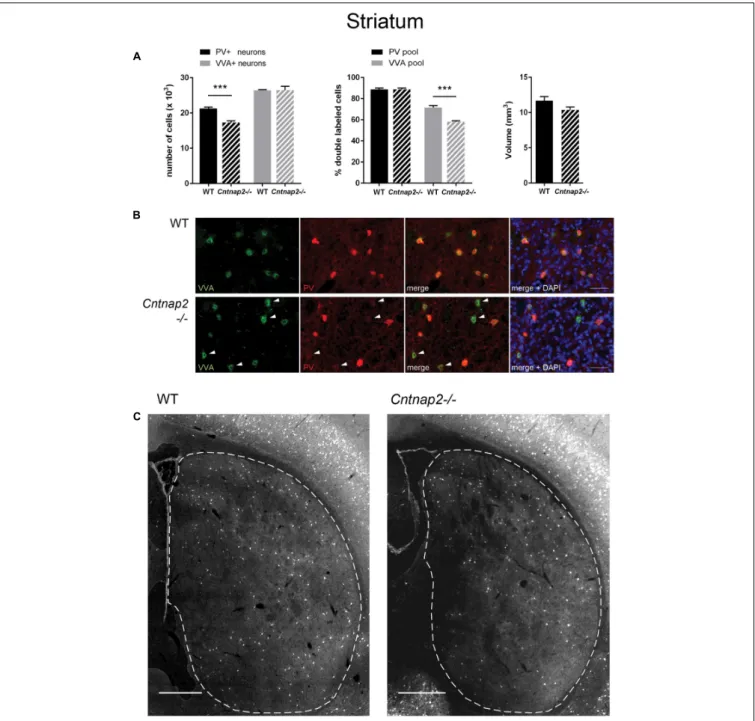
FIGURE 1 | (A) Left: Stereological estimations of PV+(black) and VVA+(gray) cells in the striatum of PND25 WT (N = 6) and Cntnap2−/− (N = 5) mice. Middle:
percentage of PV+ cells surrounded by VVA (black) and VVA+ cells showing PV expression (gray) in WT and KO mice. Right: Volume of the ROI; i.e., the striatum. Asterisks represent∗ ∗ ∗
P< 0.001. (B) Representative immunofluorescence images of PV (red) and VVA (green) co-localization from PND25 mouse striatum are shown. Less VVA+
cells are also positive for PV in Cntnap2−/− compared to WT mice (outlined by arrowheads). (C) Representative PV immunofluorescence images from the striatum of a WT and Cntnap2−/− mouse. ROIs are indicated with dashed lines (sections are located at Bregma 0.38 and 0.14 mm, respectively). Scale bar: (B) 50µm; (C) 500 µm. All data are expressed as mean ± SEM.
neurons. Examples are shown in Figure 1B. At every fifth sampling location, the section thickness was measured and the mean of all measurements was used for computations. The total number of cells (N) in a defined ROI was estimated as proposed byWest et al. (1991, 1996)using the formula:
N =XQ−×(1/ssf ) × (1/asf ) × (1/tsf )
where Q−
stands for “tops” (counts), and asf, tsf, and ssf for area sampling fraction, thickness sampling fraction and section sampling fraction, respectively. The coefficient of error CE was used to evaluate the precision of the estimates (Gundersen et al., 1999). CEs (m = 1 and m = 0) are provided in Table 2. To ensure independent and unbiased cell estimates, PV+
or VVA+
cells were quantified without cross-checking the other channel.
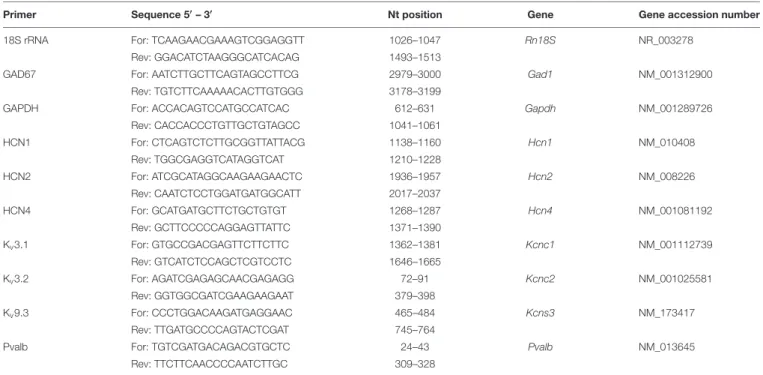
TABLE 3 | RT-qPCR primers.
Primer Sequence 50– 30 Nt position Gene Gene accession number
18S rRNA For: TCAAGAACGAAAGTCGGAGGTT 1026–1047 Rn18S NR_003278
Rev: GGACATCTAAGGGCATCACAG 1493–1513
GAD67 For: AATCTTGCTTCAGTAGCCTTCG 2979–3000 Gad1 NM_001312900
Rev: TGTCTTCAAAAACACTTGTGGG 3178–3199
GAPDH For: ACCACAGTCCATGCCATCAC 612–631 Gapdh NM_001289726
Rev: CACCACCCTGTTGCTGTAGCC 1041–1061 HCN1 For: CTCAGTCTCTTGCGGTTATTACG 1138–1160 Hcn1 NM_010408 Rev: TGGCGAGGTCATAGGTCAT 1210–1228 HCN2 For: ATCGCATAGGCAAGAAGAACTC 1936–1957 Hcn2 NM_008226 Rev: CAATCTCCTGGATGATGGCATT 2017–2037 HCN4 For: GCATGATGCTTCTGCTGTGT 1268–1287 Hcn4 NM_001081192 Rev: GCTTCCCCCAGGAGTTATTC 1371–1390 Kv3.1 For: GTGCCGACGAGTTCTTCTTC 1362–1381 Kcnc1 NM_001112739 Rev: GTCATCTCCAGCTCGTCCTC 1646–1665 Kv3.2 For: AGATCGAGAGCAACGAGAGG 72–91 Kcnc2 NM_001025581 Rev: GGTGGCGATCGAAGAAGAAT 379–398 Kv9.3 For: CCCTGGACAAGATGAGGAAC 465–484 Kcns3 NM_173417 Rev: TTGATGCCCCAGTACTCGAT 745–764
Pvalb For: TGTCGATGACAGACGTGCTC 24–43 Pvalb NM_013645
Rev: TTCTTCAACCCCAATCTTGC 309–328
RT-qPCR
After euthanasia by cervical dislocation, the whole brain of mice was quickly removed and put into ice-cold 0.9% NaCl solution for dissection. After cutting the brain in half along the midline, the cerebellum was removed. Next, the hippocampus followed by the striatum were dissected by carefully removing (pulling) the tissue pieces as described previously (see Figure S2 inLauber et al., 2016). Unlike in our previous studies, exclusively cortical tissue was obtained by removing the remaining parts of the brain such as thalamus and fiber tracts from the cortex. Tissue samples were separately snap-frozen using liquid nitrogen before storing them at −80◦
C. Since RNA is more prone to degradation, the left hemisphere of the brain was dissected first and afterward used for RT-qPCR analysis. RNA was extracted from tissue pieces with the peqGold TRIzol reagent (Peqlab, VWR International GmbH, Erlangen, Germany). Promega’s Reverse Transcription Kit (Promega, Dübendorf, Switzerland) was used to synthesize cDNA. RT-qPCR to examine mRNA expression levels forGapdh, Rn18S, Pvalb, Gad67, Hcn1, Hcn2, Hcn4, Kcnc1, Kcnc2, and Kcns3 genes was performed using the universal 2X KAPA SYBR FAST qPCR Master Mix (Axonlab AG, Mont-sur-Lausanne, Switzerland) and a DNA thermal cycler (Corbett Rotor gene 6000, QIAGEN Instruments AG, Hombrechtikon, Switzerland). Primer sequences and PCR products are reported in Table 3. After initial denaturation at 95◦
C for 3 min, a two-step protocol was run: 40 cycles comprising denaturation at 95◦
C for 3 s and annealing/extension/data acquisition between 54 and 60◦
C for 20 s. The housekeeping genes Gapdh (striatum) and Rn18S (18S rRNA) (cortex) were used to normalize the mRNA content for each sample. Finally, the 2− 11Ct
method was used to quantify mRNA levels and genes of interest were normalized to I) the housekeeping gene and II) the control, i.e.,
wild-type group as previously described (Livak and Schmittgen, 2001).
Western Blot Analysis
Tissue samples from the right hemispheres were sonicated and soluble proteins extracted for Western blotting. Proteins (30 µg/sample) were separated under denaturing conditions by SDS-PAGE (12.5%). Following gel electrophoresis, semi-dry transfer was performed to transfer proteins onto nitrocellulose membranes (MS solution, Chemie Brunschwig, Basel, Switzerland). The membranes were initially blocked at RT for 1 h in 5% BSA in TBS 0.1 M, pH 7.6 followed by incubation with primary antibodies: rabbit anti-PV25 (Swant, Marly, Switzerland), rabbit anti-GAPDH (Sigma-Aldrich, Buchs, Switzerland) both diluted 1:10,000 in TBS with 0.1% Tween (TBS-T) and 2% BSA overnight at 4◦
C. On the next day, membranes were rinsed 3 times with TBS-T before being incubated for 1 h at RT in the secondary antibody containing solution: goat anti-rabbit IgG HRP-conjugated (Sigma–Aldrich, Buchs, Switzerland) diluted 1:10,000 in TBS-T. Finally, membranes were washed 3 times with TBS before development using ECL (Merck Millipore, Schaffhausen, Switzerland). Image Studio Light Version 5.0 software was used to quantify visualized bands. GAPDH bands served as loading control on all membranes.
Statistical Analysis and Cell Number
Estimates
A two-tailed, unpairedt-test was used to compare stereological data, mRNA and protein levels between the two groups. Data were analyzed using the R version 3.3.3 software. Stereological data from the two hemispheres of the same
mouse were pooled and analyzed together. Ap-value< 0.05 was considered to be statistically significant.
RESULTS
Unaltered Numbers of Pvalb Neurons,
but Decreased PV Expression Levels in
the Striatum of Cntnap2−/− Mice
Unbiased stereological analysis of brain sections obtained from postnatal day (PND) 25 ± 1 control C57Bl/6J (WT) and Cntnap2−/− mice was aimed to obtain robust and precise cell number and volume estimates in different brain regions. The optical fractionator method and the Cavalieri estimator were used to quantify cell numbers and volumes in the striatum, somatosensory cortex (SSC) and medial prefrontal cortex (mPFC), three brain regions frequently implicated in ASD pathology. Coefficient of error (CE) values ranged from 0.05 to 0.11 for the WT group and from 0.05 to 0.13 for the Cntnap2−/− group; all stereological parameters and results are reported in Tables 1, 2, respectively. We independently quantified the number of parvalbumin-positive (PV+
) and Vicia Villosa Agglutinin-positive (VVA+
) cells in the same regions of interest as described before (Filice et al., 2016; Lauber et al., 2016). VVA recognizes N-acetylgalactosamine residues on the surface of perineuronal nets (PNN), which preferentially surround Pvalb neurons (Hartig et al., 1992; Haunso et al., 2000). Thus, Pvalb neurons with strongly decreased PV expression levels (i.e., below the detectable threshold) or even completely devoid of PV, may still be detected by the VVA+
staining as previously shown in PV+/− and PV−/− mice, respectively (Filice et al., 2016). In line with previous findings inCntnap2−/− mice that reported a ∼20– 25% decrease in the number of PV+
neurons in the striatum, cortex and hippocampus at PND14 (Penagarikano et al., 2011), we found a significant decrease in the order of 20% (p = 0.0001) in the total number of PV+
cells in the striatum of PND25 Cntnap2−/− mice compared to WT mice. Yet the total number of VVA+
cells was unchanged between the two genotypes, indicating that there was no loss of Pvalb neurons in the striatum ofCntnap2−/− mice (Figure 1A). This conclusion was confirmed by the percentage of double-positive cells. As observed in WT mice, ∼90% of PV+
cells were also VVA+
inCntnap2−/− mice; however, only ∼58% of cells out of the VVA pool were detected as PV+
cells in Cntnap2−/− mice (∼72% in WT), indicating that ∼15% (p = 0.0002) of VVA+
cells had “lost” their PV signal compared to WT mice (Figure 1A). Representative immunofluorescence images of VVA+
, PV+
and double-positive cells in the striatum are shown in Figures 1B,C, respectively. The VVA+
immunofluorescence images corresponding to Figure 1C are shown in Supplementary Figure 1. It is evident that while almost all VVA+
cells co-localized with PV+
cells in the WT group resulting in red-fluorescent cells with a “yellow rim,” several VVA+
cells were PV-immuno-negative (“green only”) in the striatum ofCntnap2−/− mice (Figure 1B). The mean volume of the striatum, as determined using the Cavalieri estimator, was unchanged between the two genotypes (Figure 1A).
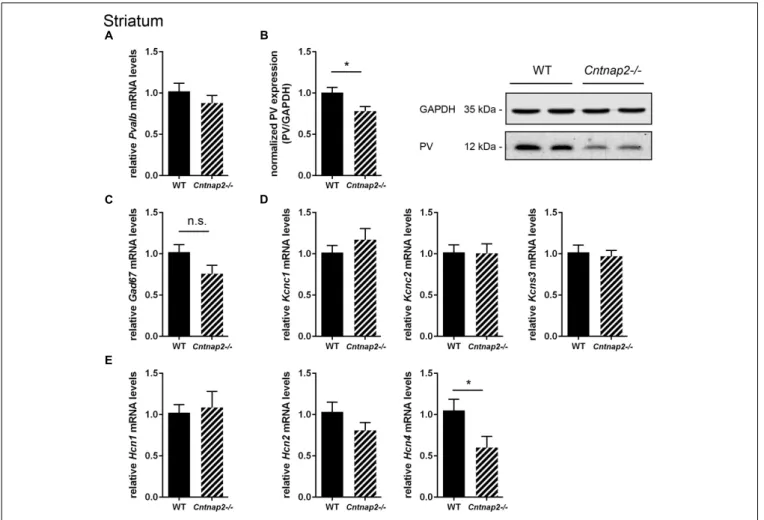
RT-qPCR and Western blot analysis of striatal tissue revealed changes in PV protein expression levels between WT and Cntnap2−/− mice. The trend toward a decrease in Pvalb mRNA levels in Cntnap2−/− mice measured by RT-qPCR did not reach statistical significance compared to WT samples (∼10%, p = 0.3190) (Figure 2A). But more importantly at the functional level and consistent with the stereological analysis, Western blot analysis of Cntnap2−/− striatal lysates revealed a ∼22% (p = 0.0219) decrease in PV protein levels compared to WT (Figure 2B; uncropped images of all Western blots are shown in Supplementary Figure 2). Representative protein Western blot signals for PV and GAPDH are shown in Figure 2B. Taken together, these results confirm that Cntnap2−/− mice exhibit striatal PV down-regulation during early post-natal development without any indication for Pvalb neuronal loss. The non-significant decrease inPvalb transcript levels hints toward a possible post-transcriptional regulation, unlike in the previously investigated ASD mouse models Shank3B−/− and VPA mice, where bothPvalb transcript and PV protein levels were decreased to a similar extent (Filice et al., 2016;Lauber et al., 2016).
To further support that the total number of striatal Pvalb neurons was unchanged between the two groups, mRNA levels for typical universal GABAergic interneuron markers and Pvalb neuron-specific markers were investigated. Glutamate decarboxylase isoform 67 (Gad67) mRNA levels were not significantly different between WT and Cntnap2−/− mice (Figure 2C). Of note, Gad67 is not exclusively expressed in Pvalb neurons, but also in other interneurons. Thus, additional Pvalb neuron-specific markers were analyzed including the potassium voltage-gated channels subfamily C member 1 (Kcnc1), the protein also known as Kv3.1 (Chow et al., 1999) and subfamily
S member 3 (Kcns3) coding for Kv9.3 (Georgiev et al., 2012).
Both potassium channel transcripts were found to be unaltered between WT andCntnap2−/− mice (Figure 2D). The same held true forKcnc2 (Kv3.2) (Figure 2D), the next closest relative of
Kcnc1, which also co-localizes with Pvalb neurons but to a lesser extent thanKcnc1 (Chow et al., 1999).
In an exploratory approach, we quantified mRNA levels for hyperpolarization-activated cyclic nucleotide-gated (HCN) channel isoforms 1, 2, and 4. HCN channel expression and/or the currents mediated by these channels (Ihcurrent) were previously
reported to be altered in cultured hippocampal neurons derived fromShank3−/− mice (Yi et al., 2016) and in VPA mice (Lauber et al., 2016), two validated mouse ASD models with a similar striatal PV deficit as the Cntnap2−/− mice. While Hcn1 and Hcn2 mRNA expression levels in Cntnap2−/− mice did not differ from transcript levels in WT mice in the striatum,Hcn4 mRNA levels were significantly decreased by ∼40% (p = 0.0418) in Cntnap2−/− mice (Figure 2E). The conceivable functional implications of these results are discussed below.
Lack of Cntnap2 Has No Effect on the
Number of Pvalb Neurons and PV
Expression in SSC and mPFC
Unlike previously reported byPenagarikano et al. (2011)and by
FIGURE 2 | RT-qPCR values from striatal samples of PND25 mice representing mRNA levels for (A) Pvalb, (C) Gad67, (D) Left: Kcnc1; Middle: Kcnc2; Right: Kcns3, (E) Left: Hcn1; Middle: Hcn2; Right: Hcn4. Signals were normalized to Gapdh mRNA levels and expressed as fold change compared to WT (N = 6 mice each). (B) Left: Quantitative Western blot analysis of striatal samples of PND25 WT and Cntnap2–/– mice (N = 6 mice each). Quantification of PV protein levels in the striatum is shown. Asterisks represent∗
P ≤ 0.05. GAPDH signals served as loading controls and were used for the normalization of PV protein signals. Results are expressed as a percentage of normalized PV/GAPDH signals in the WT group. Right: Representative Western blot signals for PV and GAPDH are shown. All data are expressed as mean ± SEM.
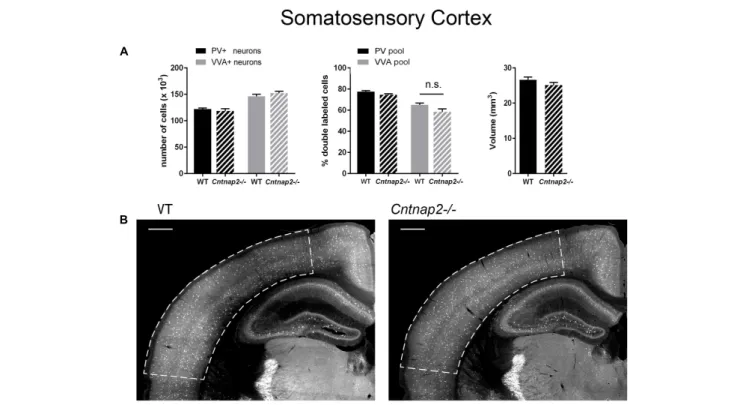
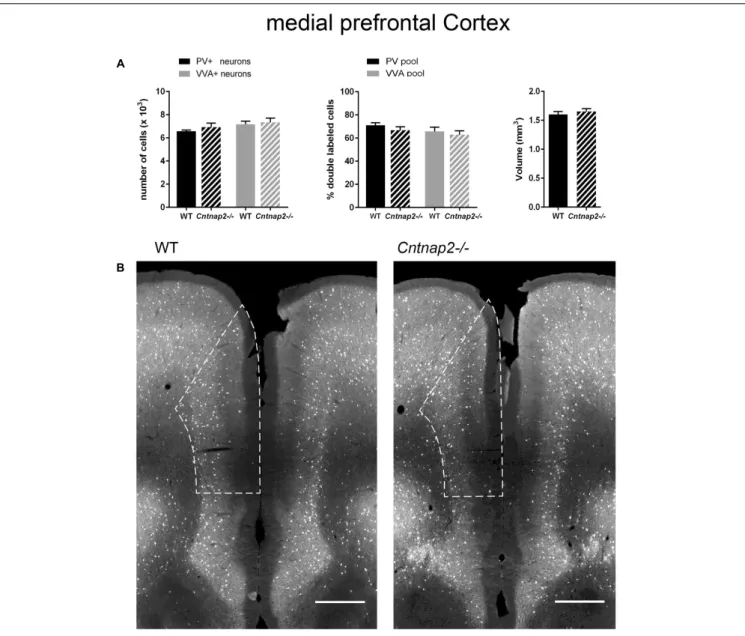
mice, respectively, we did not find Pvalb neuron-specific alterations in the cortex of the same mice at PND25. Neither were PV+
cell numbers altered in the SSC and mPFC, nor did we observe differences in the number of VVA+
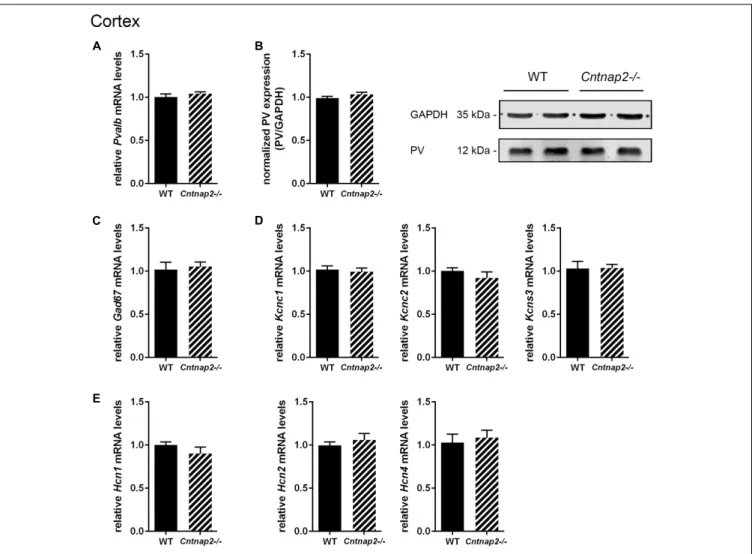
cells in the same brain regions (Figures 3A, 4A). Accordingly, the percentage of double-positive cells, in both directions (PV pool and VVA pool), was not significantly altered between WT and Cntnap2−/− mice in the SSC and mPFC (Figures 3A, 4A). The volumes of the SSC and mPFC were also similar between groups (Figures 3A, 4A). Representative immunofluorescence images of the SSC and mPFC are depicted in Figures 3B, 4B, respectively. In agreement with the unchanged numbers of Pvalb neurons, subsequent mRNA and protein quantification showed that Pvalb transcript and PV protein levels were essentially identical between WT andCntnap2−/− mice in cortical tissue obtained from male PND25 mice (Figures 5A,B). Similarly, PV protein levels in the hippocampus and cerebellum were not different between genotypes at PND25 (Supplementary Figure 3). RT-qPCR analysis of cortical tissue confirmed the
stereological findings. No alterations in the mRNA levels for Gad67, Kcnc1, Kcnc2, and Kcns3 were observed in cortical extracts from Cntnap2−/− mice at PND25 (Figures 5C,D). Concomitantly, mRNA levels for the three HCN family members were unchanged in the cortex ofCntnap2−/− mice (Figure 5E). We had previously reported about increasedHcn1 mRNA levels in the cortex of VPA mice, which might thus explain some of the electrophysiological deficits that have previously been found in this ASD model (Rinaldi et al., 2007, 2008;Lauber et al., 2016).
Unchanged Transcript Levels of Pvalb
Neuron Markers Kcnc1 and Kcns3, as
Well as Hcn Family Members in Adult
(PND70) Cntnap2−/− Mice
The role of Cntnap2 in the regulation and electrophysiological properties of Pvalb neurons had been investigated previously.
Vogt et al. (2017) had used a cell transplantation approach, where neurons from the medial ganglionic eminence (MGE)
FIGURE 3 | (A) Left: Stereological estimations of PV+(black) and VVA+(gray) cells in the SSC of PND25 WT (N = 6) and Cntnap2–/– (N = 5) mice. Middle:
percentage of PV+cells surrounded by VVA (black) and VVA+cells showing PV expression (gray) in WT and Cntnap2–/– mice. Right: Volume of the ROI; i.e., the
SSC. (B) Representative PV immunofluorescence images from the SSC of a WT and Cntnap2–/– mouse. ROIs are indicated with dashed lines (sections are located at Bregma –1.34 mm). Scale bar: 500µm. All data are expressed as mean ± SEM.
of E13.5 Cntnap2+/+, Cntnap2+/− and Cntnap2−/− mice were transplanted into the cortex of PND1 WT mice. These tdTomato-tagged neurons gave rise also to Pvalb neurons evidenced by their fast, non-accommodating firing properties. After 6–8 weeksin vivo, several electrophysiological parameters were found to be different, depending on whether the MGE-derived Pvalb neurons were from Cntnap2+/+ or Cntnap2−/− mice. In neurons from the latter, the resting membrane potential was more positive, the AP spike half-width increased, the maximum AP slope decreased, and also the input resistance was slightly increased; the authors had hypothesized that these changes might be caused by alterations in K+
and/or Na+
channels. Since changes related to K+
conductances had been observed in striatal neurons with reduced or absent PV expression (e.g., higher firing frequency, increased excitability, slower AHP recovery, more regular inter spike interval) (Bischop et al., 2012; Orduz et al., 2013), we performed Western blot analysis of cortical extracts obtained from adult mice (PND70 ± 1). However, we found no evidence for reduced PV levels in the cortex of PND70Cntnap2−/− mice (Supplementary Figures 4A,B), as we had also observed in PND25 mice (Figures 3–5). Moreover, no changes in mRNA levels forPvalb, Kcnc1 Kcns3, Hcn1 and Hcn4 were detected between WT and Cntnap2−/− mice in the cortex at PND70 (Supplementary Figures 4C,D). Of note, the previously reported differences were observed in the MGE-derived implanted neurons from WT and Cntnap2−/− mice and not between endogenous Pvalb neurons
from the two genotypes and might thus explain the apparent discrepancies (see also Discussion).
“Analogous” Changes in the Striatum of
Mouse ASD Models (Cntnap2−/−,
PV−/−, Shank3B−/−, VPA) May Hint
Toward Points of Convergence
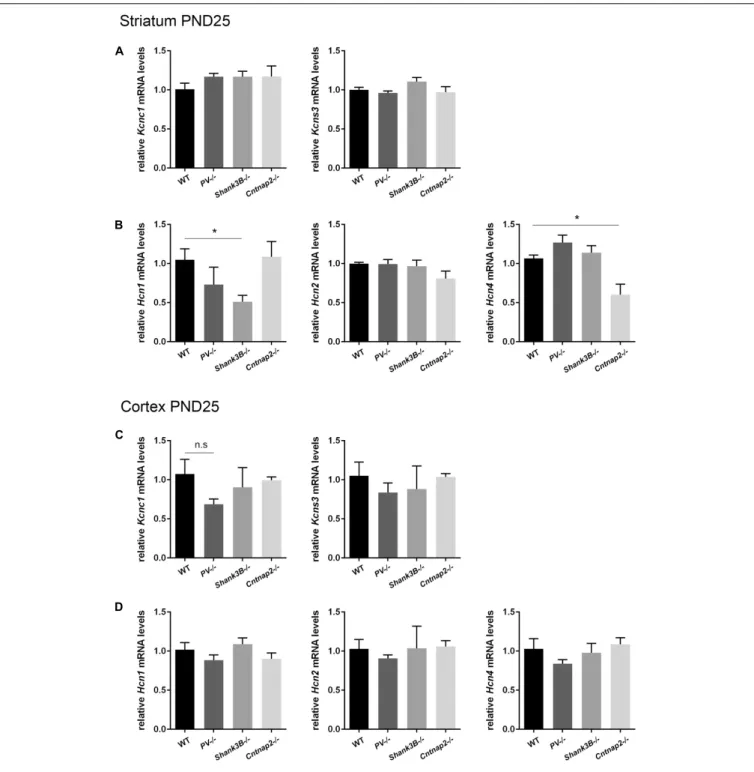
Based on the hypothesis that various genetic and environmental ASD mouse models might entail similar alterations in the expression levels of proteins present in Pvalb neurons and/or in Pvalb neuron networks, transcript levels of the selective Pvalb neuron markers Kcnc1 and Kcns3, and HCN family members (Hcn1, Hcn2, and Hcn4) in the striatum and cortex were quantified inPV−/− and Shank3B−/− mice and compared to results obtained inCntnap2−/− mice, the latter also shown in Figures 2D,E). WhileKcns3 transcript levels were unchanged in both brain regions ofPV−/−, Shank3B−/− and Cntnap2−/− mice compared to WT mice (Figures 6A,C) and thus supporting the previously drawn conclusion that there is no loss of Pvalb neurons in these ASD mouse models (Filice et al., 2016), there was a trend toward decreased expression ofKcnc1 in the cortex of PV−/− mice (p = 0.0885; Figure 6C). A similar down-regulation of Kcnc1 transcript and KV3.1 protein had been observed
before in the cortex of VPA-exposed mice (Lauber et al., 2016). mRNA levels for Hcn1, Hcn2 and Hcn4 were unchanged in the cortex of all 3 ASD models (Figure 6D). Levels forHcn2
FIGURE 4 | (A) Left: Stereological estimations of PV+
(black) and VVA+
(gray) cells in the mPFC of PND25 WT (N = 6) and Cntnap2–/– (N = 5) mice. Middle: percentage of PV+
cells surrounded by VVA (black) and VVA+
cells showing PV expression (gray) in WT and Cntnap2–/– mice. Right: Volume of the ROI; i.e., the mPFC. (B) Representative PV immunofluorescence images from the mPFC of a WT and Cntnap2–/– mouse. ROIs are indicated with dashed lines (sections are located at Bregma 1.70 mm). Scale bar: 500µm. All data are expressed as mean ± SEM.
were also similar in the striatum of all investigated models; howeverHcn1 expression levels were prominently decreased in Shank3B−/− mice (∼50%, p = 0.0113). Although Hcn1 signals were rather weak in the striatum, the finding of altered Hcn1 levels in Shank3B−/− mice is of interest, since Hcn-mediated Ih-channelopathy was previously suggested to be a main driver
for the ASD phenotype observed inShank3−/− mice (Yi et al., 2016) (see Discussion). In addition,Hcn4 transcript levels were significantly lower in the striatum ofCntnap2−/− compared to WT mice (Figure 6B). While decreases in transcript levels of Pvalb and Kcnc1 are in most cases also mirrored in lower protein expression levels (Filice et al., 2016; Lauber et al., 2016), it is currently unknown whether such a correlation also holds true for Hcn channels.
In summary, our results suggest that Pvalb-neuron numbers are not altered in the investigated cortical regions and moreover that global cortical PV expression levels in PND25 ± 1 Cntnap2−/− mice are unchanged. Yet in the striatum of Cntnap2-deficient mice, we found decreased PV protein expression levels. The implications of striatal PV down-regulation in the various ASD mouse models are discussed below.
DISCUSSION
The interest in PV-expressing (Pvalb) interneurons linked to neurodevelopmental disorders such as ASD and schizophrenia
FIGURE 5 | RT-qPCR values from cortical samples of PND25 mice representing mRNA levels for (A) Pvalb, (C) Gad67, (D) Left: Kcnc1; Middle: Kcnc2; Right: Kcns3,(E) Left: Hcn1; Middle: Hcn2; Right: Hcn4. Signals were normalized to Rn18S mRNA levels and expressed as fold change compared to WT (N = 6 mice each). (B) Left: Quantitative Western blot analysis of cortical samples of PND25 WT and Cntnap2–/– mice (N = 6 mice each). Quantification of PV protein levels in the cortex is shown. GAPDH signals served as loading controls and were used for the normalization of PV protein signals. Results are expressed as a percentage of normalized PV/GAPDH signals in the WT group. Right: Representative Western blot signals for PV and GAPDH are shown. All data are expressed as mean ± SEM.
has steadily grown over the past years. The number of PV+
neurons was reported to be decreased in human ASD patients (Hashemi et al., 2016) and several ASD mouse models (see Table 1 in Wöhr et al., 2015). In most cases, this decrease was assumed to be the result of partial Pvalb neuron loss. Noteworthy, RNA-seq and RT-qPCR analyses on post-mortem tissue samples of temporal and frontal cortex as well as cerebellum from 48 ASD patients and 49 healthy controls showed that the PVALB gene was in the group of most strongly down-regulated genes in the ASD group (Parikshak et al., 2016). So far, mutations in the PVALB gene have not been reported in human ASD patients. Nonetheless, mice with decreased or absent PV levels (PV+/− and PV−/−) show a strong behavioral ASD phenotype and moreover, ASD-associated neuroanatomical changes (Wöhr et al., 2015). These findings support the hypothesis that PV may represent a promising molecular target providing a common endpoint for at least some forms of ASD.
Here, we showed that the number of PV+
cells is reduced in the striatum ofCntnap2−/− mice at PND25 ± 1. The time point was chosen, since PV expression and the electrophysiological maturation of Pvalb neurons reach adult levels at this age (de Lecea et al., 1995; Okaty et al., 2009). Additionally, at this age, mice with reduced or absent PV levels (PV+/−, PV−/−) manifest an ASD-like behavioral phenotype (Wöhr et al., 2015;
Filice et al., 2018). The decrease in PV+
cells is the result of PV down-regulation and not due to a partial loss of Pvalb neurons, since the number of VVA+
cells serving as a proxy measure of striatal Pvalb neurons (Hartig et al., 1992) was unchanged between WT andCntnap2−/− mice. Also transcript levels for specific and well-described Pvalb neuron markers such as KV3.1
(Kcnc1) and KV9.3 (Kcns3) were unaltered in the striatum of
Cntnap2−/− mice. In order to understand the mechanisms and the functional consequences of Cntnap2-deficiency resulting in a behavioral ASD-like phenotype in mice, the distinction between Pvalb neuron lossvs. PV-downregulation is of utmost
FIGURE 6 | RT-qPCR values from striatal and cortical samples of WT, PV–/–, Shank3B–/–, and Cntnap2–/– PND25 mice representing mRNA levels for (A) and (C) Left: Kcnc1; Right: Kcns3, (B) and (D) Left: Hcn1; Middle: Hcn2; Right: Hcn4. Signals were normalized to Gapdh (striatum) or Rn18S (cortex) mRNA levels and expressed as fold change compared to WT (N = 5 mice each). All data are expressed as mean ± SEM.
relevance. A “simple” loss of inhibitory interneurons such as the Pvalb subtype is expected to result in a decrease of the inhibitory tone in the brain. In contrast, Pvalb neurons with decreased or absent PV expression were consistently found to exhibit enhanced short-term facilitation (Schwaller, 2012;Orduz et al., 2013), hence increasing the inhibitory tone. Recently, by using fiber photometry, unperturbed Pvalb neuronal activity in
the mPFC of freely moving Cntnap2−/− and WT mice was recorded, when mice were confronted with different social and non-social stimuli (Selimbeyoglu et al., 2017). Distinct activity patterns were observed in the two groups in response to the different stimuli, suggesting that the underlying neural dynamics of Pvalb neurons in the mPFC differed between genotypes. Additionally, expression of stabilized step-function opsin (SSFO)
in Pvalb neurons allowed to optogenetically increasing Pvalb neuron excitability in the mPFC, which rescued the social deficits prevailing inCntnap2−/− mice and was associated with reduced activity of cortico-striatal projections. This finding is in line with the hypothesis that reduced PV levels are another mean of enhancing the output of PV neurons in order to increase the inhibitory tone in the brain, according to the notion of homeostatic plasticity (Turrigiano, 2011). Interestingly, human patients carrying mutations affecting the CNTNAP2 locus and adult (>6 month) Cntnap2−/− mice display frequent and severe seizures (Strauss et al., 2006; Penagarikano et al., 2011), a state generally linked to an altered excitation/inhibition balance. Optogenetically enhancing Pvalb neuron excitability (i.e., enhancing inhibition) shown to rescue social deficits in Cntnap2−/− mice (Selimbeyoglu et al., 2017), might also have an effect on seizure severity, yet this remains to be proven experimentally. Of note, in PND25Cntnap2−/− mice, we found no indication of cortical PV down-regulation, thus cortical alterations in Pvalb neuron excitability –if present– may not be linked to PV expression; whereas the reduction of PV levels in striatal Pvalb neurons likely increases excitability as shown before in the same neuron population in PV−/− mice (Orduz et al., 2013). Striatal PV downregulation was found to be a common feature in several prototypical and well-established mouse ASD models. In addition to the present findings inCntnap2−/− mice, also in Shank3B−/− and in utero VPA-exposed mice, reduced PV levels (in the order of ∼25–50%) and unaltered numbers of Pvalb neurons were reported (Filice et al., 2016; Lauber et al., 2016). This suggests that in these ASD models, the striatum is a particularly susceptible region and that it might play an important role in the development/manifestation of ASD core symptoms in mice. The basal ganglia, where the striatum serves as input structure, have developed to a complex circuitry in higher vertebrates not only mediating motor output control, but also higher cognitive functions such as sensory processing, learning, and memory tasks as well as the generation of intentional and motivated behaviors in a reward-guided manner (Fuccillo, 2016). There is substantial clinical evidence that striatal dysfunction is associated with ASD. Several MRI studies reported about alterations in the volume of the caudate nucleus or putamen (Langen et al., 2007, 2014;Estes et al., 2011) and enhanced striatal connectivity in ASD patients compared to healthy controls (Di Martino et al., 2011). Abnormalities in striatal structure and function have moreover been described for several ASD mouse or rat models, including Shank3−/− mice (Peca et al., 2011; Jaramillo et al., 2016) and in utero VPA-exposed rats (Schneider et al., 2007). Recently, it was demonstrated that targeted depletion of PV-expressing fast-spiking interneurons (FSIs) and large cholinergic interneurons (CINs) specifically in the dorsal striatum of mice leads to spontaneous stereotypy and marked impairments in social interactions (Rapanelli et al., 2017). Currently, reports aboutCntnap2−/− mice in relation to ASD are still sparse. Cntnap2 is a member of the neurexin family of synaptic cell adhesion molecules involved in the clustering of K+ channels in myelinated axons (Poliak et al., 1999, 2003). However, since myelination takes place postnatally and Cntnap2 is strongly expressed during embryonic development, Cntnap2 is expected
to fulfill additional functions in early brain development. This assumption is reinforced by the rising number of reports linking mutations in theCNTNAP2 locus with ASD (Rodenas-Cuadrado et al., 2014). Three independent studies reported about reduced spine density in neurons derived from Cntnap2-deficient mice relative to controls, associated with a decrease in synaptic transmission (Anderson et al., 2012;Gdalyahu et al., 2015;Varea et al., 2015). Also perisomatic evoked IPSCs were found to be significantly reduced in hippocampal slices ofCntnap2−/− mice (Jurgensen and Castillo, 2015).
During human and mouse embryonic development, Cntnap2 shows enriched expression in the frontal lobe, striatum and thalamus (Abrahams et al., 2007;Alarcon et al., 2008). Within the cortex, Cntnap2 is particularly abundant in certain interneuron subpopulations: in chandelier cells and PV+
neurons, as well as in VIP (CR+
and CCK+
) cells (Vogt et al., 2017). The lack of Cntnap2 leads to a decrease in the number of PV+
neurons, which was interpreted as a defect in the differentiation and/or activity of Pvalb neurons resulting secondarily in decreased PV expression (Vogt et al., 2017) evidenced at PND14. In line, a delayed maturation of Pvalb neurons associated with impaired PV circuit function in ASD has been reported before, e.g., in Shank3−/− mice (Gogolla et al., 2014). As mentioned before, the cortico-striato-thalamic circuitry is crucially involved in higher order cognitive functions and Cntnap2 appears to be particularly important for language development, since most human patients with Cntnap2 mutations manifest some sort of language impairment (see Table 1 inPenagarikano et al., 2015). Compared to WT mice,Cntnap2−/− mice emit less ultrasonic vocalizations in the isolation-induced pup vocalization test (Penagarikano et al., 2011), as well as in response to the female urine stimulus (Brunner et al., 2015). Interestingly, Cntnap2 is also highly expressed within the cortico-striato-thalamic circuitry of the zebra finch songbird, a popular animal model for vocal learning (Panaitof et al., 2010). Lesioning of the lateral magnocellular nucleus of the anterior neostriatum in songbirds results in songs with monotonous repetitions of a single note complex (Scharff and Nottebohm, 1991), thus providing an additional connection between striatal Cntnap2 expression deficits and language-related impairments. Taken together, decreased/absent Cntnap2 expression and/or striatal impairments seem to be potent inducers of ASD core symptoms, with language dysfunction being particularly frequent in patients affected by mutations in the CNTNAP2 gene. The observed down-regulation of PV in the striatum of Cntnap2−/− mice may thus represent an adaptive mechanism to counteract reduced inhibition, as observed in the hippocampus of these mice (Jurgensen and Castillo, 2015), and thus keeping the excitation/inhibition balance within a correct physiological window.
Striatal PV down-regulation during early postnatal development does not seem to be the only similarity between Cntnap2−/− mice, Shank3B−/− and VPA-exposed mice. Using human and mouse neurons, Yi et al. (2016)demonstrated that mutations in Shank3 predispose to ASD possibly by inducing a severe Ih-channelopathy. Hyperpolarization-activated cation (Ih) currents, which are mediated by hyperpolarization-activated
cyclic nucleotide-gated (HCN) channels, regulate membrane resting potentials, input resistance, neuronal excitability and synaptic transmission (Biel et al., 2009). Neurons derived from Shank3−/− mice were found to exhibit severely decreased Ih currents and furthermore, decreased Hcn4 protein levels
in vitro (Yi et al., 2016). When quantifying mRNA levels of the Hcn isoforms 1, 2 and 4 in the cortex and striatum of Cntnap2−/− mice, we found reduced mRNA levels of Hcn4 exclusively in the striatum of Cntnap2−/− mice compared to WT animals, while mRNA levels of the other isoforms were unchanged in both brain regions. Therefore, putative impairments in Hcn-mediated Ihcurrents might also contribute
to the phenotype of Cntnap2−/− mice. Of note, the observed changes in striatal Hcn4 transcript levels are but a first hint toward possible alterations in the striatum of these mice. Whether Hcn4 protein levels are altered, in which neuron population and to which extend Ih currents are functionally
altered in Cntnap2−/− mice, remains to be thoroughly investigated.
In summary, we show that Cntnap2−/− mice display down-regulation of PV expression in the striatum, a brain structure with enriched Cntnap2 expression during early development and functional importance for higher cognitive functions in later life. Striatal PV down-regulation moreover seems to occur in various ASD mouse models including Cntnap2−/−, Shank3B−/−, in utero VPA-exposed (and evidentlyPV−/−) mice. Moreover, striatal PV down-regulation was associated with a decrease in Hcn isoform transcripts in Cntnap2−/− and Shank3B−/− mice, representing another point of possible convergence in ASD-implicated mechanisms.
AUTHOR CONTRIBUTIONS
BS devised the study and took part in data analysis and manuscript writing. EL carried out all the experiments, did the statistical analysis and took part in writing the manuscript. FF participated in setting up the experiments and writing the manuscript. All of the authors read and endorsed the final version of the manuscript.
FUNDING
This study was funded by the Swiss National Science Foundation (SNF grant: 310030_155952/1) and Novartis Foundation (16C172) to BS.
ACKNOWLEDGMENTS
The authors appreciate the help of Simone Eichenberger and Martine Steinauer, University of Fribourg, in the maintenance of the mouse facility and technical assistance, respectively; and Markus Wöhr, University of Marburg, for helpful discussions and advice.
SUPPLEMENTARY MATERIAL
The Supplementary Material for this article can be found online at: https://www.frontiersin.org/articles/10.3389/fnmol. 2018.00262/full#supplementary-material
REFERENCES
Abrahams, B. S., Tentler, D., Perederiy, J. V., Oldham, M. C., Coppola, G., and Geschwind, D. H. (2007). Genome-wide analyses of human perisylvian cerebral cortical patterning.Proc. Natl. Acad. Sci. U.S.A. 104, 17849–17854. doi: 10.1073/ pnas.0706128104
Alarcon, M., Abrahams, B. S., Stone, J. L., Duvall, J. A., Perederiy, J. V., Bomar, J. M., et al. (2008). Linkage, association, and gene-expression analyses identify CNTNAP2 as an autism-susceptibility gene. Am. J. Hum. Genet. 82, 150–159. doi: 10.1016/j.ajhg.2007.09.005
Anderson, G. R., Galfin, T., Xu, W., Aoto, J., Malenka, R. C., and Sudhof, T. C. (2012). Candidate autism gene screen identifies critical role for cell-adhesion molecule CASPR2 in dendritic arborization and spine development.Proc. Natl. Acad. Sci. U.S.A. 109, 18120–18125. doi: 10.1073/pnas.1216398109
Arking, D. E., Cutler, D. J., Brune, C. W., Teslovich, T. M., West, K., Ikeda, M., et al. (2008). A common genetic variant in the neurexin superfamily member CNTNAP2 increases familial risk of autism. Am. J. Hum. Genet. 82, 160–164. doi: 10.1016/j.ajhg.2007.09.015
Belloso, J. M., Bache, I., Guitart, M., Caballin, M. R., Halgren, C., Kirchhoff, M., et al. (2007). Disruption of theCNTNAP2 gene in a t(7;15) translocation family without symptoms of Gilles de la Tourette syndrome.Eur. J. Hum. Genet. 15, 711–713. doi: 10.1038/sj.ejhg.5201824
Biel, M., Wahl-Schott, C., Michalakis, S., and Zong, X. (2009). Hyperpolarization-activated cation channels: from genes to function.Physiol. Rev. 89, 847–885. doi: 10.1152/physrev.00029.2008
Bischop, D. P., Orduz, D., Lambot, L., Schiffmann, S. N., and Gall, D. (2012). Control of neuronal excitability by calcium binding proteins: a new mathematical model for striatal fast-spiking interneurons.Front. Mol. Neurosci. 5:78. doi: 10.3389/fnmol.2012.00078
Bourgeron, T. (2015). From the genetic architecture to synaptic plasticity in autism spectrum disorder.Nat. Rev. Neurosci. 16, 551–563. doi: 10.1038/nrn3992 Brunner, D., Kabitzke, P., He, D., Cox, K., Thiede, L., Hanania, T., et al. (2015).
Comprehensive analysis of the 16p11.2 deletion and nullCNTNAP2 mouse models of autism spectrum disorder.PLoS One 10:e0134572. doi: 10.1371/ journal.pone.0134572
Chow, A., Erisir, A., Farb, C., Nadal, M. S., Ozaita, A., Lau, D., et al. (1999). K+ channel expression distinguishes subpopulations of parvalbumin- and
somatostatin-containing neocortical interneurons.J. Neurosci. 19, 9332–9345. doi: 10.1523/JNEUROSCI.19-21-09332.1999
de Lecea, L., del Rio, J. A., and Soriano, E. (1995). Developmental expression of parvalbumin mRNA in the cerebral cortex and hippocampus of the rat.Brain Res. Mol. Brain Res. 32, 1–13. doi: 10.1016/0169-328X(95)00056-X
Di Martino, A., Kelly, C., Grzadzinski, R., Zuo, X. N., Mennes, M., Mairena, M. A., et al. (2011). Aberrant striatal functional connectivity in children with autism. Biol. Psychiatry 69, 847–856. doi: 10.1016/j.biopsych.2010.10.029
Elia, J., Gai, X., Xie, H. M., Perin, J. C., Geiger, E., Glessner, J. T., et al. (2010). Rare structural variants found in attention-deficit hyperactivity disorder are preferentially associated with neurodevelopmental genes.Mol. Psychiatry 15, 637–646. doi: 10.1038/mp.2009.57
Estes, A., Shaw, D. W., Sparks, B. F., Friedman, S., Giedd, J. N., Dawson, G., et al. (2011). Basal ganglia morphometry and repetitive behavior in young children with autism spectrum disorder.Autism Res. 4, 212–220. doi: 10.1002/aur.193 Filice, F., Lauber, E., Vörckel, K. J., Wöhr, M., and Schwaller, B. (2018).
17-β estradiol increases parvalbumin levels in Pvalb heterozygous mice and attenuates behavioral phenotypes with relevance to autism core symptoms.Mol. Autism 9:15. doi: 10.1186/s13229-018-0199-3
Filice, F., Vörckel, K. J., Sungur, A. Ö., Wöhr, M., and Schwaller, B. (2016). Reduction in parvalbumin expression not loss of the parvalbumin-expressing
GABA interneuron subpopulation in genetic parvalbumin and shank mouse models of autism.Mol. Brain 9:10. doi: 10.1186/s13041-016-0192-8
Friedman, J. I., Vrijenhoek, T., Markx, S., Janssen, I. M., van der Vliet, W. A., Faas, B. H., et al. (2008).CNTNAP2 gene dosage variation is associated with schizophrenia and epilepsy.Mol. Psychiatry 13, 261–266. doi: 10.1038/sj.mp. 4002049
Fuccillo, M. V. (2016). Striatal circuits as a common node for autism pathophysiology.Front. Neurosci. 10:27. doi: 10.3389/fnins.2016.00027 Gdalyahu, A., Lazaro, M., Penagarikano, O., Golshani, P., Trachtenberg, J. T.,
and Geschwind, D. H. (2015). The autism related protein contactin-associated protein-like 2 (CNTNAP2) stabilizes new spines: an in vivo mouse study. PLoS One 10:e0125633. doi: 10.1371/journal.pone.0125633
Georgiev, D., Gonzalez-Burgos, G., Kikuchi, M., Minabe, Y., Lewis, D. A., and Hashimoto, T. (2012). Selective expression of KCNS3 potassium channel alpha-subunit in parvalbumin-containing GABA neurons in the human prefrontal cortex.PLoS One 7:e43904. doi: 10.1371/journal.pone.0043904
Gogolla, N., Takesian, A. E., Feng, G., Fagiolini, M., and Hensch, T. K. (2014). Sensory integration in mouse insular cortex reflects GABA circuit maturation. Neuron 83, 894–905. doi: 10.1016/j.neuron.2014.06.033
Gundersen, H. J., Bendtsen, T. F., Korbo, L., Marcussen, N., Moller, A., Nielsen, K., et al. (1988). Some new, simple and efficient stereological methods and their use in pathological research and diagnosis.APMIS 96, 379–394. doi: 10.1111/j. 1699-0463.1988.tb05320.x
Gundersen, H. J., Jensen, E. B., Kieu, K., and Nielsen, J. (1999). The efficiency of systematic sampling in stereology–reconsidered.J. Microsc. 193, 199–211. doi: 10.1046/j.1365-2818.1999.00457.x
Hartig, W., Brauer, K., and Bruckner, G. (1992). Wisteria floribunda agglutinin-labelled nets surround parvalbumin-containing neurons. Neuroreport 3, 869–872. doi: 10.1097/00001756-199210000-00012
Hashemi, E., Ariza, J., Rogers, H., Noctor, S. C., and Martínez-Cerdeño, V. (2016). The number of parvalbumin-expressing interneurons is decreased in the prefrontal cortex in autism.Cereb. Cortex 27, 1931–1943. doi: 10.1093/ cercor/bhw021
Haunso, A., Ibrahim, M., Bartsch, U., Letiembre, M., Celio, M. R., and Menoud, P. (2000). Morphology of perineuronal nets in tenascin-R and parvalbumin single and double knockout mice. Brain Res. 864, 142–145. doi: 10.1016/S0006-8993(00)02173-9
Jaramillo, T. C., Speed, H. E., Xuan, Z., Reimers, J. M., Liu, S., and Powell, C. M. (2016). Altered striatal synaptic function and abnormal behaviour in Shank3 Exon4-9 deletion mouse model of autism.Autism Res. 9, 350–375. doi: 10.1002/ aur.1529
Jurgensen, S., and Castillo, P. E. (2015). Selective dysregulation of hippocampal inhibition in the mouse lacking autism candidate geneCNTNAP2. J. Neurosci. 35, 14681–14687. doi: 10.1523/JNEUROSCI.1666-15.2015
Kleijer, K. T., Schmeisser, M. J., Krueger, D. D., Boeckers, T. M., Scheiffele, P., Bourgeron, T., et al. (2014). Neurobiology of autism gene products: towards pathogenesis and drug targets.Psychopharmacology 231, 1037–1062. doi: 10. 1007/s00213-013-3403-3
Langen, M., Bos, D., Noordermeer, S. D., Nederveen, H., van Engeland, H., and Durston, S. (2014). Changes in the development of striatum are involved in repetitive behavior in autism.Biol. Psychiatry 76, 405–411. doi: 10.1016/j. biopsych.2013.08.013
Langen, M., Durston, S., Staal, W. G., Palmen, S. J., and van Engeland, H. (2007). Caudate nucleus is enlarged in high-functioning medication-naive subjects with autism.Biol. Psychiatry 62, 262–266. doi: 10.1016/j.biopsych.2006.09.040 Lauber, E., Filice, F., and Schwaller, B. (2016). Prenatal valproate exposure
differentially affects parvalbumin-expressing neurons and related circuits in the cortex and striatum of mice.Front. Mol. Neurosci. 9:150. doi: 10.3389/fnmol. 2016.00150
Liska, A., Bertero, A., Gomolka, R., Sabbioni, M., Galbusera, A., Barsotti, N., et al. (2017). Homozygous loss of autism-risk geneCNTNAP2 results in reduced local and long-range prefrontal functional connectivity.Cereb. Cortex 28, 1141–1153. doi: 10.1093/cercor/bhx022
Livak, K. J., and Schmittgen, T. D. (2001). Analysis of relative gene expression data using real-time quantitative PCR and the 2−11CT
method.Methods 25, 402–408. doi: 10.1006/meth.2001.1262
Mikhail, F. M., Lose, E. J., Robin, N. H., Descartes, M. D., Rutledge, K. D., Rutledge, S. L., et al. (2011). Clinically relevant single gene or intragenic
deletions encompassing critical neurodevelopmental genes in patients with developmental delay, mental retardation, and/or autism spectrum disorders. Am. J. Med. Genet. A 155a, 2386–2396. doi: 10.1002/ajmg.a.34177
Okaty, B. W., Miller, M. N., Sugino, K., Hempel, C. M., and Nelson, S. B. (2009). Transcriptional and electrophysiological maturation of neocortical fast-spiking GABAergic interneurons.J. Neurosci. 29, 7040–7052. doi: 10.1523/ JNEUROSCI.0105-09.2009
Orduz, D., Bischop, D. P., Schwaller, B., Schiffmann, S. N., and Gall, D. (2013). Parvalbumin tunes spike-timing and efferent short-term plasticity in striatal fast spiking interneurons.J. Physiol. 591, 3215–3232. doi: 10.1113/jphysiol.2012. 250795
Panaitof, S. C., Abrahams, B. S., Dong, H., Geschwind, D. H., and White, S. A. (2010). Language-relatedCntnap2 gene is differentially expressed in sexually dimorphic song nuclei essential for vocal learning in songbirds.J. Comp. Neurol. 518, 1995–2018. doi: 10.1002/cne.22318
Parikshak, N. N., Swarup, V., Belgard, T. G., Irimia, M., Ramaswami, G., Gandal, M. J., et al. (2016). Genome-wide changes in lncRNA, splicing, and regional gene expression patterns in autism.Nature 540, 423–427. doi: 10.1038/ nature20612
Paxinos, G. (2001).The Mouse Brain in Stereotaxis Coordinates, 2nd Edn. San Diego, CA: Academic Press.
Peca, J., Feliciano, C., Ting, J. T., Wang, W., Wells, M. F., Venkatraman, T. N., et al. (2011). Shank3 mutant mice display autistic-like behaviours and striatal dysfunction.Nature 472, 437–442. doi: 10.1038/nature09965
Penagarikano, O., Abrahams, B. S., Herman, E. I., Winden, K. D., Gdalyahu, A., Dong, H., et al. (2011). Absence ofCNTNAP2 leads to epilepsy, neuronal migration abnormalities, and core autism-related deficits.Cell 147, 235–246. doi: 10.1016/j.cell.2011.08.040
Penagarikano, O., Lazaro, M. T., Lu, X. H., Gordon, A., Dong, H., Lam, H. A., et al. (2015). Exogenous and evoked oxytocin restores social behavior in the Cntnap2 mouse model of autism. Sci. Transl. Med. 7:271ra278. doi: 10.1126/ scitranslmed.3010257
Poliak, S., Gollan, L., Martinez, R., Custer, A., Einheber, S., Salzer, J. L., et al. (1999). Caspr2, a new member of the neurexin superfamily, is localized at the juxtaparanodes of myelinated axons and associates with K+ channels.Neuron 24, 1037–1047. doi: 10.1016/S0896-6273(00)81049-1
Poliak, S., Salomon, D., Elhanany, H., Sabanay, H., Kiernan, B., Pevny, L., et al. (2003). Juxtaparanodal clustering of Shaker-like K+ channels in myelinated axons depends on Caspr2 and TAG-1.J. Cell Biol. 162, 1149–1160. doi: 10.1083/ jcb.200305018
Poot, M. (2015). Connecting theCNTNAP2 networks with neurodevelopmental disorders.Mol. Syndromol. 6, 7–22. doi: 10.1159/000371594
Rapanelli, M., Frick, L. R., Xu, M., Groman, S. M., Jindachomthong, K., Tamamaki, N., et al. (2017). Targeted interneuron depletion in the dorsal striatum produces autism-like behavioral abnormalities in male but not female mice. Biol. Psychiatry 82, 194–203. doi: 10.1016/j.biopsych.2017. 01.020
Rendall, A. R., Truong, D. T., and Fitch, R. H. (2016). Learning delays in a mouse model of autism spectrum disorder.Behav. Brain Res. 303, 201–207. doi: 10.1016/j.bbr.2016.02.006
Rinaldi, T., Kulangara, K., Antoniello, K., and Markram, H. (2007). Elevated NMDA receptor levels and enhanced postsynaptic long-term potentiation induced by prenatal exposure to valproic acid.Proc. Natl. Acad. Sci. U.S.A. 104, 13501–13506. doi: 10.1073/pnas.0704391104
Rinaldi, T., Perrodin, C., and Markram, H. (2008). Hyper-connectivity and hyper-plasticity in the medial prefrontal cortex in the valproic Acid animal model of autism.Front. Neural Circuits 2:4. doi: 10.3389/neuro.04.004.2008
Rodenas-Cuadrado, P., Ho, J., and Vernes, S. C. (2014). Shining a light on CNTNAP2: complex functions to complex disorders. Eur. J. Hum. Genet. 22, 171–178. doi: 10.1038/ejhg.2013.100
Scharff, C., and Nottebohm, F. (1991). A comparative study of the behavioral deficits following lesions of various parts of the zebra finch song system: implications for vocal learning. J. Neurosci. 11, 2896–2913. doi: 10.1523/ JNEUROSCI.11-09-02896.1991
Schneider, T., Ziolkowska, B., Gieryk, A., Tyminska, A., and Przewlocki, R. (2007). Prenatal exposure to valproic acid disturbs the enkephalinergic system functioning, basal hedonic tone, and emotional responses in an animal model of autism.Psychopharmacology 193, 547–555. doi: 10.1007/s00213-007-0795-y
Schwaller, B. (2012). The use of transgenic mouse models to reveal the functions of Ca2+buffer proteins in excitable cells.Biochim. Biophys. Acta 1820, 1294–1303.
doi: 10.1016/j.bbagen.2011.11.008
Schwaller, B., Dick, J., Dhoot, G., Carroll, S., Vrbova, G., Nicotera, P., et al. (1999). Prolonged contraction-relaxation cycle of fast-twitch muscles in parvalbumin knockout mice.Am. J. Physiol. 276, C395–C403. doi: 10.1152/ajpcell.1999.276. 2.C395
Selimbeyoglu, A., Kim, C. K., Inoue, M., Lee, S. Y., Hong, A. S. O., Kauvar, I., et al. (2017). Modulation of prefrontal cortex excitation/inhibition balance rescues social behavior in CNTNAP2-deficient mice. Sci. Transl. Med. 9:eaah6733. doi: 10.1126/scitranslmed.aah6733
Strauss, K. A., Puffenberger, E. G., Huentelman, M. J., Gottlieb, S., Dobrin, S. E., Parod, J. M., et al. (2006). Recessive symptomatic focal epilepsy and mutant contactin-associated protein-like 2.N. Engl. J. Med. 354, 1370–1377. doi: 10. 1056/NEJMoa052773
Thomas, A. M., Schwartz, M. D., Saxe, M. D., and Kilduff, T. S. (2016).Cntnap2 knockout rats and mice exhibit epileptiform activity and abnormal sleep/wake physiology.Sleep 40:zsw026.
Turrigiano, G. (2011). Too many cooks? Intrinsic and synaptic homeostatic mechanisms in cortical circuit refinement. Annu. Rev. Neurosci. 34, 89–103. doi: 10.1146/annurev-neuro-060909-153238
Varea, O., Martin-de-Saavedra, M. D., Kopeikina, K. J., Schurmann, B., Fleming, H. J., Fawcett-Patel, J. M., et al. (2015). Synaptic abnormalities and cytoplasmic glutamate receptor aggregates in contactin associated protein-like 2/Caspr2 knockout neurons.Proc. Natl. Acad. Sci. U.S.A. 112, 6176–6181. doi: 10.1073/ pnas.1423205112
Verkerk, A. J., Mathews, C. A., Joosse, M., Eussen, B. H., Heutink, P., and Oostra, B. A. (2003).CNTNAP2 is disrupted in a family with Gilles de la Tourette syndrome and obsessive compulsive disorder.Genomics 82, 1–9. doi: 10.1016/ S0888-7543(03)00097-1
Vogt, D., Cho, K. K. A., Shelton, S. M., Paul, A., Huang, Z. J., Sohal, V. S., et al. (2017). MouseCntnap2 and human CNTNAP2 ASD alleles cell autonomously regulate PV+ cortical interneurons.Cereb. Cortex. doi: 10.1093/cercor/bhx248 [Epub ahead of print].
West, M. J., Ostergaard, K., Andreassen, O. A., and Finsen, B. (1996). Estimation of the number of somatostatin neurons in the striatum: an in situ hybridization study using the optical fractionator method.J. Comp. Neurol. 370, 11–22. doi: 10.1002/(SICI)1096-9861(19960617)370:1<11::AID-CNE2>3.0.CO;2-O West, M. J., Slomianka, L., and Gundersen, H. J. (1991). Unbiased stereological
estimation of the total number of neurons in thesubdivisions of the rat hippocampus using the optical fractionator.Anat. Rec. 231, 482–497. doi: 10. 1002/ar.1092310411
Wöhr, M., Orduz, D., Gregory, P., Moreno, H., Khan, U., Vörckel, K. J., et al. (2015). Lack of parvalbumin in mice leads to behavioral deficits relevant to all human autism core symptoms and related neural morphofunctional abnormalities.Transl. Psychiatry 5:e525. doi: 10.1038/tp.2015.19
Yi, F., Danko, T., Botelho, S. C., Patzke, C., Pak, C., Wernig, M., et al. (2016). Autism-associated SHANK3 haploinsufficiency causes Ih channelopathy in human neurons.Science 352:aaf2669. doi: 10.1126/science.aaf2669
Zweier, C., de Jong, E. K., Zweier, M., Orrico, A., Ousager, L. B., Collins, A. L., et al. (2009).CNTNAP2 and NRXN1 are mutated in autosomal-recessive pitt-hopkins-like mental retardation and determine the level of a common synaptic protein in Drosophila.Am. J. Hum. Genet. 85, 655–666. doi: 10.1016/j.ajhg. 2009.10.004
Conflict of Interest Statement: The authors declare that the research was conducted in the absence of any commercial or financial relationships that could be construed as a potential conflict of interest.
The reviewer MJS and handling Editor declared their shared affiliation at time of review.
Copyright © 2018 Lauber, Filice and Schwaller. This is an open-access article distributed under the terms of the Creative Commons Attribution License (CC BY). The use, distribution or reproduction in other forums is permitted, provided the original author(s) and the copyright owner(s) are credited and that the original publication in this journal is cited, in accordance with accepted academic practice. No use, distribution or reproduction is permitted which does not comply with these terms.