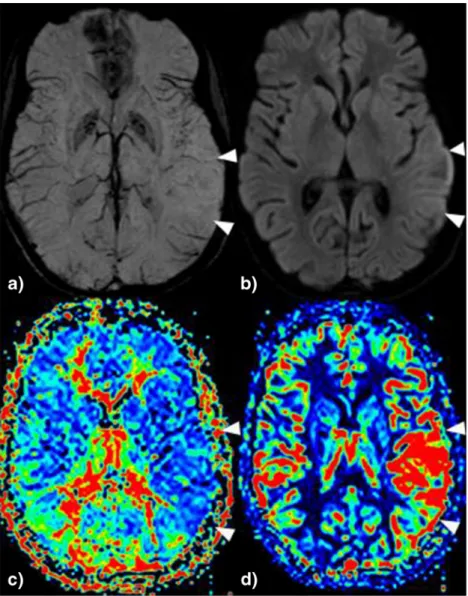
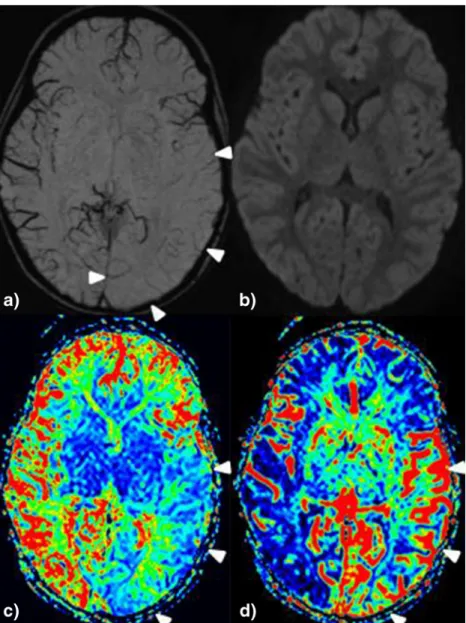
Focal hemodynamic patterns of status epilepticus detected by susceptibility weighted imaging (SWI)
9
0
0
Texte intégral
Figure
Documents relatifs
