HAL Id: hal-02978695
https://hal.sorbonne-universite.fr/hal-02978695
Submitted on 26 Oct 2020
HAL is a multi-disciplinary open access
archive for the deposit and dissemination of
sci-entific research documents, whether they are
pub-lished or not. The documents may come from
teaching and research institutions in France or
abroad, or from public or private research centers.
L’archive ouverte pluridisciplinaire HAL, est
destinée au dépôt et à la diffusion de documents
scientifiques de niveau recherche, publiés ou non,
émanant des établissements d’enseignement et de
recherche français ou étrangers, des laboratoires
publics ou privés.
Estimation of Rift Valley fever virus spillover to humans
during the Mayotte 2018-2019 epidemic
Raphaëlle Métras, W John Edmunds, Chouanibou Youssouffi, Laure
Dommergues, Guillaume Fournié, Anton Camacho, Sebastian Funk, Eric
Cardinale, Gilles Le Godais, Soihibou Combo, et al.
To cite this version:
Raphaëlle Métras, W John Edmunds, Chouanibou Youssouffi, Laure Dommergues, Guillaume Fournié,
et al.. Estimation of Rift Valley fever virus spillover to humans during the Mayotte 2018-2019 epidemic.
Proceedings of the National Academy of Sciences of the United States of America , National Academy
of Sciences, 2020, 117 (39), pp.24567-24574. �10.1073/pnas.2004468117�. �hal-02978695�
Estimation of Rift Valley fever virus spillover to
humans during the Mayotte 2018
–2019 epidemic
Raphaëlle Métrasa,b,c,d,1, W. John Edmundsd, Chouanibou Youssouffie, Laure Dommerguesf,
Guillaume Fourniég, Anton Camachod,h, Sebastian Funkd, Eric Cardinaleb,i, Gilles Le Godaisj, Soihibou Comboj, Laurent Filleulk, Hassani Youssoufk,2, and Marion Subirosk,2
aINSERM, Sorbonne Université, Institut Pierre Louis d’Épidémiologie et de Santé Publique (Unité Mixte de Recherche en Santé 1136), 75012 Paris, France; bCentre de Coopération Internationale en Recherche Agronomique pour le Développement, UMR Animal, Santé, Territoires, Risques, et Écosystèmes,
Campus International de Baillarguet, 34398 Montpellier, France;cAnimal, Santé, Territoires, Risques, et Écosystèmes, I site Montpellier Université
d’Excellence (I-MUSE), Centre de Coopération Internationale en Recherche Agronomique pour le Développement, Institut national de recherche pour l’agriculture, l’alimentation et l’environnement, 34398 Montpellier, France;dCentre for the Mathematical Modelling of Infectious Diseases, Department of
Infectious Disease Epidemiology, London School of Hygiene and Tropical Medicine, London WC1E 7HT, United Kingdom;eGroupement de Défense Sanitaire
Mayotte - Coopérative des Eleveurs Mahorais, Division Santé Animale, 97670 Coconi, Mayotte, France;fLa Coopération Agricole, Division Santé Animale,
F-75538 Paris, France;gVeterinary Epidemiology, Economics and Public Health Group, Department of Pathobiology and Population Sciences, The Royal
Veterinary College, Hatfield AL9 7TA, United Kingdom;hEpicentre, Research Department, 75019 Paris, France;iCentre de Coopération Internationale en
Recherche Agronomique pour le Développement, UMR Animal, Santé, Territoires, Risques, et Écosystèmes, F-97490 Sainte Clotilde, La Réunion, France;
jDirection de l’Alimentation, de l’Agriculture et de la Forêt de Mayotte, Service de l’Alimentation, 97600 Mamoudzou, France; andkSanté Publique France,
Cellule Mayotte de Santé publique France, 97600 Mamoudzou, France
Edited by Tilahun D. Yilma, University of California, Davis, CA, and approved August 12, 2020 (received for review March 20, 2020)
Rift Valley fever (RVF) is an emerging, zoonotic, arboviral hemor-rhagic fever threatening livestock and humans mainly in Africa. RVF is of global concern, having expanded its geographical range over the last decades. The impact of control measures on epidemic dynamics using empirical data has not been assessed. Here, we fitted a mathematical model to seroprevalence livestock and human RVF case data from the 2018–2019 epidemic in Mayotte to estimate viral transmission among livestock, and spillover from livestock to humans through both direct contact and vector-mediated routes. Model simulations were used to assess the impact of vaccination on reducing the epidemic size. The rate of spillover by direct contact was about twice as high as vector transmission. As-suming 30% of the population were farmers, each transmission route contributed to 45% and 55% of the number of human infec-tions, respectively. Reactive vaccination immunizing 20% of the live-stock population reduced the number of human cases by 30%. Vaccinating 1 mo later required using 50% more vaccine doses for a similar reduction. Vaccinating only farmers required 10 times as more vaccine doses for a similar reduction in human cases. Finally, with 52.0% (95% credible interval [CrI] [42.9–59.4]) of livestock im-mune at the end of the epidemic wave, viral reemergence in the next rainy season (2019–2020) is unlikely. Coordinated human and animal health surveillance, and timely livestock vaccination appear to be key to controlling RVF in this setting. We furthermore dem-onstrate the value of a One Health quantitative approach to surveil-lance and control of zoonotic infectious diseases.
Rift Valley fever
|
modeling|
epidemics|
spillover|
One HealthC
ontrolling zoonotic and vector-borne infections is complex, as it requires an accurate understanding of pathogen trans-mission within animal populations, and pathogen spillover to humans, while accounting for environmental factors affecting vector population dynamics (1, 2). Rift Valley fever (RVF) is an emerging zoonotic arbovirosis causing hemorrhagic fever. RVF is a threat for both animal and human health, mainly in Africa (3). Livestock (cattle, sheep, and goats) are RVF virus (RVFV)-am-plifying hosts, acquiring infection through the bites of infectious mosquitoes (mainly Aedes spp. and Culex spp.) (4). Humans get infected by direct contact with infectious animal tissues (upon abortions or animal slaughter), although vector transmission may also play a role (4, 5). Since 2015, RVF has been listed as a priority emerging disease by the World Health Organization (WHO) R&D Blueprint (6). A major concern is the expansion of its geographical range over recent decades (5, 7). Current disease control options for reducing disease risk in humans heavily rely oncontrolling virus transmission in animal populations. The impact of disease control measures in livestock on reducing RVF risk in hu-mans has not yet been assessed, and doing so requires estimating key transmission parameters between livestock, and from livestock to humans, using animal and human epidemiological data.
Mayotte, an island located in the southwestern Indian Ocean region, reported a RVF epidemic in 2007–2008 (8). In a previous paper, we used longitudinal livestock seroprevalence data to model RVFV emergence in the livestock population, and we estimated that the likelihood of reemergence was very low in a closed ecosystem (i.e., without introduction of infectious ani-mals). However, a few imported infectious animals could trigger another large epidemic, as the herd immunity declined due to livestock population turnover (9). In 2018, about 10 y after the previous epidemic, RVF outbreaks were reported in several East African countries (e.g., Kenya, South Sudan, Uganda, Rwanda)
Significance
Rift Valley fever (RVF) is an emerging, zoonotic hemorrhagic fever, affecting mainly livestock and humans in Africa. Despite its growing global concern, the impact of control measures on epidemic dynamics using empirical data has not been assessed. By combining a unique RVF epidemic dataset covering both livestock and human data in a closed ecosystem (Mayotte island) with a dynamic model, we estimate viral transmission potential among livestock, and from livestock to humans. We also quantify the impact of vaccination in decreasing the epi-demic size. We demonstrate that reactive livestock vaccination is key. We present a reference case study for RVF and illustrate the value of a One Health quantitative approach to surveillance and control of zoonotic infectious diseases.
Author contributions: R.M., W.J.E., L.D., H.Y., and M.S. designed research; R.M., W.J.E., C.Y., L.D., and G.F. performed research; R.M., C.Y., E.C., G.L.G., S.C., L.F., H.Y., and M.S. contributed new reagents/analytic tools; R.M., G.F., A.C., and S.F. analyzed data; and R.M., W.J.E., L.D., and G.F. wrote the paper.
The authors declare no competing interest. This article is a PNAS Direct Submission.
This open access article is distributed underCreative Commons
Attribution-NonCommercial-NoDerivatives License 4.0 (CC BY-NC-ND).
1To whom correspondence may be addressed. Email: raphaelle.metras@inserm.fr.
2H.Y. and M.S. contributed equally to this work.
This article contains supporting information online athttps://www.pnas.org/lookup/suppl/
doi:10.1073/pnas.2004468117/-/DCSupplemental.
First published September 14, 2020.
POPULA
TION
BIO
(10, 11). In Mayotte, between November 2018 and August 2019, a total of 143 human cases (RVFV RT-PCR confirmed) were reported (Fig. 1A). The virus belongs to the Kenya-2 clade (12), which is closely related to the strains detected in recent out-breaks in Eastern Africa. The Veterinary Services of Mayotte, the regional health authorities (Agence de Santé Océan Indien) and the French Public Health Agency (Santé Publique France) did further epidemiological investigations to assess temporal patterns of infection in the animal population, and to identify possible routes of human exposure to RVFV. These investiga-tions generated a uniquely well-documented RVF epidemic dataset, including RVF seroprevalence and incidence data in animal and humans.
We present these data and use them to extend and fit a mathematical model of RVFV transmission in livestock (9), and explicitly account for viral spillover from livestock into the human population. We fit this model simultaneously to the infection patterns in livestock and humans observed during the 2018–2019 epidemic, allowing 1) to estimate the level of RVFV transmission among livestock and spillover from livestock to humans by both direct contact and vector-mediated routes, 2) to estimate the likelihood of another epidemic the following year, and 3) to assess the impact of potential vaccination strategies in livestock and humans on reducing disease occurrence in humans.
Results
The Course of the Epidemic in Livestock and Humans.Between No-vember 2018 and August 2019, 143 RVF human cases were reported. The epidemic peaked in mid-February (February 11–17, 2019), with 18 weekly confirmed cases, six to 7 wk fol-lowing the rainfall peak (Fig. 1A). About two-thirds of investi-gated cases reported a direct contact with livestock or its tissues (including milk consumption) (68%, n= 86), while 32% (n = 41) reported no previous contact with animals (Fig. 1 A–C, cases in red and green, respectively).
Livestock sera (n= 1,169) collected by the Veterinary Services between July 2018 and June 2019 were tested against RVF IgG. To assess the timing of emergence of the virus in the livestock population, we plotted quarterly age-stratified RVF IgG sero-prevalence, using only tested animals for which the date of birth was available (n= 493). In July to September 2018, that is, be-fore the report of the first human case, most seropositive animals were in the oldest age groups (Fig. 1D), probably indicating viral exposure during the previous epizootic (9). The IgG seropreva-lence increased in all age groups in January to March (Fig. 1E), and then in April to June 2019 (Fig. 1F), demonstrating that the emergence of the virus in the livestock population occurred si-multaneously with the report of cases in humans, following an interepidemic period of 10 y.
Ongoing viral phylogenetic analyses on human-derived sam-ples (12), and IgM-positive livestock seized from informal trade between June and August 2018 (SI Appendix, Table S6), suggest that the virus was likely introduced from Eastern Africa into Mayotte between June and August 2018, through the movements of infectious animals.
Epidemic Model.We modeled virus transmission among livestock as a function of rainfall. We divided the human population into two groups. In the first group (named “farming” group), indi-viduals were assumed to be in regular contact with animals, and RVF viral spillover was modeled by both direct contact and vector-mediated routes. In the other group, individuals could acquire infection only by the vector-mediated route (“non-farming” group). In the base case, the farming and nonfarming groups represented 30% and 70% of the population, respectively (13). We also explored the case assuming 10% farmers and 90% nonfarmers. Spillover by direct contact assumed a time-invariant transmission rate, and the vector-mediated transmission, defined as a function of rainfall, varied over the study period (Materials and Methods, Fig. 2, andSI Appendix, Tables S1 and S3).
Fig. 1. (A and F) RVF epidemic data in humans and livestock, and model fit (base case). (A) Weekly number of reported human cases and average daily rainfall pattern (solid blue line). Human cases reporting a direct contact with animals or their products are presented in red (86 cases), those reporting no prior contact with animals or their products are in green (41 cases), and lost to follow-up are in gray (16 cases). (B) Predicted median (red solid line) and 95% CrI (red envelope) of the number of weekly reported human cases in the farming group, and weekly incident observed cases (red dots). (C) Predicted median (green solid line) and 95% CrI (green envelope) of the number of weekly reported human cases in the nonfarming group, and weekly incident observed cases with no prior contact with animals (green dots). (D) Quarterly age-stratified RVF IgG seroprevalence in livestock for the trimesters July to September 2018 (n= 173), (E) January to March 2019 (n= 252), and (F) April to June 2019 (n = 67). In D–F, the black dots and vertical black lines represent the observed age-stratified average IgG seroprevalence and their 95% CI. The model predicted values are showed by the median (solid blue line) and 95% CrI (blue envelopes).
Transmission parameters.By fitting this model to the RVF datasets, the time-varying reproduction number in the livestock pop-ulation was estimated to peak at Rs,t= 1.9 (95% credible interval
[CrI] [1.5–2.5]), in the second half of January (January 14–27, 2019) (SI Appendix, Fig. S2A), 2 wk following the rainfall peak, and 3 to 4 wk prior to the predicted epidemic peaks in livestock and humans (Fig. 3A). This corresponded to a transmission rate among livestock (βL−L,t) at 9.1 per 1,000,000 livestock heads per day (95% CrI [7.9–11.2]) (SI Appendix, Fig. S2B). The spillover rate from livestock to humans by direct contact(βC
L−H)
was estimated to be 4.4 per 10 million persons per day (95% CrI [2.9–7.0]) (SI Appendix, Table S3), which was 2.3 times higher than the vector-mediated route(βVL−H,t) at its highest value (1.9 per 10 million persons per day [95% CrI (1.3–3.2)];SI Appendix, Fig. S2C).
Model predictions.Using the estimated parameters, the simulated number of human reported cases was 173 (95% CrI [133–224]), with about two-thirds from the farming group (n= 106) and one-third from the nonfarming group (n= 67) (Table 1), in agree-ment with the observed data (Fig. 1 B and C). The predicted age-stratified IgG seroprevalence in livestock between January and June 2019 were in good agreement with the observed data as well (Fig. 1 E and F). The simulated incidence in livestock cases peaked mid-February (February 11–17), concomitantly with the peak in human vector-mediated transmission, while the number of human cases by direct contact reached its maximum values over the last 2 wk of February (February 11–24) (Fig. 3A). By the end of the epidemic wave, 17,723 (95% CrI [14,170–20,481]) animals were affected, resulting in 52.0% (95% CrI [42.9–59.4]) of the livestock population being immune (Fig. 3B and Table 1). The overall predicted number of human infections was estimated to have reached 9,113 (95% CrI [7,361–11,355]) (Table 1). As-suming that 30% of the population were farmers (directly ex-posed to livestock), they were 3.6 times more likely than nonfarmers to have experienced infection during the epidemic (Table 1, no intervention, ratio of postepidemic seroprevalence in farming versus nonfarming groups), corresponding to 45% of cases resulting from direct contact with animals, and 55% from vector transmission (SI Appendix, Table S4). If those directly exposed (farmers) represented only 10% of the population, they
would have been 14.7 times more likely than nonfarmers to have experienced infection during the epidemic, with 58% of infec-tions resulting from direct contact (“10–90 case”;SI Appendix, Tables S3–S5). Finally, using a 21-d rainfall lag resulted in a 1-wk delay of the epidemic peak, while having negligible impact on the epidemic sizes (“21-d lag case”;SI Appendix, Table S3).
In this setting, the likelihood of virus reemergence in the following rainy season (2019–2020) was less than 2.5% (Fig. 3A), with the time-varying effective reproductive number Re,tfalling
below unity following the epidemic peaks and remaining very close to or below unity over the second year of the simulations (Fig. 3C).
Vaccination scenarios.Probabilistic forecasts were also used to as-sess the impact of different livestock and human vaccination strategies on the size of the epidemic in both animals and hu-mans (Fig. 4 A–D and Table 1). A reactive and mass vaccination campaign in livestock immediately after the report of the first human case in which 6,000 doses are delivered in December 2018 allowed a reduction in the epidemic size by a third (median number of reported humans cases, 113 cases; median number of livestock cases, 11,397), while waiting one more month would have required 50% more vaccine doses to achieve a similar im-pact (9,000 doses in January 2019; median number of humans reported cases, 117; median number of livestock cases, 11,576). Finally, a vaccination program targeting 80% of individuals in the farming group (61,560 doses in December 2018) reduced similarly the number of human cases (median, 111 cases), while, of course, not impacting on the number of livestock cases. Vaccinating half of the human population in both groups would have required 128,250 doses (20 times more than livestock doses), for a smaller impact (Table 1).
Discussion
We present a RVF epidemic dataset combining both livestock and human surveillance data and use it to parameterize a math-ematical model. We estimated transmission rates among livestock and spillover to humans using empirical epidemic data, as well as the fraction of human cases resulting from direct contact and vector transmission. This model also allowed the quantitative as-sessment of the importance of timely livestock vaccination in
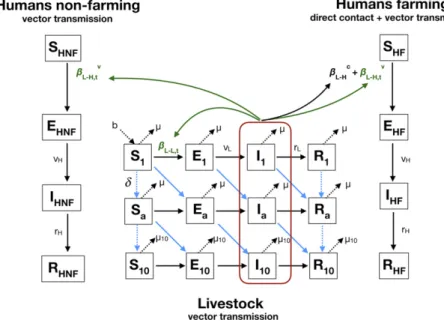
Fig. 2. Model diagram. The livestock population is stratified in 10 yearly age groups. Humans are exposed to RVFV through infectious livestock. The farming population can get infected by direct contact or vector transmission, and the nonfarming population acquires infection only by vector-mediated transmission. Notations, equations, and assumptions on viral transmission are presented inSI Appendix, Methods and Tables S1 and S2.
POPULA
TION
BIO
reducing disease risk in humans during an epidemic, useful to in-form potential control programs, and illustrating the importance of One Health surveillance in the management of zoonotic diseases.
The IgM testing of illegally imported livestock suggested that the virus may have been introduced in Mayotte around June to August 2018, which is in agreement with the timing of RVF outbreaks on the East African mainland (11) and corresponds to the dry season in Mayotte. Viral transmission might have been maintained on the island at a low level in the dry season, or the virus might have been several times introduced, and the epi-demic started only following the start of the rainy season (that is, in October). The epidemic is likely to have therefore resulted from a recent viral reintroduction, rather that viral persistence
over the last 10 y, as concluded about the 2007–2008 epidemics, in a previous study (9). Furthermore, since transovarial trans-mission of the virus in vectors is believed to play a minor mechanism for RVFV persistence on the island (14), we mod-eled the epidemic following virus introduction on the island, and not local reemergence from mosquito eggs.
The systematic testing by RT-PCR of humans showing dengue-like syndrome performed in Mayotte over the last 10 y (since 2008) provided additional evidence that RVF had been absent from the island for a decade, and that the presented epidemic curve accurately reflected its actual timing. During the epidemic, mitigation strategies such as vector control around houses of human cases (i.e., postdetection) and the diffusion of prevention messages on milk consumption and exposure to ani-mals were communicated, from February 27 onward (15), that is, 2 wk after the peak. Therefore, these measures are likely to have little impact on the epidemic size, unaffecting the time of the epidemic peak. In addition, the timing of the epidemic was cor-roborated by the observed changes in livestock seroprevalence, exhibiting a clear pattern of viral emergence. Most livestock sera (90%) were collected and tested as part of the regular annual surveillance campaign. As 10% of these samples were collected in areas reporting human cases, the proportion of seropositive ani-mals may have been overestimated. However, most animal sam-pling was conducted from January 2019 onward, when RVFV had already spread across the whole island. In addition, our model predicted that 52.0% (95% CrI [42.9–59.4]) of the livestock population was immune at the end of the simulated epidemic wave (August 2019), which was in line with estimates from the previous emergence in 2007–2008 (9). Furthermore, in line with our model predictions, RVFV did not reemerge in the following 2019–2020 rainy season in Mayotte, as evidenced by the sustained systematic testing of dengue-like syndromes (16).
RVFV can be transmitted by multiple species of mosquitoes, and their presence varies across Africa (17). In Mayotte, RVFV has never been detected in mosquitoes in the wild. However, 47 species of mosquitoes have been described, from which several could be potential vectors (e.g., Aedes aegypti, Ae. circumluteolus, Anopheles coustani, Culex pipiens, Cx quinquefasciatus, Cx anten-natus, Eretmapodites quinquevittatus, and Mansonia uniformis) (14, 18, 19). Each of these vectors may have specific bioecology and population dynamics. While future research should aim at col-lecting such data, in their absence, we used rainfall as a proxy for the presence of RVF vectors, as it was found to be associated with the occurrence of RVF outbreaks (17, 20). We assumed a 14-d lag between rainfall and its impact on vector abundance based on previous modeling studies on RVF vector population dynamics (21, 22). This resulted in a maximal value of Rs,tof 1.9 (95% CrI
[1.5–2.5]), which is in line with previous estimations of R0(23–25),
and assuming a 21-d lag, at the most, delayed the epidemic peak by 1 wk. Temperature above 26 °C may also promote RVFV transmission (26–28). However, with the average annual temper-atures in Mayotte varying between 25 and 35 °C (9), we assumed that in this specific setting temperature would not be a major driver for viral transmission. In areas with cooler temperatures, such as South Africa (29), temperature may need to be taken into account (30).
Previous RVF models parameterized the transmission rate from livestock to humans by direct contact as an input parameter at 1.7 per 10,000 persons per day (23, 31, 32). The epidemiological investigations conducted in this epidemic assessed whether human cases reported a direct contact with animals or their tissues. By combining this information with data on the fraction of people in contact with livestock in the population (30%), this allowed dis-entangling and estimating both RVFV spillover to humans by direct contact and by vector transmission from epidemic data. These estimated transmission rates can be used as a benchmark for further modeling work. The model predictions showed that
Fig. 3. (A and C) Model predictions over two rainy seasons (2018–2019 and 2019–2020). (A) Predicted (reported and unreported) number of infectious livestock (blue) and humans by direct contact (red), and vector-mediated route (green). (B) Predicted median (solid lines) and 95% CrI envelopes of the predicted proportion of susceptible (green) and immune (black) livestock over the course of the epidemic. (C) Values of Re,t= Rs,t*Stover the course of
the epidemic. In all panels, the vertical blue line corresponds to the predicted epidemic peak in livestock (1,186 infections) and nonfarmers (240 infections) (February 11–17). The highest incidence in the farming group is estimated to be February 11–17 and February 18–24 (354 and 353 infections, respectively); the second of these weeks is represented with the red line. The vertical black line corresponds to the end of the fitting period (August 2019).
55% of human cases resulted from vector transmission, and 45% from direct contact. The main route of RVFV transmission to humans reported to date, during epidemics, is the transmission by direct contact (33–35). Here, while the proportion of vector-mediated infections decreased with the proportion of the farm-ing population (to 42% if only 10% of the population have regular contact with animals), it remained high, suggesting that the vector-mediated transmission might have played an important role in this setting. During this epidemic, all those with dengue-like syn-dromes consulting a general practitioner (GP) were tested against RVFV by RT-PCR. The reported human cases therefore captured RVF cases from both exposed and nonexposed groups, giving confidence that our estimates on the direct contact and vector transmission routes had limited bias. In addition, the high diversity of potential RVF vectors present in Mayotte, as mentioned in the above paragraph, and their feeding preferences for livestock and humans [for example, Cx pipiens and Cx antennatus (14)], might have also contributed to facilitate vector spillover transmission. In the 1977 epidemic in Egypt, the vector route is believed to have played an important role with Cx pipiens being a major vector, and resulting in several thousands of human cases (36). However, we acknowledge that the relative importance of vector transmission versus direct contact during an epidemic may vary across ecosys-tems. Yet, we provide quantitative information on the zoonotic transmission of RVFV.
A limitation of the model was that the reporting rate in hu-mans was unknown, and defined based on data from the 2007–2008 epidemic (37). This relied on the assumption that both the 2007–2008 and 2018–2019 epidemics affected the same number of people. While there are no data available on human infection patterns to support this assumption, our previous work estimated a postepidemic livestock seroprevalence (9) that was similar to our current estimates, supporting the assumption that both epidemic sizes may be comparable. Further data collection estimating human postepidemic seroprevalence would be nec-essary to allow an accurate estimation of this reporting rate. In addition, the livestock model was built with similar assumptions to our previous paper (9). This included a latent (E) and an infectious (I) period of 7 d in livestock, accounting for the
extrinsic incubation period in the vector (3 to 7 d), and the latent (1 to 6 d) and infectious stages (3 to 6 d) in livestock (38–41), without explicitly modeling these processes. Although this may have slightly impacted on the predicted timing of the epidemic peak in humans, our model predictions were in agreement with the observations. In addition, this did not impact on the fitting to the livestock data, as we fitted on the (R) compartment, aggre-gating data over 3-mo periods. We further assumed that livestock and humans in the (R) compartment represented the immune population, with immune livestock represented by IgG seropos-itivity. These assumptions were made on the basis that immunity is conferred by lifelong neutralizing antibodies following RVF infection, and that the production of these antibodies are ac-companied by the production of IgG (42, 43). We also assumed homogeneous mixing. Mayotte is a small island (374 km2), eco-logical conditions show limited spatial heterogeneity (19), and livestock production systems are extensive with animals raised outdoor year round (9), compatible with the assumption that the livestock population, from all age groups, was equally exposed to RVF mosquito vectors. Accounting for spatial heterogeneity and testing for finer vaccination protocols would have required the use of epidemic data at a smaller spatiotemporal resolution. Our model can, however, be expanded into a metapopulation struc-ture, and parameters further refined, in ecosystems with epide-miological data (in both animals and humans) and entomological data (vector population dynamics) available at finer spatial and temporal scales.
The impact and cost-effectiveness of livestock vaccination have been assessed in specific RVF high-risk areas in Kenya using simulation modeling (40, 41). Our analysis demonstrates the impact of vaccination strategies on reducing the number of human and animal cases, through a model calibrated from epi-demic data. Our findings provide evidence that reactive animal vaccination is the most effective control measure, preventing both human and livestock cases, and requiring a smaller number of vaccine doses. The characteristics of the vaccine used in the vaccination scenarios (highly immunogenic, single dose, and safe) were those optimal targeted by WHO R&D Blueprint (44), and not the existing ones. Therefore, we present the“best-case”
Table 1. Predicted epidemic sizes and postepidemic seroprevalence in livestock and humans (farming and nonfarming groups), without intervention and for the different vaccination scenarios, predicted median (95% CrI)
Scenarios No intervention
Livestock vaccination: month, no. of doses (vaccination coverage)
Human vaccination: month, no. of doses (vaccination coverage) Farming Farming and nonfarming (50%) December, 3,000 (10%) December, 6,000 (20%) January, 3,000 (10%) January, 6,000 (20%) January, 9,000 (30%) December, 61,560 (80%) December,128,250 Epidemic size Livestock 17,723 (14,170–20,481) 14,385 (11,013–17,077) 11,397 (8,653–13,945) 15,264 (11,945–17,901) 13,214 (10,402–15,623) 11,576 (9.190–13,819) 17,726 (14,283–20,536) 17,748 (14,182–20,541) Human, reported cases [percentage total]
Total 173 (133–224) 142 (107–185) 113 (82–152) 150 (114–197) 131 (96–179) 117 (83–159) 111 (78–153) 135 (100–181)
Farming 106 [61%] 87 [61%] 69 [61%] 92 [61%] 80 [61%] 71 [61%] 44 [40%] 67 [50%]
Nonfarming 67 [39%] 55 [39%] 44 [39%] 59 [39%] 51 [39%] 46 [39%] 67 [60%] 68 [50%]
Humans, all cases: reported and nonreported [percentage total]
Total 9,113 (7,361–11,355) 7,490 (6,057–9,333) 5,956 (4,642–7,621) 7,916 (6,393–10,113) 6,916 (5,422–8,924) 6,170 (4,708–8,226) 5,789 (4,456–7,671) 7,109 (5,669–9,201) Farming 5,559 [61%] 4,569 [61%] 3,633 [61%] 4,829 [61%] 4,219 [61%] 3,764 [61%] 2,316 [40%] 3,512 [50%] Nonfarming 3,554 [39%] 2,921 [39%] 2,323 [39%] 3,087 [39%] 2,697 [39%] 2,406 [39%] 3,473 [60%] 3,588 [50%] Postepidemic seroprevalence Livestock 52.0 (42.9–59.4) 42.8 (34.2–50.3) 34.4 (27.5–41.3) 45.1 (36.7–52.2) 39.2 (32.3–45.5) 34.6 (28.7–40.3) 52.0 (43.24–59.62) 52.1 (43.1–59.6) Humans: farming 7.2 (5.7–9.3) 6.0 (4.7–7.8) 4.8 (3.6–6.4) 6.3 (4.9–8.4) 5.5 (4.1–7.4) 4.9 (3.6–6.8) 2.9 (2.1–4.4) 4.6 (2.5–6.2) Humans: nonfarming 2.0 (1.4–2.7) 1.6 (1.1–2.2) 1.3 (0.9–1.8) 1.7 (1.2–2.3) 1.5 (1.0–2.1) 1.3 (0.9–1.9) 2.0 (1.4–2.7) 2.0 (1.4–2.7) POPULA TION BIO LOGY
scenarios. RVF vaccines currently available have different immu-nogenic and safety characteristics, with some of them requiring boosters (45). Scenarios using vaccines requiring boosters may have shown a delayed impact on the epidemic compared with the sce-narios tested, by increasing the time to build up immunity. In practice, the choice of which vaccine to use in the field may vary with epidemiological context, and administering a vaccine with a booster would require at least doubling resources. During this ep-idemic in Mayotte, livestock were not vaccinated due the absence of a vaccine with a European Union (EU) marketing authorization (Mayotte is an EU outermost region) (46). However, we highlight the importance of developing contingency plans, including emer-gency funds, should a suitable vaccine becomes available.
In conclusion, we have presented a uniquely detailed investi-gation into an outbreak of an emerging arbovirus, combining animal and human data, with a mathematical model for RVF. Our estimates can be used as a benchmark to parameterize RVF epidemic models developed for other areas. The model can be recalibrated to other epidemic settings to estimate ecosystem-specific transmission parameters, or further extended should epidemiological and entomological data be available at suitable space–time resolutions. Disease surveillance in animals, contin-gency planning, and the timely implementation of livestock vaccination are key for reducing human disease risk. This work represents a collaboration between public health and animal
health agencies, a farmers’ association, and researchers, initiated from the start of the epidemic. Delays in getting livestock data occurred due to tropical storms and fieldwork constraints in remote areas. Nevertheless, we addressed in practice the chal-lenges of a quantitative One Health approach (47) and illus-trated its value to surveillance and the future control of zoonotic emerging infectious diseases.
Materials and Methods
RVF Datasets.
Human data. Human incident case data were collected from patients showing dengue-like symptoms and consulting a GP, and who subsequently tested positive for RVFV RT-PCR (48). Cases were interviewed using a structured questionnaire administered by Santé Publique France health epidemiologists (49). The number of incident cases was aggregated by week.
Livestock data. During the study period, livestock sera were sampled by field veterinarians according to two protocols: RVF targeted surveys around hu-man cases and the regular annual surveillance campaign (Système d ’Epidé-miosurveillance Animale à Mayotte [SESAM]), which has been implemented since 2008 (8). The sera from the RVF targeted surveys were collected be-tween January and March only. However, due to the rapidly increasing number of human cases and logistics constraints, the Veterinary Services instead requested field veterinarians to sample animals from the annual surveillance campaign only; hence relatively few samples were collected from the targeted survey. In total, between July 2018 and June 2019, a total of 1,169 livestock sera were collected (1,023 from the annual surveillance Fig. 4. (A and D) Impact of vaccination strategies on the epidemic size. (A) Median weekly number of predicted reported incident human cases, and cor-responding (B) final human epidemic size (reported cases). (C) Median weekly number of predicted incident infected livestock, and corcor-responding (D) total livestock epidemic size. In A and C, the red solid line presents the scenario with no intervention (scenario 1); the black lines present vaccinations in December 2018 (black solid, 3,000 doses; dashed black, 6,000 doses) (scenarios 2 and 3); the blue lines present the vaccinations in January 2019 (blue solid, 3,000 doses; dashed blue, 6,000 doses; dotted blue, 9,000 doses) (scenarios 4–6); the dark green and the light green lines represent the vaccination of farmers (scenario 7), and the vaccination of the two groups (scenario 8), respectively. Note that, in C, the curves representing the incident livestock cases for no intervention and the vaccination scenarios targeting humans overlap.
and 146 from human investigations) and tested against RVF IgG [ID Screen RVF Competition ELISA; IDVet; Se= 97%, Sp = 100% (50)]. Date of birth was available for 493 of these sampled animals (with 9% from RVF targeted surveys;SI Appendix, Table S7). In order to follow the emergence of the virus in the livestock population over a year, we plotted quarterly age-stratified RVF IgG seroprevalence (Fig. 1 D–F).
Origin of the virus. To investigate the possible time window of virus intro-duction from imported infected animals, we collated serological data from illegally imported livestock seized by the Veterinary Services between June and August 2018. These animals were tested for RVF IgM by ELISA (indicative of recent infections) (SI Appendix, Table S6).
Epidemic Model. We modeled the RVF epidemic from the start of the rainy season, the first week of October 2018 (October 1–7), 1 mo prior to the report of the first human case, up to the first week of August 2019 (July 29 to August 4). No more human cases were reported after this date. The model diagram is presented in Fig. 2, the model equations are detailed inSI Ap-pendix, Methods, and the assumptions on viral transmission are summarized inSI Appendix, Table S1.
Transmission among livestock. We adapted the previously developed susceptible– exposed–infectious–recovered model of RVFV transmission among Mayotte livestock (9) to the current epidemiological context. We kept the previous un-derlying demographic livestock population age structure (10 yearly age groups), and we used a discrete-time deterministic framework, with a daily time step. In the previous model, the transmission parameter among livestock(βL−L,t) and
corresponding time-varying reproductive number (Rs,t) were assumed to be
vector-borne and modeled as a function of monthly NDVI (normalized differ-ence vegetation index) values, as a proxy for vector abundance. Here, instead of using monthly NDVI, we used rainfall data (51) at a daily time step, since the model time step and the human epidemic curve available for fitting had a smaller time resolution. We also included a lag of 14 d between rainfall and its impact on the vector abundance (21, 22). To look at the temporal pattern of the viral transmission over time, we also calculated Re,t, the time-varying effective
reproduction number, as the product of Rs,twith the proportion of susceptible
livestock at time t.
Spillover into humans. We added a module simulating RVFV transmission from livestock to humans (Fig. 2). The human population was divided into those that have regular contact with livestock (farming) and those that do not, the nonfarming population. We assumed that susceptibles from the farming population(SHF) became infected (EHF) following exposure with infectious
livestock by direct contact at a constant rate βC
L−H, and by the
vector-mediated route at a time-varying rateβV
L−H,t. Infected individuals from the
farming population, EHF, successively moved through their respective
infec-tious(IHF) and immune states (RHF), assuming they remained immune until
the end of the study period. Susceptibles from the nonfarming population (SHNF) became infected (EHNF) following exposure to infectious livestock by
the vector-mediated route only, at a time-varying rateβV
L−H,t. The
time-varying rate βV
L−H,t was scaled to the within-livestock transmission rate
(βL−L,t), which was rainfall dependent. The model equations, transmission
parameters, and the formulation of the forces of infection from livestock in the farmingλF,tand nonfarming groupsλNF,tare presented inSI Appendix,
Methods.
Parameterization and model fitting. Input parameters were those related to the natural history of infection and demographics in both livestock and human populations (SI Appendix, Table S2). In the“base case,” we assumed that the proportion of farmers (PHF) was 30%, and 70% were nonfarmers (13), and
the rainfall lag was 14 d (SI Appendix, Table S3). The proportion of immune animals at t0was informed from the aggregated July to September 2018 IgG
livestock seroprevalence campaign (Fig. 1D). The reporting fraction of hu-man cases was set toρ = 1.9%, as a postepidemic serological study in hu-mans, conducted in 2011 in Mayotte, estimated that 3.5% (95% CI [2.6–4.8]) of the human population was RVF IgG-positive (37). Assuming a population size of 212,645 inhabitants in 2012 (52), this corresponded to an average of 7,442 persons being seropositive. Assuming that the sizes of the 2007–2008 and 2018–2019 epidemics were similar (as seroprevalence data from live-stock suggest), then 143 cases in the 2018–2019 epidemics would be corre-spond to a reporting fraction of 1.9% (95% CI [1.4–2.6]). Finally, input rainfall data were downloaded from the Meteofrance website, as cumulated rainfall over 10-d periods (51). Daily rainfall was calculated by dividing these values by 10 over each 10-d period.
Five parameters were estimated by fitting the model to the human and livestock epidemic data (SI Appendix, Table S3). Two parameters related to the rainfall-dependent transmission among livestock (A and B), two pa-rameters estimated the spillover to humans, via contact with livestock(βC
L−H)
and via vectors (human vector transmission scaling factor X), and the fifth parameter was the number of infectious livestock at t0(IL,t0). Parameter
estimation was done by fitting simultaneously the 1) quarterly age-stratified simulated proportion of immune livestock (pa,q) to quarterly RVF IgG
sero-prevalence (Fig. 1 E and F); 2) the simulated weekly number of reported incident cases in the farming population to the observed cases reporting a contact with animals (Fig. 1B); and 3) the simulated weekly number of reported incident cases in the nonfarming population to the observed cases not reporting a prior contact with animals (Fig. 1C). Values of those five pa-rameters were sampled from their posterior distributionθ = {A, B, βC
L−H, X, IL,t0}
using a Monte Carlo Markov chain Metropolis–Hastings algorithm, imple-mented in the fitR package (53). Finally, to assess the impact of stratifying the human population, and the impact of the rainfall lag on viral transmission, we also fitted the model to estimate these five parameters assuming that 10% of the population were farmers (PHF= 10%), and a rainfall lag of 21 d (SI
Ap-pendix, Table S3). Details on model equations, parameter estimation, and model fitting are presented inSI Appendix, Methods.
Forecasting and vaccination scenarios. We did probabilistic projections for eight scenarios (Table 1), using the base case parameters (SI Appendix, Table S3). For all scenarios, we simulated 2,500 stochastic trajectories by sampling parameter values randomly from the joint posterior distributions. Scenario 1 aimed at estimating the likelihood of virus reemergence, without disease control intervention, in the following rainy season (in 2019–2020), in a closed ecosystem, using the same rainfall data as during the 2018–2019 rainy sea-son. Scenarios 2–6 aimed at assessing the impact that different livestock vaccination strategies could have had on the number of human and livestock cases during the 2018–2019 epidemic. We assumed the use of a single-dose highly immunogenic vaccine (90% vaccine efficacy) (44, 45), and a 14-d lag between vaccination and buildup of immunity. Figures of vaccination cam-paigns in Mayotte in 2017 (against blackleg, a livestock disease), showed that about 3,000 vaccine doses are routinely administered to livestock over a year by local veterinarians. Scenario 2 tested the impact of administrating 3,000 doses in one month, in December 2018, immediately after the report of the first human case (joint animal–human alert date for response), cor-responding to the current vaccinating capacity in Mayotte in an emergency setting. Scenario 3 assumed an extravaccine supply and an emergency mass vaccination, allowing 6,000 doses to be administered in December 2018. We also assessed the impact of vaccinating livestock in January 2019, 1 mo fol-lowing the report of the first human case, alfol-lowing extra time for organizing the vaccination campaign: 3,000 doses (scenario 4), 6,000 doses (scenario 5), and 9,000 doses (scenario 6). Finally, to assess the impact of a reactive and mass vaccination only in humans, we simulated a 80% vaccination coverage of the farming population in December 2018 (i.e., 61,560 doses) (scenario 7), and a 50% vaccination coverage of the two groups (i.e., 128,250 doses) (scenario 8). Vaccination equations and diagram are presented in SI Ap-pendix, Methods and Fig. S1.
Ethics statement. The livestock data were collected under the under the Mayotte disease surveillance system (SESAM) with the approval of the Di-rection of Agriculture, Food, and Forestry of Mayotte. For human data, according to French law, only“research involving a human being” (research defined by article L. 1121-1 and article R. 1121-1 of the Code de la Santé Publique) is compelled to receive the approval of ethics committee. This study was based on anonymous data collected from health professionals for public health purposes relating to the health surveillance mission entrusted to Santé Publique France by the French Law (article L. 1413-1 Code de la Santé Publique). Therefore, the study did not meet the criteria for qualifying a study“research involving a human being” and did not require the ap-proval of an ethics committee. Furthermore, as the data were anonymous, it did not require an authorization of the French data protection authority (Commission Nationale Informatique et Libertés).
Data Availability. The data are presented inSI Appendix, Tables S8 and S9. The codes are provided. All study data are included in the article and
SI Appendix.
ACKNOWLEDGMENTS. We thank Agence de Santé Mayotte (ARS Mayotte), which participated in collecting human cases data, and the laboratory of Centre Hospitalier de Mayotte, which performed the virological analyses on human samples. We thank the Veterinary Services of Mayotte, the field veterinarians, the Système d’Epidémiosurveillance Animale à Mayotte, the Coopérative Agricole des Éleveurs Mahorais, the French Agricultural Re-search Centre for International Development, the Centre de Recherche et de Veille de l’Océan Indien, and Laboratoire Vétérinaire d’Analyses Dépar-temental de Mayotte for data collection and the serological analyses on livestock samples. We thank Harold Noël from Santé Publique France for
POPULA
TION
BIO
facilitating human data access in the early stage of the epidemic. RVF RT-PCRs were conducted as part as the surveillance system on dengue-like syndrome since 2008, funded by Agence de Santé Océan Indien. The ani-mal sampling and analyses were funded by European Agricultural Fund for Rural Development and Réseau d’Innovation et de Transfert Agricole Mayotte. W.J.E. and A.C. were funded by the Department of Health and Social Care using UK Aid funding managed by the National Institute for
Health Research (Vaccine Efficacy Evaluation for Priority Emerging Dis-eases: PR-OD-1017-20007). The views expressed in this publication are those of the authors and not necessarily those of the Department of Health and Social Care. S.F. was funded by a Wellcome Senior Research Fellowship (210758/Z/18/Z). Finally, we are very grateful to our referees for their time and scrutiny to review our work. Their comments have greatly improved the paper.
1. M. E. J. Woolhouse, C. Dye, Population biology of emerging and re-emerging pathogens—preface. Philos. Trans. R. Soc. Lond. Ser. B. 356, 981–982 (2001). 2. B. A. Jones et al., Zoonosis emergence linked to agricultural intensification and
en-vironmental change. Proc. Natl. Acad. Sci. U.S.A. 110, 8399–8404 (2013).
3. M. H. A. Clark, G. M. Warimwe, A. Di Nardo, N. A. Lyons, S. Gubbins, Systematic lit-erature review of Rift Valley fever virus seroprevalence in livestock, wildlife and hu-mans in Africa from 1968 to 2016. PLoS Negl. Trop. Dis. 12, e0006627 (2018). 4. B. H. Bird, T. G. Ksiazek, S. T. Nichol, N. J. Maclachlan, Rift Valley fever virus. J. Am.
Vet. Med. Assoc. 234, 883–893 (2009).
5. M. O. Nanyingi et al., A systematic review of Rift Valley fever epidemiology
1931–2014. Infect. Ecol. Epidemiol. 5, 28024 (2015).
6. World Health Organization, Epidemic and pandemic-prone diseases: List of Blueprint priority diseases (2018). www.emro.who.int/fr/pandemic-epidemic-diseases/news/list-of-blueprint-priority-diseases.html. Accessed 8 March 2020.
7. R. Hatchett, N. Lurie, Outbreak response as an essential component of vaccine de-velopment. Lancet Infect. Dis. 19, e399–e403 (2019).
8. R. Métras et al., The epidemiology of Rift Valley fever in Mayotte: Insights and per-spectives from 11 years of data. PLoS Negl. Trop. Dis. 10, e0004783 (2016). 9. R. Métras et al., Drivers for Rift Valley fever emergence in Mayotte: A Bayesian
modelling approach. PLoS Negl. Trop. Dis. 11, e0005767 (2017).
10. ProMED, Rift Valley fever—Kenya (02): (Wajir). Published date: 2018-06-09. Archive 20180609.5847216 (2018). https://promedmail.org/promed-posts/. Accessed 5 De-cember 2019.
11. Food and Agriculture Organization of the United Nations, EMPRES-i. Global Animal Disease Information System. empres-i.fao.org/eipws3g/. Accessed 11 December 2019. 12. A. Kwasiborski et al., Molecular investigation of Rift Valley fever outbreak in
Mayotte, 2018 (2019).
https://programme.europa-organisation.com/slides/pro-gramme_ricai-2019/CO-095.pdf. Accessed 20 March 2020.
13. Direction de l’Alimentation, de l’Agriculture et de la Forêt de Mayotte, Recensement Agricole 2010 (2010). daaf.mayotte.agriculture.gouv.fr/Recensement-Agricole-2010, 23. Accessed 7 July 2020.
14. EFSA Panel on Animal Health and Welfare, Rift Valley fever: Risk of persistence, spread and impact in Mayotte (France). Scientific opinion. EFSA J. 18, e06093 (2020).
15. ProMED, Rift Valley fever—Mayotte (12): Human, cattle. Published date: 2019-05-28.
Archive 20190528.6489852 (2019). https://promedmail.org/promed-posts/. Accessed 9 March 2020.
16. Agence Régionale de Santé, Communiqués et dossiers de presse de l’ARS Mayotte (2020). https://www.mayotte.ars.sante.fr/communiques-et-dossiers-de-presse-de-lars-mayotte. Accessed 15 July 2020.
17. K. J. Linthicum, S. C. Britch, A. Anyamba, Rift Valley fever: An emerging mosquito-borne disease. Annu. Rev. Entomol. 61, 395–415 (2016).
18. AFSSA, Avis de l’Agence Française de Sécurité Sanitaire des Aliments sur le risque de
propagation de la fièvre de la Vallée du Rift (FVR) dans un département et une
collectivité départementale français de l’Océan Indien (la Réunion et Mayotte) (2008).
https://www.anses.fr/fr/system/files/SANT-Ra-Rift.pdf. Accessed 2 May 2020. 19. G. Le Goff, S. M. Goodman, E. Elguero, V. Robert, Survey of the mosquitoes (Diptera:
Culicidae) of Mayotte. PLoS One 9, e100696 (2014).
20. R. Sang et al., Effects of irrigation and rainfall on the population dynamics of Rift Valley fever and other arbovirus mosquito vectors in the epidemic-prone Tana River County, Kenya. J. Med. Entomol. 54, 460–470 (2017).
21. C. Talla et al., Statistical modeling of the abundance of vectors of West African Rift Valley fever in Barkédji, Senegal. PLoS One 9, e114047 (2014).
22. D. Diallo et al., Temporal distribution and spatial pattern of abundance of the Rift Valley fever and West Nile fever vectors in Barkedji, Senegal. J. Vector Ecol. 36, 426–436 (2011).
23. L. Xue, H. M. Scott, L. W. Cohnstaedt, C. Scoglio, A network-based meta-population approach to model Rift Valley fever epidemics. J. Theor. Biol. 306, 129–144 (2012). 24. C. M. Barker, T. Niu, W. K. Reisen, D. M. Hartley, Data-driven modeling to assess
re-ceptivity for Rift Valley fever virus. PLoS Negl. Trop. Dis. 7, e2515 (2013). 25. M. L. Danzetta, R. Bruno, F. Sauro, L. Savini, P. Calistri, Rift Valley fever transmission
dynamics described by compartmental models. Prev. Vet. Med. 134, 197–210 (2016). 26. M. J. Turell, C. A. Rossi, C. L. Bailey, Effect of extrinsic incubation temperature on the ability of Aedes taeniorhynchus and Culex pipiens to transmit Rift Valley fever virus. Am. J. Trop. Med. Hyg. 34, 1211–1218 (1985).
27. J. F. Brubaker, M. J. Turell, Effect of environmental temperature on the susceptibility of Culex pipiens (Diptera: Culicidae) to Rift Valley fever virus. J. Med. Entomol. 35, 918–921 (1998).
28. G. Lo Iacono et al., Environmental limits of Rift Valley fever revealed using ecoepi-demiological mechanistic models. Proc. Natl. Acad. Sci. U.S.A. 115, E7448–E7456 (2018).
29. R. Métras et al., Transmission potential of Rift Valley fever virus over the course of the
2010 epidemic in South Africa. Emerg. Infect. Dis. 19, 916–924 (2013).
30. H. J. Esser et al., Risk factors associated with sustained circulation of six zoonotic ar-boviruses: A systematic review for selection of surveillance sites in non-endemic areas. Parasit. Vectors 12, 265 (2019).
31. S. C. Mpeshe, H. Haario, J. M. Tchuenche, A mathematical model of Rift Valley fever with human host. Acta Biotheor. 59, 231–250 (2011).
32. J. Lugoye, J. Wairimu, C. B. Alphonce, M. Ronoh, Modeling Rift Valley fever with
treatment and trapping control strategies. Appl. Math. 7, 556–568 (2016).
33. B. N. Archer et al., Epidemiologic investigations into outbreaks of Rift Valley fever in humans, South Africa, 2008–2011. Emerg. Infect. Dis. 19, 1918–1925 (2013). 34. L. Nyakarahuka et al., Prevalence and risk factors of Rift Valley fever in humans and
animals from Kabale district in Southwestern Uganda, 2016. PLoS Negl. Trop. Dis. 12, e0006412 (2018).
35. M. A. Kenawy, Y. M. Abdel-Hamid, J. C. Beier, Rift Valley fever in Egypt and other African countries: Historical review, recent outbreaks and possibility of disease oc-currence in Egypt. Acta Trop. 181, 40–49 (2018).
36. H. Hoogstraal, J. M. Meegan, G. M. Khalil, F. K. Adham, The Rift Valley fever epizootic in Egypt 1977–78. 2. Ecological and entomological studies. Trans. R. Soc. Trop. Med. Hyg. 73, 624–629 (1979).
37. T. Lernout et al., Rift Valley fever in humans and animals in Mayotte, an endemic situation? PLoS One 8, e74192 (2013).
38. L. Cavalerie et al., A stochastic model to study Rift Valley fever persistence with dif-ferent seasonal patterns of vector abundance: New insights on the endemicity in the tropical island of Mayotte. PLoS One 10, e0130838 (2015).
39. G. Nicolas, V. Chevalier, L. M. Tantely, D. Fontenille, B. Durand, A spatially explicit metapopulation model and cattle trade analysis suggests key determinants for the recurrent circulation of Rift Valley fever virus in a pilot area of Madagascar highlands. PLoS Negl. Trop. Dis. 8, e3346 (2014).
40. J. M. Gachohi, M. K. Njenga, P. Kitala, B. Bett, Modelling vaccination strategies against Rift Valley fever in livestock in Kenya. PLoS Negl. Trop. Dis. 10, e0005049 (2016). 41. T. Kimani et al., Public health benefits from livestock Rift Valley fever control: A
simulation of two epidemics in Kenya. EcoHealth 13, 729–742 (2016).
42. M. Pepin, M. Bouloy, B. H. Bird, A. Kemp, J. Paweska, Rift Valley fever virus (Bunya-viridae: Phlebovirus): An update on pathogenesis, molecular epidemiology, vectors, diagnostics and prevention. Vet. Res. 41, 61 (2010).
43. D. Wright, J. Kortekaas, T. A. Bowden, G. M. Warimwe, Rift Valley fever: Biology and epidemiology. J. Gen. Virol. 100, 1187–1199 (2019).
44. World Health Organization, R&D blueprint: Target product profiles for Rift Valley fever virus vaccines, Version 3 (2019). https://www.who.int/docs/default-source/blue-print/call-for-comments/tpp-rift-valley-fever-vaccines-draft3-0pc.pdf?
sfvrsn=f2f3b314_2. Accessed 6 March 2020.
45. B. Dungu, B. A. Lubisi, T. Ikegami, Rift Valley fever vaccines: Current and future needs. Curr. Opin. Virol. 29, 8–15 (2018).
46. European Centre for Diseases Prevention and Control, Rift Valley fever outbreak in Mayotte, France. Rapid risk assessment (2019).
https://www.ecdc.europa.eu/sites/de-fault/files/documents/RRA-Rift-Valley-fever-Mayotte-France-March-2019.pdf.
Ac-cessed 17 March 2020.
47. I. Scoones et al., Integrative modelling for one health: Pattern, process and partici-pation. Philos. Trans. R. Soc. Lond. B Biol. Sci. 372, 20160164 (2017).
48. B. H. Bird, D. A. Bawiec, T. G. Ksiazek, T. R. Shoemaker, S. T. Nichol, Highly sensitive and broadly reactive quantitative reverse transcription-PCR assay for high-throughput detection of Rift Valley fever virus. J. Clin. Microbiol. 45, 3506–3513 (2007).
49. H. Youssouf et al., Rift Valley fever outbreak, Mayotte, France, 2018–2019. Emerg.
Infect. Dis. 26, 769–772 (2020).
50. J. Kortekaas et al., European ring trial to evaluate ELISAs for the diagnosis of infection with Rift Valley fever virus. J. Virol. Methods 187, 177–181 (2013).
51. Météofrance, Données décadaires agrométéorologiques (2019).
https://donneespu-bliques.meteofrance.fr/?fond=produit&id_produit=113&id_rubrique=37. Accessed
23 September 2019.
52. Institut National de la Statistique et des Études Économiques, Habitants à Mayotte (2017). https://www.insee.fr/fr/statistiques/3286558#documentation. Accessed 5 Oc-tober 2019.
53. A. Camacho, S. Funk, fitR: Tool box for fitting dynamic infectious disease models to time series (R package, Version 0.1). https://sbfnk.github.io/fitR/. Accessed 1 July 2020.