HAL Id: ird-00270873
https://hal.ird.fr/ird-00270873
Submitted on 7 Apr 2008
HAL is a multi-disciplinary open access archive for the deposit and dissemination of sci-entific research documents, whether they are pub-lished or not. The documents may come from teaching and research institutions in France or abroad, or from public or private research centers.
L’archive ouverte pluridisciplinaire HAL, est destinée au dépôt et à la diffusion de documents scientifiques de niveau recherche, publiés ou non, émanant des établissements d’enseignement et de recherche français ou étrangers, des laboratoires publics ou privés.
Adaptation of fisheries sonar for monitoring schools of
large pelagic fish : dependence of schooling behaviour on
fish finding efficiency
Patrice Brehmer, S. Georgakarakos, Erwan Josse, V. Trygonis, J. Dalen
To cite this version:
Patrice Brehmer, S. Georgakarakos, Erwan Josse, V. Trygonis, J. Dalen. Adaptation of fisheries sonar for monitoring schools of large pelagic fish : dependence of schooling behaviour on fish finding efficiency. Aquatic Living Resources, EDP Sciences, 2007, 20 (4), pp.377-384. �10.1051/alr:2008016�. �ird-00270873�
Aquatic Living Resources. 2007, 20, 4, p. 377-384
Adaptation of fisheries sonar for pelagic fish school monitoring: dependency of the schooling behaviour on the ‘fish finding’ efficiency
Patrice Brehmer ¹,*, Stratis Georgakarakos ², Erwan Josse 3, Vasilis Trygonis ², John Dalen4 ¹ University of the Aegean/Co IRD-UR109, Centre de Recherche Halieutique Méditerranéenne et Tropicale, 1 Avenue Jean Monnet, BP 171, 34 203, Sète, France ² University of the Aegean, Fisheries and Sonar Laboratory, University Hill, 81100 Mytilini,
Greece
3 Institut de Recherche pour le Développement, US004, Centre de Bretagne, BP 70, 29 280, Plouzané, France
4 Institute of Marine Research, P.O. Box 1870, Nordnes 5817, Bergen, Norway
Abstract - Multibeam omnidirectional sonars allow the monitoring of pelagic fish schools
surrounding the platform and are currently used by fishermen. Multibeam processing methods offer improved abilities for raw data storage. For the detection of fish schools associated with drifting Fish Aggregating Devices (FADs), the Simrad SP90 sonar has been used. Digital systems have been developed for the acquisition and processing of volume backscattering echoes and position data. Sampling method was defined according to two modes: during searching periods for FADs and associated schools, and during school monitoring in drifting mode. Validation of several FAD-associated schooling species detection was made by simultaneous visual observations or/and cross-checks with echosounder recordings. The characteristics of the targeted fish species’ schooling behaviour are fundamental in order to avoid misleading acoustic data interpretation. The sonar detection threshold is the result of a compromise between fish number, size, species and the nearest neighbour distance (NND) of individuals per dynamic structure (school and shoal). In agreement with the tuna schooling dynamics, their NND can sometimes be too large for detecting their presence notwithstanding their number. The sonar data should be analysed and interpreted in a holistic approach, in combination with the behaviour pattern and the dynamics of all species around the drifting FADs. An autonomous sonar buoy prototype equipped with 360° scanning sonar coupled to video cameras will increase our understanding of tuna behaviour around drifting or anchored objects. A similar methodology can be applied to various platforms, either anchored or in a permanent position, promoting the monitoring of fish schools around artificial reefs or open sea aquaculture farms, across estuaries, channels and straits, which is undoubtedly essential for fisheries management.
Résumé - Les sonars omnidirectionnels multifaisceaux, couramment utilisés par les pêcheurs, permettent le suivi et la surveillance des bancs de poissons pélagiques qui évoluent aux alentours de la plateforme d’étude. L’exploitation des données de ce type de sonar était basée sur des techniques d’analyse d'image, le développement d'une nouvelle génération de sonar offre désormais des capacités élevées de stockage, l’accès aux données brutes et donc a des analyses plus précises. Un sonar Simrad SP90 a été utilisé pour détecter des bancs de poissons associés à des Dispositifs de Concentration de Poissons (DCPs). La collecte des données a été réalisée pendant les périodes de recherche des DCPs et des bancs associés, puis pendant l’observation de ces bancs en dérive. La validation des détections a été réalisée à partir d’observations visuelles menées en parallèle avec des enregistrements sondeurs. La connaissance du comportement des espèces est fondamentale afin d'éviter une interprétation erronée des données acoustiques. Pour une structure dynamique, banc ou agrégation, le seuil de détection du sonar est le résultat d'un compromis entre le nombre de poissons, la taille, l’espèce et la distance au plus proche voisin. Cette distance est parfois trop grande pour détecter les poissons malgré leur nombre. Une bouée autonome équipée d’un sonar à balayage sur 360° et de caméras vidéo devrait permettre d’améliorer les connaissances sur le comportement des thons autour d’objets ancrés ou dérivants. Les données sonar doivent être analysées et interprétées par une approche holistique, en combinaison avec les schémas comportementaux et la dynamique de toutes les espèces présentes autour des DCPs. Une méthodologie similaire est reproductible à divers types de plateformes (dérivante, ancrée ou fixe) destinées à l’étude des bancs de poissons autour des récifs artificiels ou des fermes d'aquiculture, dans les estuaires, les chenaux ou les détroits, et fournir ainsi des informations indubitablement essentielles à la gestion des pêcheries.
Mot clefs : Système autonome / Comportement / Bouée / FAD / Banc de poissons / Sonar / Thon
1 Introduction
The interest in omnidirectional acoustic data in fisheries science is broad, particularly when a behavioural question occurs concerning pelagic fish schools (Brehmer et al. 2006a). Horizontal 2D omnidirectional sonar data can be complimentarily used with information delivered by echosounders and high resolution 3D sonars (Mackinson et al. 1999; Brehmer et al. 2002), and relevant studies have led to several important outcomes concerning fish schools such as avoidance behaviour (Goncharov et al. 1989), kinematics (Misund 1990), migration (Hafsteinsson and Misund 1995), spatial structure (Petitgas et al. 1996) or residence time around an artificial reef (Brehmer et al. 2003). Limitations however in the use of multibeam sonars are usually due to the lack of direct access to the acoustic signal, and the implications that this has on the quantification of the acoustic measurement.
This paper presents results produced within the European research project FADIO on sonar raw data analysis, using a Simrad SP90 omnidirectional sonar system (Brehmer et al. 2005). The overall aim of the project is to ‘create observatories of pelagic ecosystems by developing prototypes of new autonomous instruments: electronic tags and instrumented buoys’ (www.fadio.ird.fr). Five acoustic surveys were conducted for the development of an adapted methodology on the detection of pelagic schooling species, mainly tropical tuna, associated with Fish Aggregating Devices (FADs). FADs can be artificial such as those set by fishermen typically made of a bamboo raft and net, or natural such as coconuts, pieces of wood or any other floating object (Fedoryako 1988; Dempster and Taquet 2004; Dagorn et al. 2007). In the context of worldwide exploitation (Fonteneau et al. 2000) and in cases where hypotheses concerning fish school behaviour arise (Fonteneau et al. 2000; Marsac et al. 2000; Fréon and Dagorn 2000; Castro et al. 2001), solid validations are required using efficient in situ information.
Expected results from these experiments were the definition of specific sonar parameters, sampling methodology, data storage protocols and processing methods, particularly in the context of an autonomous sonar buoy system, where real-time data transmission and analysis is needed. Acoustic information from the sonar system is compiled though a dedicated software tool (Trygonis and Georgakarakos 2007a), providing quantitative descriptors of the pelagic schools aggregated around FADs. The schooling behaviour of targeted species plays a key role in proper understanding of sonar data, which is in this work underlined in order to avoid misleading interpretation.
2 Material and method
Digital raw data collection
The acoustic device used was a Simrad SP90 medium-range multibeam omnidirectional sonar, identical to the equipment employed for the detection of tuna schools by the main fishing fleets operating in the Indian Ocean. The SP90 acoustic transmission is the same as in previous-generation omnidirectional sonars, such as the Simrad SR240 (SIMRAD 1992). However on this new version it is possible to select the emission frequency between 20 to 30 kHz and the 32 horizontal beams (11.25°: see the beam pattern in annex 2) are split in two parts (SIMRAD 2004). Moreover, the SP90 offers direct access to the acoustic signal through a new scientific digital output (SIMRAD 2003; 2004) that has been used within the project. This last change and the availability of protocols for multibeam sonar calibration (Foote et al. 2005) make the unit usable as a key fisheries research acoustics device.
All procedures of the built-in test system were checked (i.e. checks of the target and ship marker, view menu, bridge function and the sonar room functions when tested according to the constructor procedures (SIMRAD 2004)). The self-noise test was performed, producing a measured echo level of -43 dB, which matched the expected value. The alignment of the sonar picture was validated, peripheral equipment were tested, and the signals from all the
external sensors were successfully interfaced to the sonar system (speed log, course gyro and Global Positioning System - GPS) (Palud and Brehmer 2004). In this new version (vs. SR240 model for example) a GPS is used for the localisation of geographic markers, which replaces the traditional gyrocompass reference. The vertical echosounders’ (Table 1) acoustic transmission rates were not synchronised with the SP90, however the sonar data did not show any interferences during full operation. Nonetheless, the sonar caused interference rays on the sounder echograms at 38, 70 and 120 kHz, which could be avoided by the use of a central synchronisation system. Due to the narrow tilt angle used during the operation of the SP90 transducer, a specular emission is expected by tuna schools and therefore the commonly applied for acoustic integration 20 Log R Time Varied Gain (TVG) function was replaced by 30 Log R, which is more appropriate for this particular situation.
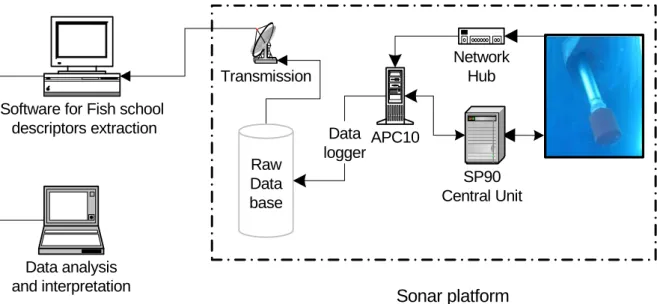
The scientific output of the SP90 sonar is a binary file per ping transmission, which contains one data block with the acoustic data telegram and certain blocks with metafile and sonar settings information. These blocks hold various variables such as range, transmission power, pulse length, tilt angle, stabilization, Global Positioning System, etc. (see SIMRAD 2003 for extended list of parameters). The data block consists of a 256×64 matrix (256 cells per beam) of the digitized backscatter coded in 64 logarithmic scale levels [0-63]. The detailed data acquisition flow diagram is illustrated in Fig. 1. Both the video (bitmap) and the digital form (binary files) of the sonar output were concurrently stored, for validation of sonar telegram extraction.
The main targeted fish species during FADIO acoustic surveys were the exploited tropical tunas: Skipjack Tuna (Katsuwonus pelamis, Linnaeus 1758), Yellowfin Tuna (Thunnus
albacares, Bonnaterre 1788), and Bigeye Tuna (Thunnus obesus, Lowe 1839), which
represent landings of more than 200 000 tons of annual catch in the western Indian Ocean. Sonar experiments have been conducted during five acoustic surveys carried out in the
western Indian Ocean around the Seychelles Islands, onboard the Indian Ocean Explorer (35 m). On a regular basis during sonar observations, echo sounder multi-frequency records were simultaneously logged (38 kHz, 2000 W; 70 kHz, 1000 W; 120 kHz, 1000 W), with a pulse duration of 0.512 ms and a beam angle of 7° for the three transducers. During the first cruise ‘Fadio1’, the sonar was pole-mounted aside the vessel hull, and then hull-mounted for the four next surveys (Table 1).
Sampling method and adapted sonar parameters
The primary goal of the surveys was to use the sonar system in order to reach the FAD (the underwater structure is usually voluminous, covered with important biofouling and always accompanied by individual fish and schools at short distance (Fedoryako 1988)), and then to look for biological echoes of associated fish schools. Sonar scanning was carried out by applying two different groups of settings: (1) ‘searching mode’ during searching periods for fish schools and FADs, and (2) ‘FAD and School mode’ when monitoring fish schools around the FADs.
• The ‘searching mode’ was applied while vessel cruising. Full automation was selected i.e. automatic Frequency Modulation ‘FM mode’, Automatic Gain Control filter ‘AGC’, Reverberation Gain Control ‘RCG’ and echo interpolation were all enabled. The sonar range was set to 3000 m, aided by visual detection using long-range binoculars for spotting sea birds or floating objects. The sonar tilt angle was set according to sea conditions between 0° (in good condition i.e. low wind and swell) to -6°.
• The ‘FAD and school mode’. The vessel was stopped near the FAD at a distance of 50 to 300 m, except for special experiments during the ‘Fadio2’ cruise, where the sonar vessel was moored aside the FAD indrift mode (Brehmer et al. 2000; 2006b),
‘imitating’ the behaviour of a buoy and observing continuously the fish schools. Contrarily to the ‘searching mode’, all automation was disabled, the transmission form was continuous wave ‘CW’ mode. The sonar range was limited to 1200 m in good sonar conditions (Misund et al. 1992), and 800 m in bad conditions. The tilt angle followed the school’s vertical displacement in case of single-school monitoring. In order to maximize the success of school detection the tilt varied between 0° to -25°, according to the typical depth of the targeted fish species. In case of high current speed, the vessel had to be stationed in a position allowing passages near the FAD, in order to maximize the duration of target presences in the beam field.
Data analysis
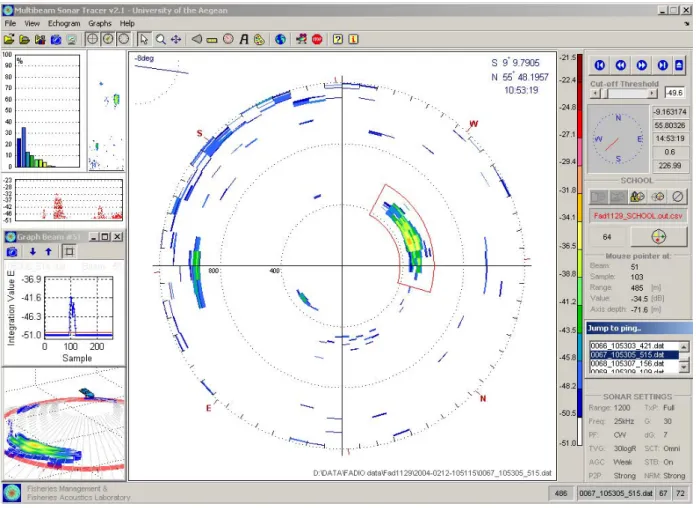
Following the sonar picture analysis knowledge (Gerlotto et al. 2001; Brehmer et al. 2006b) a dedicated software was developed in Matlab and C++, the ‘Multibeam Sonar Tracer’ (MST), which allowed the processing of the SP90 binary files (Trygonis and Georgakarakos 2007a) (Fig. 2). The MST integrates algorithms for school identification and tracking, 3D visualisation of school and vessel trajectories, and can output the respective sonar telegrams (beam data, sonar settings, GPS status) in ASCII-formatted files. The school dimensions (Fig. 3a and 3b) are calculated using algorithms from Misund (1990) (see equations 1 and 2 in annex 1), while the distance to the encountered schools (Average School Range - ASR in m) is measured according to sonar accuracy, which is always 1/256 of the operation range (Fig. 3c). Two school swimming speeds can be estimated based on the SP90 telegram data: the instantaneous speed and the exploration speed (Brehmer et al. 2006b; Trygonis and Georgakarakos 2007b). The fish school acoustic density is calculated per school and for the whole echogram according to a user-defined threshold, adapted to the environment and the sonar acquisition settings.
The underlying assumption of the tracking algorithm is that although fish schools do change shape, size and position with time, these changes are expected to be minor in the limited time interval between two successive insonifications. Thus, the tracking routine is able to recognize identical schools in successive pings (under the assumption that pitch and roll was efficiently compensated by the stabilization system (Simrad 2004) and that all ping transmission were synchronized), applying appropriate ping-to-ping school matching criteria, such as the distance from sonar, horizontal displacement per unit time and area difference. The tracking algorithm of the MST software identifies in each ping the corresponding traces of each moving target and calculates a log protocol of the school tracking paths (Trygonis and Georgakarakos 2007b). The data processed herein represent a total of 728 successive insonifications, which correspond to approximately 20 minutes of continuous data logging. The number of acoustic detections per ping varies with time in data sets, especially if small echoes (area < 100 m2) are not filtered out during the execution of the algorithm (Fig. 4). For that very low school-area filter used during the scanning, the majority of the encountered echoes in the specific dataset are smaller that 300 m2, while larger echoes are detected in ranges between 500 and 1100 m. We present as example the information extracted on a tuna fish school near a FAD (Table 2). The software can calculate the average school density Sv in dB if the Automatic Gain Control (AGC) was disabled, otherwise the density estimator is expressed in relative values, representing the 64 colour levels of the raw beam data.
3 Results
The detection of the three main exploited tuna species K. pelamis, T. albacares and T. obesus was validated during our surveys. Large tuna fish schools were usually observed isolated which go with several small school (on a sampling area of more than one km²), which is different from small pelagic fish that usually occur in school clusters (Haugland and Misund
2004), i.e. including several large compact fish schools on a same sampling surface (around one km²).
The pelagic compact fish schools are characterised by small nearest neighbour distance ‘NND’ (≅ 1 Body Length ‘BL’; i.e. ≅ 10 to 30 cm) between the members of the same school. For the exploited tuna school the BL is longer, typically being between 40 to 100 cm, more than twice of the small pelagic one. The NND in ‘shallow schools’ (Josse et al. 2000) is also around 1 BL, inside the ‘intermediate scattered fish’ is over 30 BL and inside the ‘deep scattered fish’ is over 240 BL (Josse et al. 2000). The presence of low density tuna schools is not indicated by the sonar using the ‘FAD and school’ mode sonar setting, which corresponds to the ‘deep scattered fish’ in opposition with the ‘shallow schooling fish’ well detected. We have encountered a small (< 6 m diameter) school of K. pelamis (fish without swimbladder i.e. low fish Target Strength), in ‘balbaya’ (observed in surface layers (Gaertner et al. 1996)) observed visually in the surface during bad sea condition, that was not detected at a sonar range of 800 m (hand line specimen caught: FL 25-30 cm; Com. Pers. David Itano). According to the tuna schooling dynamics, the NND can be too large to generate a target above the detection threshold, as the fish school could be too small, under the detection threshold. Nevertheless according professional fishing operation around FAD observations (Miquel et al. 2006), the tuna caught occur in detectable fish school around FAD.
The school detection threshold, which define part of the ‘fish finding’ efficiency, is the result of a compromise between fish number, size and NND, which generate the acoustic response characteristics of the targeted schools; knowing that acoustics response depend on the school species composition. The position of the school inside the beam has obviously an impact on the sonar detection (Fig. 3), as its gravity centre was situated on the ‘- 3dB’ acoustic beam or not. Consecutively only large or/and dense tuna fish schools could be detected, which constitute the main part of fish biomass. It was not possible to detect large tuna schools
around FADs during our five surveys (except for a single instance, however the experiment was interrupted by an operating fishing vessel, since the coordinates of artificial FADs are known to the fishermen). An alternative is to visit areas that are less visited by the fishing fleets, and increase the research vessel’s speed and autonomy.
Apart from tuna, dense schools of flying fish have been detected (verified by visual sightings at short range). To our knowledge, this is the first time dense concentrations of flying fish have been observed by sonar, while other species such as triggerfish and clupeids were detected around the FAD. More interesting is the whale detections and dolphin (spp.) groups (validated by visual observations), observed as distinct sonar echoes both close to drifting FADs (Brehmer et al. 2006b) and while cruising, which will promote mammal studies and monitoring using our medium range sonar. During transit between FADs, ecologically valuable and interesting observations such as free swimming fish schools of unidentified species were also recorded. Lastly, observations by echosounders of a deep scattering layer at relatively shallow depth (> 50-100 m) in some areas during late evening and night could generate misleading echoes of fish schools, without cross check with echo sounder detections (Misund and Coetzee, 2000) or other complementary method of fish observation.
4 Discussion
The medium-range omnidirectional sonar can be used, under variable conditions, to record large tuna aggregations encountered in the pelagic environment and describe their relationship to an object, which in this particular case is the drifting FAD. Obviously, species discrimination is an important point in order to achieve this goal, since there are multiple associated species which occur in fish schools, shoals or as individual fish (Pitcher 1986) whereas one structure could be monospecific or multispecific, or could switch between forms. Therefore, it is sometimes difficult to properly identify which species are being
observed by the sonar. In these cases nevertheless, the observations can be used in terms of acoustic populations (Rose and Legget 1988; Gerlotto 1993), where the main part of the fish biomass is already known. Visual observations above and below the surface, qualitative echosounder recordings, and underwater visual ‘post-observation’ (by video) were necessary for the identification of the correct species observed. Even so, the combination of both acoustic devices used during the FADIO surveys (i.e. multi frequency scientific echosounders and multibeam sonar) conditionally permits - in case of high tuna abundance - to validate the presence of tuna. In our case study, this was performed via the echosounder Target Strength analysis (Josse and Bertrand, 2000), and the empirical knowledge of echo trace characteristics such as shape and depth, coupled with the sonar school detection.
Tang et al. (2006) have shown that omnidirectional sonars provide more accurate results in a fixed position rather than in cruising mode, which validates the choice of a buoy system for sonar monitoring. Such an autonomous system offers valuable information concerning the behavioural characteristics of tuna schools, i.e. (1) the mean time spent near the FAD, (2) the mean speed of schools moving around, towards or outwards from the FAD (Miquel et al. 2006), and (3) their aggregative behaviour.
Directly around the FAD, very small aggregations and individual fish, situated at very close distance to the sonar FAD buoy, the intranatant fish usually < 50 cm length (Castro et al. 2001) and the closer part of extranatants (Parin and Fedoryako 1999) ones, are too small for the sonar resolution, and out or inside the near-field signal. Thanks to transparency of tropical oceanic waters, visual census permits the investigations at close distance to the buoy system (Relini et al. 2000; Taquet 2004). A 360° video camera system can play such role as fish diversity and abundance is usually very low and close to the surface (depth < 10 m) and often in clear water (Brehmer et al. 2005). For this reason it is interesting to implement a web of three video cameras with the sonar buoy system. The sonar resolution chosen in our case
was selected to focus on large fish school (extranatant and circumnatant fishes), which represents the bulk of fish biomass targeted by fishermen, around the FAD (i.e. for anchored FAD 0.3 mn (Josse et al. 2000; Doray et al. 2006)). In any case the sonar data should be analysed and interpreted in a holistic approach, in combination with the behavioural pattern and the dynamic of all species of school and shoal present around the drifting FADs, knowing that some of these fish structures could be multi-specific.
5 Conclusion
The sonar system is a key tool for the detection and behavioural observations of pelagic fish schools, which represent the main pelagic fish biomass all around the world. According to the empirical in situ observations, fish schooling behaviour (Brehmer et al. 2007) plays an important role on fish detection validity, and particularly with tuna species around FADs, where three distinct type of aggregations occur, and the packing density (Misund et al. 1992) is highly variable (Josse et al. 2000). Algorithms in the direction of efficient detection threshold, school tracking and species identification are highly required for biological data interpretation; such research also requires in situ behavioural observations at sea, adapted to the respective situation (i.e. according to weather condition and biomass quantity and diversity). The next step in data processing is to convert a sonar system mounted on a drifting (or fixed) buoy in a ‘clever’ autonomous observatory of the pelagic ecosystem i.e. biological target recognition below ambient acoustic noise and interferences (see Brehmer et al. 2006a, for a complete list of limitations). The validation of sonar settings also requires additional experiments at sea, if the abilities of sonar detection are to be optimized. Accurate sonar technology is now operational (Andersen et al. 2006); this technology however needs large vessels, and can not be used autonomously at the present time. New pulse form in hyperbolic frequency modulation, introduce on modern fisheries sonar (Simrad 2007), should provide a
better accuracy of school definition (vs. continuous wave pulse form). The power consumption is a serious limitation in the case of an open ocean drifting buoy system, which leads to the use of a 360° scanning sonar system at higher frequencies that reduces power consumption, with the drawback of reducing the scale and the advantage of increasing the resolution. The data storage of raw binary fisheries omnidirectional sonar data is now operational and completed by the development of dedicated software for data extraction. The problem of picture data storage is surmounted in that way, enabling continuous data collection via internal hard disks, or data transmission by radio or satellite systems (e.g. GSM, UMTS, Argos) according to the surrounding environment (open sea, coastal or inshore areas). Indeed, the application of the presented methodology – orientated towards schools associated to a drifting FAD – can be used for studying the effect of artificial reef on fish attraction (Brehmer et al. 2003) and to the effect of aquaculture sea-cage farm on local fish repartition (Dempster et al. 2002). Other field studies such as school passage inside large estuaries and channels (Pedersen and Trevorrow 1999), or in the migration process occurred in Straits (like for Thunnus thynnus in Gibraltar, Com pers. Jean-Marc Fromentin), will permit to inform the scientists on phenomenon of major importance that are poorly documented.
Acknowledgements
This work has been supported by the European Union; project ‘FADIO’ (Contract QLRI-CT-2002-02773). We are grateful to Laurent Dagorn (IRD), which gave us the great opportunity of knowledge transfer from small pelagic fish monitoring towards tropical tuna species, and to François Gerlotto for its corrections and comments. We also are grateful to the crew of the Indian Ocean Explorer (Captain Francis Roucou) and the helpful technical support of Pierre Palud and Christophe Corbières (Simrad Europe France).
References
Andersen L.N., Berg S., Gammelsæter O.B., Lunde E.B., 2006, New scientific multibeam systems for fisheries research applications. In: Jesus S.M. and Rodriguez O.C. (Eds), Proceedings of the Eighth European Conference on Underwater Acoustics, 8th ECUA, 385-386.
Brehmer P., Gerlotto F., Samb B., 2000, Measuring fish avoidance during surveys. ICES CM 2000/K:07.
Brehmer P., Gerlotto F., Rouault A., 2002, In situ inter-standardisation of acoustic data: an integrated database for fish school behavioural studies. Acta Acoustica 88, 730-734. Brehmer P., Gerlotto F., Guillard J., Sanguinède F., Guénnegan Y., Buestel D., 2003, New
applications of hydroacoustic methods for monitoring shallow water aquatic ecosystems: the case of mussel culture grounds. Aquat. Living Resour. 16, 333-338.
Brehmer P., Aumeeruddy R., Itano D., Taquet M., Gerlotto F., Sanchez G.. 2005, Simultaneous under water digital video recording and multibeam sonar monitoring of FADs and artificial reef in eastern Indian Ocean. In: Papadakis J.S. and Bjorno L. (Eds) Proceedings of the International Conference “Underwater acoustic measurements: technologies and results”, 6 pp.
Brehmer P., Lafont T., Georgakarakos S., Josse E., Gerlotto F., Collet C., 2006a, Omnidirectional multibeam sonar monitoring: Applications in fisheries science. Fish and Fisheries 7, 165-179.
Brehmer P., Josse E, Nøttestad L., Lebourges-Dhaussy A., 2006b, Real-time detection of whales visiting drifting FADs and associated fish species, using conventional active acoustics fisheries devices. Colloque Caractérisation du Milieu Marin, Brest, 16-19 octobre 2006. Seatechweek, Résumé des Actes, p. 8
Brehmer P., Gerlotto F., Laurent C., Cotel P., Achury A., Samb B., 2007, Schooling behaviour of small pelagic fish: phenotypic expression of independent stimuli. Mar. Ecol. Prog. Ser. 334, 263-272.
Castro J.J., Santiago J.A., Santana-Ortega A.T., 2001, A general theory on fish aggregation to floating objects: an alternative to the meeting point hypothesis. Rev. Fish Biol. Fish. 11, 255-277.
Dagorn L., Holland K.N., Itano, D.G., 2007, Behaviour of yellowfin (Thunnus albacares) and bigeye (T. obesus) tuna in a network of fish aggregating devices (FADs). Mar. Biol. 151, 595-606.
Dempster T., Taquet M., 2004, Fish aggregation device (FAD) research: gaps in current knowledge and future directions for ecological studies. Rev. Fish Biol. Fish. 14, 21-42. Dempster T., Sanchez-Jerez P., Bayle-Sempere J.T., Giménez-Casalduero F., Valle C., 2002,
Attraction of wild fish to sea-cage fish farms in the south-western Mediterranean Sea: spatial and short-term temporal variability. Mar. Ecol. Prog. Ser. 242, 237-252
Doray M., Josse E., Gervain P., Reynal L., Chantrel J., 2006, Acoustic characterisation of pelagic fish aggregations around moored fish aggregating devices in Martinique (Lesser Antilles). Fish. Res. 82, 162-175.
Fedoryako B.I., 1988, Fish accumulations in the open ocean near stationary buoys. J. Ichthyol. 28, 667–669.
Fonteneau A., Pallarés P., Pianet R., 2000, A worldwide review of purse seine fisheries on FADs. In: Le Gall J.Y., Cayré P., Taquet M. (Eds.), Pêche thonière et dispositifs de concentration de poissons. Ed. Ifremer, Actes Colloq. 28, 15-35.
Foote K.G., Chu D., Hammar T.R., Baldwin K.C., Mayer L.A., Hufnagle L.C., Jech J.M., 2005, Protocols for calibrating multibeam sonar. J. Acoust. Soc. Am. 117, 2013-2027. Fréon P., Dagorn L., 2000, Review of fish associate behaviour: toward a generalisation of the
meeting point hypothesis. Rev. Fish Biol. Fish. 10, 183-207.
Gerlotto F., Hamitouche C., Simmonds E.J., Georgakarakos S., Fernandes P., 2001, Analyse et visualisation tri-dimensionelle des images sonar. Final report, Fair CT 96 1717, CRHMT, Sète.
Gaertner D., Pagavino M., Marcano J., 1996, Utilisation de modèles linéaires généralisés pour évaluer les stratégies de pêche thonière à la senne en présence d’espèces associées dans l’Atlantique ouest. Aquat. Living Resour. 9, 305-323.
Gerlotto F., 1993, Identification and spatial stratification of tropical fish concentrations using acoustic populations. Aquat. Living Resour. 6, 243-254.
Goncharov S.E., Borisenko E.S., Pyanov A., 1989, Jack mackerel schools' defence reaction to a surveying vessel. Proc. Inst. Acoust. 11, 74-78.
Hafsteinsson M.T., Misund O.A., 1995, Recording the migration behaviour of fish schools by multi-beam sonar during conventional acoustic surveys. ICES J. Mar. Sci. 52, 915-924. Haugland E.K., Misund O.A., 2004, Evidence for a clustered spatial distribution of clupeid
fish schools in the Norwegian Sea and off the coast of southwest Africa. ICES J. Mar. Sci. 61, 1088-1092.
Josse E., Bertrand A., 2000, In situ acoustic target strength measurements of tuna associated with a fish aggregating device. ICES J. Mar. Sci. 57, 911-918.
Josse E., Dagorn L., Bertrand A., 2000, Typology and behaviour of tuna aggregations around fish aggregating devices from acoustic surveys in French Polynesia. Aquat. Living Resour. 13, 183-192.
Mackinson S., Nøttestad L., Guénette S., Pitcher T.J., Misund O.A., Fernö A., 1999, Cross-scale observations on distribution and behavioural dynamics of ocean feeding Norwegian spring spawning herring (Clupea harengus L.). ICES J. Mar. Sci. 56, 613-626.
Marsac F., Fonteneau A., Ménard F., 2000, Drifting FADs used in tuna fisheries: an ecological trap? In: Le Gall J.Y., Cayré P., Taquet M. (Eds.), Pêche thonière et dispositifs de concentration de poissons. Ed. Ifremer, Actes Colloq. 28, 537-552.
Miquel J., Delgado de Molina A., Ariz J., Delgado de Molina R., Déniz S., Díaz N., Iglesias M., Santana J.C., Brehmer P., 2006, Acoustic Selectivity in Tropical Tuna (Experimental Purse-seine Campaign in the Indian Ocean). Western and Central Pacific Fisheries Commission, ‘WCPFC-SC2’, FT WP-8; IOTC-2006-WPTT-06, Manila, Philippines, 32 pp.
Misund O.A., 1990, Observation of schooling herring: school dimensions, swimming behaviour and avoidance of vessel and purse seine. Rapp. P.-v. Réun. Cons. Int. Explor. Mer 189, 135–146.
Misund O.A., Aglen A., Beltestad A.K., Dalen J., 1992, Relationship between the geometric dimensions and biomass of schools. ICES J. Mar. Sci. 49, 305-315.
Misund O.A., Coetzee J., 2000, Recording fish schools by multi-beam sonar: potential for validating and supplementing echo integration recordings of schooling fish. Fish. Res. 47, 149-159.
Palud P., Brehmer P., 2004, Montage du SONAR multifaisceaux omnidirectionnel de longue portée SIMRAD SP91–160; Navire: INDIAN OCEAN EXPLORER (Belize) EU project: FADIO, 5th Framework Programme, Research Directorate General; Contract #QLRI-CT-2002-02773. Rapport Technique, CRHMT, Sète. 28 pp.
Parin N.V., Fedoryako B.I., 1999, Pelagic fish communities around floating objects in the open ocean. In: Scott M.D., Bayliff W.H., Lennert-Cody C.E., Schaefer K.M. (Eds.), Proc. Int. Workshop on the Ecology and Fisheries for Tuna Associated with Floating Objects. Inter-American Tropical Tuna Commission Spec. Rep. 11, La Jolla, California, pp. 447-458.
Pedersen B., Trevorrow M.V., 1999, Continuous monitoring of fish in a shallow channel using a fixed horizontal sonar. J. Acoust. Soc. Am. 105, 3126-3135.
Petitgas P., Monimeau L., Brehmer P., Gerlotto F., 1996, Characterizing the spatial distribution of fish schools with a point process approach: a first application on sonar recordings. ICES CM 1996/B:31.
Pitcher T. J., 1986, The behavior of teleost fishes. John Hopkins University Press, Baltimore. 553 pp.
Relini G., Relini M., Montanari M., 2000, An offshore buoy as a small artificial island and a fish-aggregating device (FAD) in the Mediterranean. Hydrobiologia 440, 65-80.
Rose G.A., Legget W.C., 1988, Hydroacoustic signal classification of fish schools by species. Can. J. Fish. Aquat. Sci. 45: 597-604.
SIMRAD 1992, Operator Manual Simrad SR240, Fishery sonar. P2291E Software Version 5.0X.Mar, Simrad Subsea A/S, Horten.
SIMRAD 2003, New Sonar Scientific Data Logger. News Bulletin, Horten Fishery 11. SIMRAD 2004, Simrad SP90 Low frequency long range fishery sonar; Operator
manual.850-164511 / Rev.E, Simrad AS, Horten, Norway 182 pp.
Taquet M., 2004, Le comportement agrégatif des dorades coryphènes (Coryphaena hippurus) autour des objets flottants. Thèse de Doctorat Univ. Paris 6 (France): 168 pp.
Tang Y., Iida K., Mukai T., Nishimori Y., 2006, Estimation of fish school volume using omnidirectional multibeam sonar: scanning modes and algorithms. J. Acoust. Soc. Am. 45(5B), 4868-4974.
Trygonis V., Georgakarakos S., 2007a, Development of a system for monitoring and quantitative estimation of pelagic schools based on multibeam sonars. 13th National Ichthyologists Conference, Mytilini, Lesvos. 257-260.
Trygonis V., Georgakarakos S., 2007b, Investigation of school speed measurement errors by simulation. In: Report, the Working Group on Fisheries Acoustics Science and Technology (WGFAST), ICES Fisheries Technology Committee. ICES CM 2007/FTC:09.
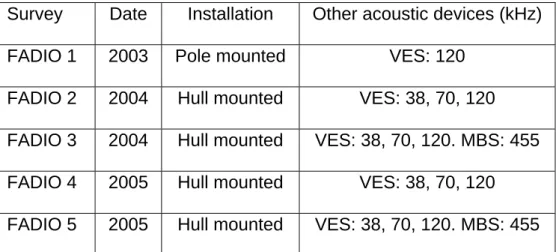
Table : List of the surveys conducted during the FADIO project in the western Indian Ocean, using
omnidirectional sonar, pole and hull mounted, for detection of tuna schools and other associated species around open sea drifting floating objects. Other acoustic devices were used simultaneously: three ‘VES’ Vertical Echo Sounder (Simrad EK60) and one ‘MBS’ Multi-Beam Sonar (Reson Seabat 6012).
Survey Date Installation Other acoustic devices (kHz)
FADIO 1 2003 Pole mounted VES: 120
FADIO 2 2004 Hull mounted VES: 38, 70, 120
FADIO 3 2004 Hull mounted VES: 38, 70, 120. MBS: 455
FADIO 4 2005 Hull mounted VES: 38, 70, 120
Table : Example of school descriptors software extraction from the omnidirectional sonar during the FADIO surveys (FAD number 958). (*) Estimated in dB if the sonar internal Automatic Gain Control ‘AGC’ filter is disabled.
School descriptors by each ping
Code School Descriptor Value Unit
SID School ID by each ping 25 -
NS Number of acoustic samples 186 -
ASR Average school range 523.8 m
ASD Average school density * -49.05 dB
AVEDPTH Average school depth - 68 m
AVEABW Average along-beam width 83.3 m
AVECBW Average cross-beam width 276.1 m
LAT Latitude 4.158135 S degree
Data analysis and interpretation Software for Fish school
descriptors extraction Raw Data base Data logger SP90 Central Unit Network Hub APC10 Sonar platform Transmission
Fig. 1. Description of the tools and methods used to exploit (i.e. acquire, store/transmit, extract and analyze) the raw data delivered by the Simrad SP90 sonar. The doted rectangle denotes the system components that are used during the surveys, and can be mounted either on a fixed or on a drifting platform.
Fig. 2. Graphical user interface of the Multibeam Sonar Tracer software, illustrating the main panel, the multibeam echogram and statistical analysis results of fish schools around a Fish Aggregating Device (refer to Table 2 for school descriptors results).
CW
L
W
(A) (B)
(C)
Fig. 3. Representation of the two sonar dimensions ‘Lw’ along and ‘Cw’ across the beam axis. (A) A school detected inside one of the 64 beams (in orange) that covers the whole beam volume detection area (in red). (B) The effect on the sonar echoes representation when a school crosses two beams: there is an extension of the Cw school dimension. (C) Zoom on a large school echo shape showing the heterogeneity of such biological structure (scale in acoustic intensity = 64 levels).
01:26:450 01:27:46 01:28:45 01:29:45 01:30:45 01:31:46 50 100 150 200 250 UTC time S c ho ol s p e r pi n g
AGC: off AGC: w eak Thr.= 0 Thr.= -51.2dB Thr.= -51.2dB & Area > 100m2
Fig. 4. Number of schools per ping for two Automatic Gain Control ‘AGC’ filter modes: disabled ‘●’ and enabled ‘Ì’ within a range of 600 m (frequency of 26 kHz and a tilt angle of 0°); the peak at time ~ 01:29:30 represent the change from disabled to enabled (in weak position). The black line represents the number of detected schools per ping if no threshold is used; the blue line is with colour threshold 6 = -51.2 dB, the red line is with the same colour threshold and with small targets (artefacts) smaller than 100 m2 filtered out.
Annex 1:
Formulae for school dimension
The equation 1 and 2, from Misund (1990), allow calculating the along beam dimensions and the (2) across beam dimension ‘Cw’ (Fig. 2), as:
Lwcorr=Lwa* cos T – (ct/2) (1)
Cwcorr= Cwa - 2 Rn * tan (B/2) (2) With
T: tilt angle
C: sound celerity (m.s.-1) t: pulse length (ms)
Rn: distance to the target (m) B: horizontal beam width (°)
Annex 2:
Beam pattern of the SP 90 omnidirectional sonar
Beam pattern at 26 kHz for the SP90 sonar (A) as transmitter (B) and receiver omnidirectional horizontal and as (C) transmitter normal single beam with its sidelobes (Com. Pers. from Christophe Corbières, Simrad Europe, 2004).
Transmitter Beam Pattern -40 -30 -20 -10 0 180 -30 150 -60 120 -90 90 -120 60 -150 30
(A)
Receiver Beam Pattern
-40 -30 -20 -10 0 180 -30 150 -60 120 -90 90 -120 60 -150 30 (B)Transmitter Beam Pattern -40 -30 -20 -10 0 180 -30 150 -60 120 -90 90 -120 60 -150 30 (C