HAL Id: hal-00641067
https://hal.archives-ouvertes.fr/hal-00641067
Submitted on 14 Nov 2011
HAL is a multi-disciplinary open access
archive for the deposit and dissemination of
sci-entific research documents, whether they are
pub-lished or not. The documents may come from
teaching and research institutions in France or
abroad, or from public or private research centers.
L’archive ouverte pluridisciplinaire HAL, est
destinée au dépôt et à la diffusion de documents
scientifiques de niveau recherche, publiés ou non,
émanant des établissements d’enseignement et de
recherche français ou étrangers, des laboratoires
publics ou privés.
To cite this version:
P. Diz, F.J. Jorissen, G. J. Reichart, Céline Poulain, F. Dehairs, et al.. Interpretation of benthic
foraminiferal stable isotopes in subtidal estuarine environments. Biogeosciences, European Geosciences
Union, 2009, 6, pp.2549-2560. �10.5194/bg-6-2549-2009�. �hal-00641067�
www.biogeosciences.net/6/2549/2009/
© Author(s) 2009. This work is distributed under the Creative Commons Attribution 3.0 License.
Biogeosciences
Interpretation of benthic foraminiferal stable isotopes in subtidal
estuarine environments
P. Diz1,*, F. J. Jorissen1, G. J. Reichart2,3, C. Poulain4, F. Dehairs5, E. Leorri1,6,**, and Y.-M. Paulet4
1Laboratoire des Bio-Indicateurs Actuels et Fossiles (BIAF), UPRES EA 2644, Universit´e d’Angers, 2, Boulevard Lavoisier,
49045 Angers Cedex, and LEBIM, Ker Chalon, 85350 Ile D’Yeu, France
2Faculty of Geosciences, Organic Geochemistry, Utrecht University, Budapestlaan 4, Utrecht, 3584 CD, The Netherlands 3Alfred Wegener Institute for marine and polar research, Bremerhaven, Germany
4LEMAR, CNRS/UBO/IRD 6539, Institut Universitaire Europ´een de la Mer, Place Nicolas Copernic,
29 280 Plouzan´e, France
5Faculty of Sciences, Vrije Universiteit, Pleinlaan 2, 1050, Brussels
6Centro de Geologia, Faculdade de Ciˆencias da Universidade de Lisboa, Campo Grande, 1749-016 Lisboa, Portugal *Unidade de Geologia Marinha, Laborat´orio Nacional de Energia e Geologia, Estrada da Portela, Zambujal, Amadora
2721-866, Portugal
**Department of Geological Sciences, East Carolina University, Graham Building 103B, Greenville NC, 27858, USA
Received: 7 July 2009 – Published in Biogeosciences Discuss.: 24 July 2009
Revised: 7 October 2009 – Accepted: 29 October 2009 – Published: 13 November 2009
Abstract. Here we present a novel approach for the
in-terpretation of stable isotope signatures recorded in benthic foraminifera from subtidal estuarine environments. The sta-ble isotopic composition (δ18O and δ13C) of living Ammo-nia tepida and Haynesina germanica is examined at four sta-tions in the Auray River estuary (Gulf of Morbihan, France) sampled in two contrasting seasons, spring 2006 and winter 2007. Comparing benthic foraminiferal δ18O measurements with theoretical oxygen isotopic equilibrium values, calcu-lated on the basis of water temperature and salinity measure-ments in the upper and lower estuary, i.e., T-S-δ18Oeq.
dia-grams, strongly suggests that foraminiferal faunas sampled at the four stations calcified during different periods of the year. This interpretation can be refined by using the benthic foraminiferal δ13C, which is mainly determined by the mix-ing of sea and river water. In the upper estuary foraminifera mainly calcified in early spring and winter, whereas in the lower estuary calcification mainly took place in spring, sum-mer and autumn. This new method provides insight into the complexity of estuarine benthic foraminiferal stable iso-tope records. In addition, it can also be used to obtain new information on preferred calcification periods of benthic foraminiferal taxa in different parts of the estuary.
Correspondence to: P. Diz (paula.diz@ineti.pt)
1 Introduction
Benthic foraminifera from shallow water settings can be suc-cessfully used as proxies of environmental variables (e.g., Redois and Debenay, 1996; Debenay et al., 2000; Duchemin et al., 2005; Murray, 2006) or as a bio-indicators of the eco-logical status of the environment (e.g., Alve, 1995; Debe-nay et al., 2001; Morvan et al., 2004; Armynot du Chˆatelet et al., 2004; Platon et al., 2005; Le Cadre and Debenay, 2006; Bouchet et al., 2007; Leorri et al., 2009). However, the use of foraminifera in such settings is often hampered by extreme spatial and temporal variability of the foraminiferal faunas. Detailed studies of benthic foraminiferal faunas from intertidal and subtidal environments show a high degree of patchiness (Hohenegger et al., 1993; Murray and Alve, 2000; Swallow, 2000; Hippensteel et al., 2000; Buzas et al., 2002; Morvan et al., 2006). High-frequency studies (over extended periods, i.e., more than a year) also indicate high temporal variability of the faunas (Boltovskoy and Lena, 1969; Cear-reta, 1988; Swallow, 2000; Murray, 2000; Alve and Murray, 2001; Buzas et al., 2002; Morvan et al., 2006). This spatial and temporal variability concerns the overall faunal density as well as the density of individual taxa, both varying in un-predictable ways.
Subtidal estuarine environments at mid to high latitudes are affected by strong temperature and salinity variations throughout the year. The impact of these parameters may
2550 P. Diz et al.: Interpretation of benthic foraminiferal stable isotopes vary between different parts of the estuary with salinity
changes being more important in the upper parts than in the lower parts. Because both temperature and δ18Ow (mainly
related to salinity) have a major impact on δ18O of carbonate shells, large temporal variations in these parameters make it difficult to interpret benthic foraminiferal δ18O in subtidal es-tuarine environments. Salinity also influences the carbon iso-topic composition of foraminiferal shells because dissolved inorganic carbon in river water has generally lower δ13CDIC
values compared to open ocean waters (e.g., Bauch et al., 2004). In addition, the degradation of isotopically light or-ganic carbon may locally deplete the δ13C signature recorded in the carbonate of the benthic foraminiferal shells in rela-tion to bottom water δ13CDIC(e.g., Chandler et al., 1996).
The specific features of these environments, together with the complexity of ecological factors outlined above (i.e., patch-iness and strong variability in reproductive periods) compli-cate the applicability of foraminiferal stable oxygen isotopes for paleoenvironmental reconstructions.
In the present study we aim at better understanding the pa-rameters influencing oxygen and carbon isotopic composi-tion of subtidal estuarine benthic foraminifera from the Au-ray River estuary (Gulf of Morbihan, France). The δ18O and δ13C isotopic composition of living specimens of Am-monia tepida (Cushman) and Haynesina germanica (Ehren-berg) is documented at four stations sampled during spring 2006 and winter 2007. Foraminiferal stable isotope signa-tures are difficult to interpret because of the substantial vari-ations in bottom water temperature and salinity throughout the year. Here, we propose a novel approach to interpret sta-ble isotopes in such environments based on the comparison of foraminiferal isotopic measurements with the annual tem-perature and salinity cycle in different parts of the estuary. This approach provides valuable information about the tim-ing of foraminiferal calcification and will improve our under-standing of stable isotope records based on fossil estuarine assemblages.
2 Study area
The Auray River estuary is located north of the Gulf of Mor-bihan (Southern Brittany, France, Fig. 1), a semi-enclosed embayment. Fresh water input to the estuary mainly comes from two rivers: Loc’h and Bono (Fig. 1). These waters mix with marine waters of the Gulf of Morbihan originating from the Bay of Quiberon and entering through the Straits of Port Navalo (Fig. 1). The mean tidal range varies between 2.90 m and 4.10 m. The sediments in the outer areas of the Auray river estuary (e.g., Locmariaquer) are composed of sand with low organic carbon content and are influenced by strong cur-rents, whereas within the Auray estuary, areas with weaker tidal currents are generally enriched in the fine fraction and organic matter (Redois and Debenay, 1996). Phytoplankton production is higher in the lower estuary than in the upper
32’ 34’ 36’ 38’ 3°W 56’ 47°N 52’ 46’ 44’ Gulf of Morbihan Bay of Quiberon A uray estu ary Port Navalo 30’ Bono River Loc’h Kerdaniel Bono Kerdréan Moustoir Locmariaquer France Spain Gulf of Morbihan 32’ 34’ 36’ 38’ 3°W 56’ 47°N 52’ 46’ 44’ Gulf of Morbihan Bay of Quiberon A uray estu ary Port Navalo 30’ Bono River Loc’h Kerdaniel Bono Kerdréan Moustoir Locmariaquer France Spain Gulf of Morbihan France Spain Gulf of Morbihan France Spain Gulf of Morbihan
Fig. 1. Setting of the Auray River estuary in the Gulf of Morbihan, foraminiferal sampling sites (white squares) and location of the hy-drographic stations (black squares).
estuary and is mainly composed of diatoms (benthic, fresh water or pelagic/oceanic, depending on the season, Paulmier, 1972). In the lower estuary two annual primary production maxima are observed in May and September, whereas in the upper estuary maximum production is restricted to May and June.
3 Material and methods
3.1 Bottom water samples
Bottom water temperature and salinity were monitored ev-ery 10 min between March 2006 and March 2008 with a 600 OMS YSI Sensor located 10 cm above the bottom at two sub-tidal stations in the Auray River estuary (Fig. 1), (except for sporadic sensor failure). Daily average values were calcu-lated to characterise the annual cycle of bottom water tem-perature and salinity in the upper (Bono station) and lower (Locmariaquer station) estuary (Fig. 1).
Salinity and stable isotopes of bottom waters (δ13CDICand
δ18Ow) were measured on eighteen samples collected at the
Bono site (Fig. 1) every 2 h (except for 2 measurements with 8 h between samplings) between the 1st and 3rd of March 2007. Water samples from the sediment-water interface were stored in 12 mL Exetainer vials, poisoned with 20 µL of satu-rated mercuric chloride (HgCl2) solution, capped tightly and
stored in a cool room until analysis. The δ18O of water and
δ13C of dissolved inorganic carbon (DIC) was measured at the Earth System Science laboratory of Vrije Universiteit Brussel (Belgium) using the protocol described by Gillikin and Bouillon (2007). For δ18Owatermeasurements, 500 µL of
a water sample and 1000 µL pure CO2from a tank were
in-jected in a 12 mL helium-flushed headspace vial. After about 48 h equilibration in a shaker at ambient laboratory tempera-ture (23◦C), 500 µL of CO2from the headspace was injected
into the carrier gas stream of a ThermoFinningan Delta XL continuous flow IRMS. Two in-house standards well cali-brated against VSMOW were processed with the same pro-tocol. Data are expressed in ‰ relative to VSMOW and pre-cision was better than 0.12‰ (1σ ) determined by repeated analysis of the standard. For the δ13CDIC measurements,
9.5 mL of water sample was acidified with 200 µL of pure orthoposphoric acid in a 12 mL helium-flushed headspace vial. After overnight equilibrium, 500 µL of the headspace was injected into the carrier gas stream of the IRMS (like in
δ18Owateranalysis). The formula of Miyajima et al. (1995)
was used to correct for the partitioning of CO2 between
headspace and water phase and to calculate δ13CDIC. Data
are expressed in ‰ relative to VPDB and precision was bet-ter than 0.15‰ (1σ ) based on 14 analyses of CO2reference
gas.
3.2 Foraminiferal samples
3.2.1 Sampling sites
Four subtidal stations (Kerdaniel, Kerdr´ean, Moustoir and Locmariaquer) on a transect along the Auray River estuary were selected for this study (Fig. 1). Kerdaniel (47◦38.860N, 2◦58.300W) is located in the upper estuary slightly up-stream of the Bono River outlet. Kerdr´ean (47◦37.650N, 2◦57.310W) and Moustoir (47◦36.140N, 2◦57.450W) char-acterize the middle/upper and middle/lower part of the estuary, respectively, whereas Locmariaquer (47◦34.210N, 2◦56.580W) is located at the mouth of the estuary and rep-resents the most open marine conditions. The water depth of the sampling sites with respect to the mean tidal level of Port Navalo are 2.3 m (Kerdaniel), 3.5 m (Kerdr´ean), 3 m (Moustoir) and 1.5 m (Locmariaquer), all with an error of
±0.5 m. Each station was sampled in spring 2006 (20–21 April or 9 May) and winter 2007 (2 February). During sam-pling, two sediment cores (replicate samples 01 and 02, a few meters apart) were collected at each station. All sam-ples recovered in February 2007 as well as the samsam-ples at Kerdaniel and Moustoir in spring 2006 were recovered with a squared gravity corer (15 cm×15 cm). Samples taken in spring 2006 at Kerdr´ean and Locmariaquer were collected by scuba divers that pushed a pvc core (9 cm diameter) into the sediment. In winter 2007, we obtained only a sample of the uppermost centimetre at Locmariaquer. The sedi-ment of Kerdaniel and Moustoir stations is mainly composed of mud with high amounts of plant remains. In Kerdr´ean, the sediment contains a significant proportion of bioclastic fragments, whereas siliciclastic sands dominate at Locmari-aquer. All stations contain variable proportions of meiofauna (mainly polychaeta).
3.2.2 Sample processing
Immediately after collection, cores were subsampled into slices of 1 cm down to 10 cm depth and subsamples were put into bottles containing ethanol and Rose Bengal (1g/l). In the laboratory the samples were wet sieved into 63–150 µm and >150 µm size classes, and then stored in 95% ethanol. Living (Rose Bengal stained) foraminifera from both size fractions were picked from wet samples and stored in mi-cropaleontological slides. We only considered foraminifera alive, when all chambers except the last zero to three were stained bright red/pink. Except for some intervals where the foraminiferal fauna was particularly rich, samples were not split and all living benthic foraminifera were picked and counted. Faunal densities for each core (0–10 cm) are ex-pressed as the total number of foraminifera standardised to a 50 cm2surface area.
3.2.3 Isotopic measurements
Well preserved individuals of living benthic foraminifera Ammonia tepida and Haynesina germanica were picked from the >150 µm fraction (size range from 150 to 350 µm) of the uppermost centimetre of sediment at the four studied stations, from each replicate core, and for both sampling pe-riods. Stable carbon and oxygen isotope measurements were performed on 6-10 specimens at the stable isotope facilities of Utrecht University using an isotope ratio mass spectrom-eter (Thermo Finnigan MAT-253) coupled online to an au-tomated carbonate sample preparation device (Kiel III). Re-sults are calibrated against international standard NBS-19 and reported on the Vienna PeeDee Belemnite (VPDB) scale. External reproducibility (1σ ) was better than ±0.08‰ and
±0.04‰ for δ18O and δ13C respectively.
4 Results
4.1 Temperature and salinity
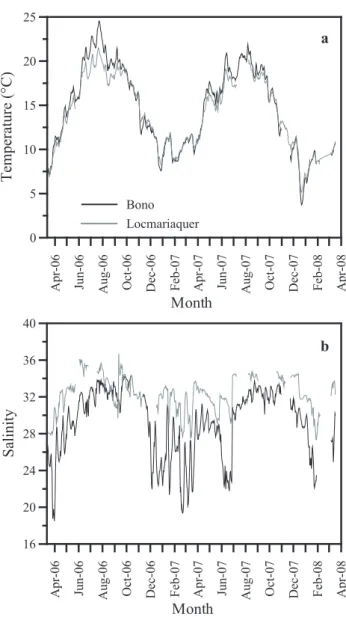
Temperature values in the Auray river waters are remark-ably similar between the upper and lower estuary (Fig. 2a). Lowest water temperatures occur during winter (December– March), and range from 3.5◦C to 12◦C. Warmer tempera-tures during summer (middle of June to end of August) range from 18 to 25◦C. By contrast, the annual salinity cycle in
the upper estuary differs substantially from that observed in the lower parts of the estuary. In the upper estuary salinity varies between 18 and 34 whereas in the lower estuary it only varies between 27 and 36 (Fig. 2b). In the upper parts, high salinities coincide with dry months (late spring-summer), but can extend well into the beginning of autumn (October– November, Fig. 2b). During these periods the salinity gra-dient between upper and lower estuary is relatively subtle with salinities ranging only from 30 to 36 (Fig. 2b). Lower
2552 P. Diz et al.: Interpretation of benthic foraminiferal stable isotopes
Figure 2
a b Bono Locmariaquer 0 5 10 15 20 25 T em pe ra tu re ( °C ) A pr -0 6 Ju n-06 A ug -0 6 O ct -0 6 D ec -0 6 Fe b-07 A pr -0 7 Ju n-07 A ug -0 7 O ct -0 7 D ec -0 7 F eb -0 8 A pr -0 8 Month 16 20 24 28 32 36 40 S al in ity A pr -0 6 Ju n-06 A ug -0 6 O ct -0 6 D ec -0 6 F eb -0 7 A pr -0 7 Ju n-07 A ug -0 7 O ct -0 7 D ec -0 7 F eb -0 8 A pr -0 8 MonthFig. 2. Bottom water temperature (a) and salinity (b) in Bono (black line) and Locmariaquer (grey line) between March 2006 and March 2008.
salinities are recorded in the upper parts of the estuary dur-ing periods of increased precipitation and river discharge in winter, early spring, or during exceptionally rainy periods in summer (e.g., June–July 07, Fig. 2b).
4.2 Mixing of river and sea water in the Auray river
es-tuary and impact on stable carbon and oxygen iso-topic ratios
Paired measurements of bottom water δ13CDIC, δ18Ow and
salinity at Bono are used here to create a mixing model of sea and river water for the Auray estuary (e.g., Thomas et al., 2000; Polyak et al., 2003; Reinhart et al., 2003; Bauch et al., 2004; Cronin et al., 2005; McGann, 2008). Over the mea-sured salinity range (20–32), both δ13CDICand δ18Owshow a
δ
13C
foram.0
5
10
15
20
25
30
35
40
Salinity
-9
-8
-7
-6
-5
-4
-3
-2
-1
0
1
2
W at er is ot op ic c om po si tio n (‰ )δ
18O
wδ
13C
DIC Range of.Fig. 3. Mixing line between sea and river waters for δ18Ow(black)
and δ13CDIC(grey) in the Auray estuary. Oxygen isotopic values
(VSMOW, black squares) and carbon isotopic values (grey squares, VPDB) are based on samples collected at Bono (Fig. 1) during 3 tidal cycles. The grey band represents maximum and minimum salinity values measured at Bono and Locmariaquer hydrographic stations (Fig. 2b). Horizontal dashed lines indicate the δ13C range measured in benthic foraminiferal shells.
strong linear relation with salinity (Fig. 3). Regression lines for δ13CDICand δ18Ow to salinity are δ13CDIC (‰ VPDB)
= −8.0 + 0.25× Salinity (n=18, R2=0.978, p= 0.000) and
δ18Ow (‰ VSMOW) = −4.56 + 0.14 × Salinity (n=18, R2
= 0.955, p= 0.000), respectively. The stable oxygen isotopic composition of the end member (fresh water) is compara-ble to the oxygen isotope ratios of precipitation in the Loire-Bretagne catchment area (−4.8‰±0.5, GNIP data for Brest Plouzane, yearly average 1996–2002, International Atomic Energy Agency). The intercept of the δ13CDIC: salinity
re-lationship (−8.0‰) is comparable to the average of δ13CDIC
values in the Rhˆone-Saˆone Rivers (−11.0‰, Aucour et al., 2003). Depleted river δ13CDIC values are explained by the
reaction of carbon isotopically depleted soil biogenic CO2
and minerals of the basement rocks. Mixing of sea and river water (i.e., salinity) has a much greater impact on δ13CDIC
than on δ18Ow. According to the mixing model for the
Au-ray estuary, a change of 15 salinity units leads to a 3.7‰ shift in δ13CDICand a 2.1‰ shift in δ18Ow.
4.3 Living benthic foraminiferal faunas
The abundance of live benthic foraminifera (total number of benthic foraminifera >63 µm per 50 cm2) shows large
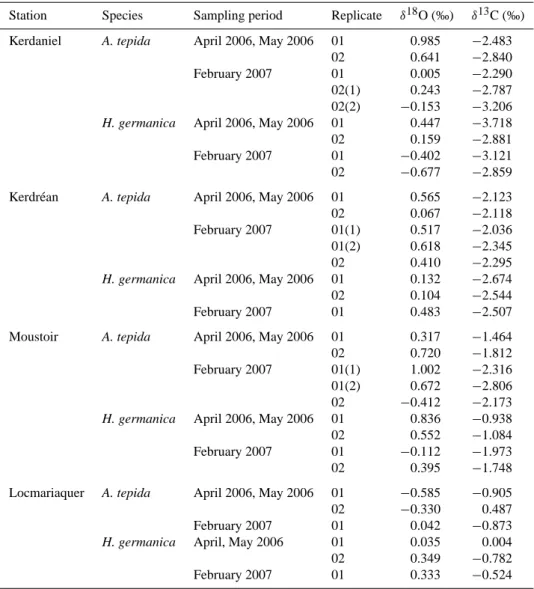
Table 1. The δ18O and δ13C of A. tepida and H. germanica (>150 µm) from the uppermost centimetre of the sediment (0-1 cm) in the Auray River estuary. Data are reported in ‰ in the Vienna PeeDee Belemnite (VPDB) scale. Replicate samples taken from the same area are indicated by 01 or 02 and duplicate measurements of the same sample by numbers into brackets.
Station Species Sampling period Replicate δ18O (‰) δ13C (‰) Kerdaniel A. tepida April 2006, May 2006 01 0.985 −2.483
02 0.641 −2.840 February 2007 01 0.005 −2.290 02(1) 0.243 −2.787 02(2) −0.153 −3.206
H. germanica April 2006, May 2006 01 0.447 −3.718 02 0.159 −2.881 February 2007 01 −0.402 −3.121 02 −0.677 −2.859 Kerdr´ean A. tepida April 2006, May 2006 01 0.565 −2.123 02 0.067 −2.118 February 2007 01(1) 0.517 −2.036 01(2) 0.618 −2.345 02 0.410 −2.295
H. germanica April 2006, May 2006 01 0.132 −2.674 02 0.104 −2.544 February 2007 01 0.483 −2.507 Moustoir A. tepida April 2006, May 2006 01 0.317 −1.464 02 0.720 −1.812 February 2007 01(1) 1.002 −2.316 01(2) 0.672 −2.806 02 −0.412 −2.173
H. germanica April 2006, May 2006 01 0.836 −0.938 02 0.552 −1.084 February 2007 01 −0.112 −1.973 02 0.395 −1.748 Locmariaquer A. tepida April 2006, May 2006 01 −0.585 −0.905 02 −0.330 0.487 February 2007 01 0.042 −0.873
H. germanica April, May 2006 01 0.035 0.004 02 0.349 −0.782 February 2007 01 0.333 −0.524
differences between stations, replicate cores and sampling periods (Fig. 4a). In spring 2006 (April–May), the abun-dance of live foraminifera is substantially higher at Kerdr´ean (∼ 400 individuals per 50 cm2) and at Locmariaquer (∼200 individuals per 50 cm2) than at the other two stations (50 in-dividuals per 50 cm2) and foraminifera are mainly concen-trated in the two uppermost centimetres of the sediment. In February 2007 the abundance is relatively uniform along the Auray estuary (∼300–500 individuals per 50 cm2), although values are still maximal at the Kerdr´ean site (Fig. 4a). In con-trast to spring 2006, benthic foraminifera are homogenously distributed up to 7–8 cm of the sediment. The spatial distri-bution of the two species used in this study is typical of East Atlantic temperate estuaries of the French and Spanish coast (e.g., Redois and Debenay, 1996; Debenay et al., 2000, 2006; Duchemin et al., 2005; Leorri and Cearreta, 2009).
Ammo-nia tepida characterizes the upper and middle/upper parts of the estuary (Fig. 4b) whereas Haynesina germanica is repre-sented all along the estuary, although it is more abundant in the upper parts (Fig. 4c). There are some differences in the faunal composition between spring 2006 and winter 2007. The abundance of A. tepida and H. germanica is substan-tially higher in winter 2007 in the upper and middle/upper estuary. Other characteristic species are Brizalina spathulata (Williamson), Brizalina dilatata (Reuss), Hopkinsina paci-fica Cushman, Stainforthia fusiformis (Williamson) in the middle parts of the estuary and Quinqueloculina spp. and Nonion depressulus (Walker and Jacob) in the lower part. Eggerelloides scabrus (Williamson) is found abundant in the middle/upper and lower estuary. Cribroelphidium excavatum (Terquem) is present, although in low proportions, at all sta-tions.
2554 P. Diz et al.: Interpretation of benthic foraminiferal stable isotopes
Spring 2006 Winter 2007
Kerdaniel Kerdréan Moustoir Locmariaquer
Stations 0 50 100 150 200 #H . g er m an ic
a Kerdaniel Kerdréan Moustoir Locmariaquer
0 50 100 150 200 #A . t ep id a
Kerdaniel Kerdréan Moustoir Locmariaquer
0 200 400 600 800 # T ot al L iv in g a b c River Sea
Fig. 4. Mean abundance (white and grey bars) of total living ben-thic foraminifera (a) and of A. tepida (b) and H. germanica (c). The standard deviation (vertical lines) is based on two replicates for each station. White and grey bars refer to spring 2006 and win-ter 2007 respectively. Vertical axes represents the number of total live individuals (>63 µm) of a particular species found in the core (0–10 cm) and standardised to 50 cm2surface area. Note that abun-dance at Locmariaquer during Winter 2007 does not have a replicate and corresponds to one sample from the uppermost centimetre in-terval only.
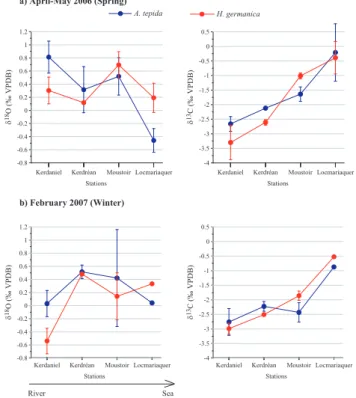
4.4 Stable carbon and oxygen isotopes of A. tepida and
H. germanica
The δ13C of A. tepida and H. germanica increases from the upper to the lower part of the estuary both during winter and spring (Fig. 5, Table 1). The δ13C of A. tepida increases on average by 2.4‰ in spring 2006 and by 1.9‰ in winter 2007. Average differences in δ13C of H. germanica between upper and lower estuary are 2.9‰ in spring 2006 and 2.5‰ in win-ter 2007. The observed spatial range in benthic foraminiferal
δ13C (dashed lines in Fig. 3) agrees well with the calculated
δ13CDIC gradient caused by mixing of sea and river water
(Fig. 3). Unlike carbon isotopes, oxygen isotope ratios of A. tepida and H. germanica tests do not show a clear spa-tial trend. In the upper estuary, the oxygen isotope values of these species show large differences between spring 2006 and winter 2007. Both species show heavier δ18O values by about 0.8‰ in spring 2006 compared to winter 2007. Sur-prisingly, in the lower estuary, the δ18O of A. tepida shows
Figure 5
a) April-May 2006 (Spring)
b) February 2007 (Winter)
A. tepida H. germanica
River Sea
Kerdaniel Kerdréan Moustoir Locmariaquer
Stations -0.8 -0.6 -0.4 -0.2 0 0.2 0.4 0.6 0.8 1 1.2 δ 18O ( ‰ V P D B )
Kerdaniel Kerdréan Moustoir Locmariaquer
Stations -4 -3.5 -3 -2.5 -2 -1.5 -1 -0.5 0 0.5 δ 13C ( ‰ V PD B )
Kerdaniel Kerdréan Moustoir Locmariaquer
Stations -0.8 -0.6 -0.4 -0.2 0 0.2 0.4 0.6 0.8 1 1.2 δ 18O ( ‰ V P D B )
Kerdaniel Kerdréan Moustoir Locmariaquer
Stations -4 -3.5 -3 -2.5 -2 -1.5 -1 -0.5 0 0.5 δ 13C ( ‰ V PD B )
Fig. 5. Carbon and oxygen isotopic composition of A. tepida (blue) and H. germanica (red) in the Auray River estuary in spring 2006 (a) and winter 2007 (b) expressed by the mean and the standard deviation. Isotopic measurements are indicated in Table 1.
rather low values in spring 2006. At Locmariaquer δ18O is about 1‰ lower than at the other three stations. At the same station, spring 2006 values are about 0.5‰ depleted in com-parison to winter 2007 values (Fig. 5). H. germanica does not show such a clear δ18O minimum at Locmariaquer in spring 2006. In the middle estuary oxygen isotope composition of A. tepida and H. germanica remain fairly similar and do not show substantial changes between sampling periods.
The temperature gradient between upper and lower estu-ary is negligible at both sampling times (Fig. 2a). Conse-quently, we expected to find an increasing trend in the δ18O of benthic foraminifera from upper to lower parts of the estu-ary in response to decreasing fresh water influence (Fig. 3). This gradient should have been steeper in winter, when the salinity gradient between upper and the lower estuary is at a maximum, and reduced in spring when the salinity gra-dient is weaker (Fig. 2b). However, this is not observed, which suggests that the oxygen isotopic composition of ben-thic foraminifera in the Auray estuary does not represent the temperature and δ18Owsignatures at the time of sampling.
5 Discussion
5.1 Benthic foraminiferal stable isotopes (δ18O and
δ13C) in subtidal environments
High spatial and temporal variability of the physical pa-rameters (temperature and salinity) complicate the interpre-tation of the isotopic composition of benthic foraminiferal shells in subtidal environments. Moreover, the highly com-plex ecology of the foraminiferal faunas excludes a straight-forward application of stable isotopes to estimate tempera-ture or salinity variations in subtidal estuaries. However, by combining foraminiferal stable isotopes and the annual Temperature (T) and Salinity (S) cycle, presented together in T-S-δ18Oequilibrium diagrams, it is possible to constrain
foraminiferal calcification seasons. Previously, similar dia-grams have been used in paleoceanographic studies in open ocean settings to separate water masses (e.g., Zahn and Mix, 1991; Labeyrie et al., 1992; Zahn et al., 1997). Our approach is novel in that we combine the water mass mixing (i.e., salin-ity) with the annual temperature cycle. This approach is par-ticularly well suited for the interpretation of stable isotopes in shallow water environments.
Theoretical δ18Oeqfractionation lines are calculated from
water δ18O (δ18Ow) and temperature (T) according to the
pa-leotemperature equation of Shackleton (1974): T=16.9-4.38 (δ18Oeq−δ18Ow) + 0.1(δ18Oeq−δ18Ow)2. The δ18Ow
val-ues are based on the δ18Ow : salinity relationship described
in the results section (δ18Ow (‰ VSMOW) = −4.565 +
0.1416 Salinity) for the Auray River estuary. Standard mean ocean water δ18Ow (VSMOW) was converted to PDB units δ18Ow (VPDB) using the factor conversion of Hut (1987; −0.27). Subsequently water temperature and salinity mea-surements (Fig. 2a, b) from Bono and Locmariaquer hydro-graphic stations (Fig. 1) have been averaged for 15-day inter-vals, from March 2006 to March 2008. The calculated values have been plotted in the T-S-δ18Oeq diagram. The diagram
clearly shows the annual cycle of theoretical δ18Ocalcite in
the upper (e.g., Fig. 6a) and lower (e.g., Fig. 6e) estuary. The seasonal succession of calculated δ18Oeq.is more
differen-tiated in the upper part of the estuary where large seasonal changes in salinity result in a clear separation between cooler and low salinity winter waters and warmer and higher salin-ity late spring to autumn waters (e.g., Fig. 6a). Conversely, the seasonal cycle in the lower parts of the estuary is less dif-ferentiated and mainly determined by temperature changes (e.g., Fig. 6e).
The δ18O values of A. tepida and H. germanica (Table 1) are plotted in the T-S-δ18Oeq diagrams as lines based on
the δ18Oeq fractionation which represents unique
combina-tions of temperature and salinity values. In case several iso-topic measurements have been performed for the same sam-ple a “band” representing the range of measured values is shown. The possible calcification periods are indicated by the overlap between these lines/bands and the areas
repre-senting the seasonal δ18Oeqsignature. Isotopic data from the
upper (Kerdaniel) and middle/upper (Kerdr´ean) estuary are compared with the T and S data measured at Bono (Fig. 6a– d), whereas isotopic data from the lower estuary (Locmari-aquer) are compared to the T and S values of Locmariaquer Fig. (6e–f). No comparison is presented for the middle/lower estuary (Moustoir) since T-S records are not available for this part of the estuary.
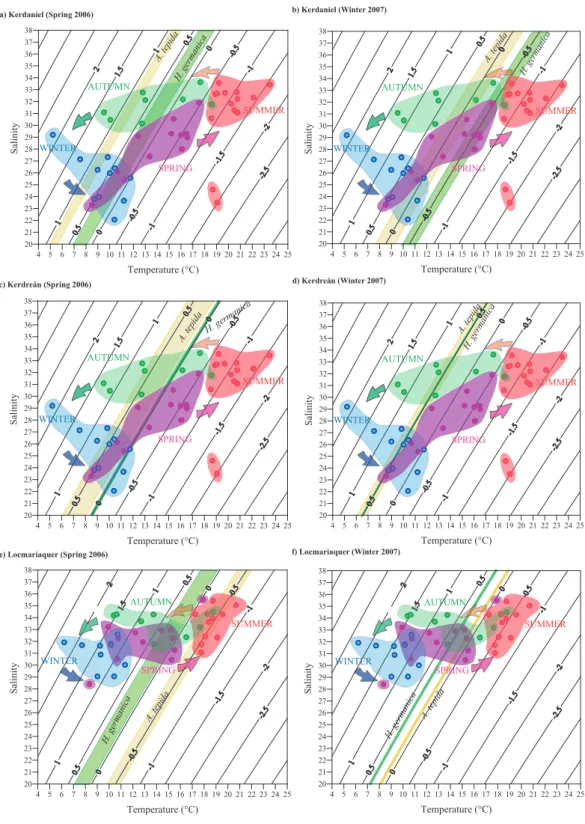
The T-S-δ18Oeq diagrams (Fig. 6) indicate that in many
cases there is no unique solution but several calcification pe-riods are feasible. In the upper estuary (Kerdaniel and Ker-dre´an) Ammonia tepida sampled in Spring 2006 and Winter 2007 may have calcified in spring, winter or autumn (Fig. 6a– d). The same applies to H. germanica except for the speci-mens collected in Kerdaniel in winter 2007 which can only have calcified in spring or early summer. In the lower estuary (Locmariaquer) H. germanica and A. tepida may have calci-fied in autumn, summer or spring (Fig. 6e–f) with the excep-tion of the specimens collected in spring 2006 which have an isotopic signature typical of summer conditions (Fig. 6e).
The δ13CDICvalues of Auray River water show a positive
linear relation to salinity (Fig. 3). The observed spatial trend in benthic foraminiferal δ13C agrees well with the expected
δ13CDICgradient caused by mixing of sea and river waters
(Fig. 3). Therefore, by combining T-S-δ18Oeqdiagrams with
additional salinity constraints provided by carbon isotopes (last column in Table 2) we can reduce the number of possi-ble calcification periods.
Subtidal areas of the Auray River estuary are character-ized by organic rich sediments. It can therefore not be ex-cluded that oxidation of isotopically light organic matter con-tributes to the carbon isotopic composition of A. tepida and H. germanica shells. However, the average spatial gradient of foraminiferal δ13C (around 2.9‰, Table 1) between the upper and lower estuary corresponds to the expected δ13CDIC
gradient in function of a 10 salinity change (Fig. 3). There-fore, the contribution of13C depleted DIC by organic matter degradation is probably small in our case. Consequently, al-though it is not possible to directly translate δ13C into a salin-ity value, we can use the carbon isotopic signature to rule out some of the theoretically possible calcification periods in the T-S-δ18Oeqdiagram.
In the upper estuary (Kerdaniel and Kerdre´an) calcifica-tion during autumn can be excluded for both sampling peri-ods and both species because their δ13C indicates low salin-ity during calcification. Consequently, both species can only have calcified in winter or early spring. The restricted salin-ity range in the lower parts of the estuary makes the distinc-tion between spring and autumn calcificadistinc-tion more difficult (Fig. 6e–f). Although the carbon isotopic signatures are in line with the observations in the T-S-δ18Oeqdiagram we can
not use them to further constrain calcification periods. A summary of the most likely timing of foraminiferal cal-cification in the Auray estuary is presented in Table 2. In the upper estuary both species calcified in winter or early
2556 P. Diz et al.: Interpretation of benthic foraminiferal stable isotopes a) Kerdaniel (Spring 2006) A. tepida H. germanica 4 5 6 7 8 9 10 11 12 13 14 15 16 17 18 19 20 21 22 23 24 25 Temperature (°C) 20 21 22 23 24 25 26 27 28 29 30 31 32 33 34 35 36 37 38 S al in it y SUMMER SPRING AUTUMN WINTER b) Kerdaniel (Winter 2007) A. tepida H. germanica 4 5 6 7 8 9 10 11 12 13 14 15 16 17 18 19 20 21 22 23 24 25 Temperature (°C) 20 21 22 23 24 25 26 27 28 29 30 31 32 33 34 35 36 37 38 S al in it y SUMMER SPRING AUTUMN WINTER Figure 6 4 5 6 7 8 9 10 11 12 13 14 15 16 17 18 19 20 21 22 23 24 25 Temperature (°C) 20 21 22 23 24 25 26 27 28 S al SPRING WINTER b) Kerdaniel (Winter 2007) A. tepida H. germanica 4 5 6 7 8 9 10 11 12 13 14 15 16 17 18 19 20 21 22 23 24 25 Temperature (°C) 20 21 22 23 24 25 26 27 28 29 30 31 32 33 34 35 36 37 38 S al in it y SUMMER SPRING AUTUMN WINTER c) Kerdreán (Spring 2006) A. tepidaH. germanica A. tepida d) Kerdreán (Winter 2007) H. germanica 4 5 6 7 8 9 10 11 12 13 14 15 16 17 18 19 20 21 22 23 24 25 Temperature (°C) 20 21 22 23 24 25 26 27 28 29 30 31 32 33 34 35 36 37 38 S al in it y SUMMER SPRING AUTUMN WINTER 4 5 6 7 8 9 10 11 12 13 14 15 16 17 18 19 20 21 22 23 24 25 Temperature (°C) 20 21 22 23 24 25 26 27 28 29 30 31 32 33 34 35 36 37 38 S al in it y SUMMER SPRING AUTUMN WINTER Figure 6 (continued) c) Kerdreán (Spring 2006) A. tepidaH. germanica A. tepida d) Kerdreán (Winter 2007) H. germanica 4 5 6 7 8 9 10 11 12 13 14 15 16 17 18 19 20 21 22 23 24 25 Temperature (°C) 20 21 22 23 24 25 26 27 28 29 30 31 32 33 34 35 36 37 38 S al in it y SUMMER SPRING AUTUMN WINTER 4 5 6 7 8 9 10 11 12 13 14 15 16 17 18 19 20 21 22 23 24 25 Temperature (°C) 20 21 22 23 24 25 26 27 28 29 30 31 32 33 34 35 36 37 38 S al in it y SUMMER SPRING AUTUMN WINTER Figure 6 (continued) e) Locmariaquer (Spring 2006) A. tepida H. germanica f) Locmariaquer (Winter 2007) A. tepida H. germanica 4 5 6 7 8 9 10 11 12 13 14 15 16 17 18 19 20 21 22 23 24 25 Temperature (°C) 20 21 22 23 24 25 26 27 28 29 30 31 32 33 34 35 36 37 38 S al in it y SUMMER SPRING AUTUMN WINTER 20 21 22 23 24 25 26 27 28 29 30 31 32 33 34 35 36 37 38 S al in it y SUMMER SPRING AUTUMN WINTER Figure 6 (continued) e) Locmariaquer (Spring 2006) A. tepida H. germanica f) Locmariaquer (Winter 2007) A. tepida H. germanica 4 5 6 7 8 9 10 11 12 13 14 15 16 17 18 19 20 21 22 23 24 25 Temperature (°C) 20 21 22 23 24 25 26 27 28 29 30 31 32 33 34 35 36 37 38 S al in it y SUMMER SPRING AUTUMN WINTER 4 5 6 7 8 9 10 11 12 13 14 15 16 17 18 19 20 21 22 23 24 25 Temperature (°C) 20 21 22 23 24 25 26 27 28 29 30 31 32 33 34 35 36 37 38 S al in it y SUMMER SPRING AUTUMN WINTER Figure 6 (continued)
Fig. 6. T-S-δ18Oeq diagrams for the Auray River estuary and calcification periods of A. tepida and H. germanica at Kerdaniel (a–b),
Kerdr´ean (c–d) and Locmariaquer (e–f). The δ18Oeq isolines are calculated according to the paleotemperature equation of Shackleton
(1974) and the δ18Ow: salinity relationship for the Auray estuary (see main text). Bottom water temperature and salinity data averaged for
15-day periods are indicated by circles. Colours indicate the different seasons. Benthic foraminiferal δ18O values (Table 1) are plotted in the diagrams as lines, yellow for A. tepida and green for H. germanica. In case several isotopic measurements have been performed for the same sample a “band” representing the range of measured values is shown. Possible calcification periods are indicated by the overlap of benthic foraminiferal δ18O values with the annual δ18Oeqcycle.
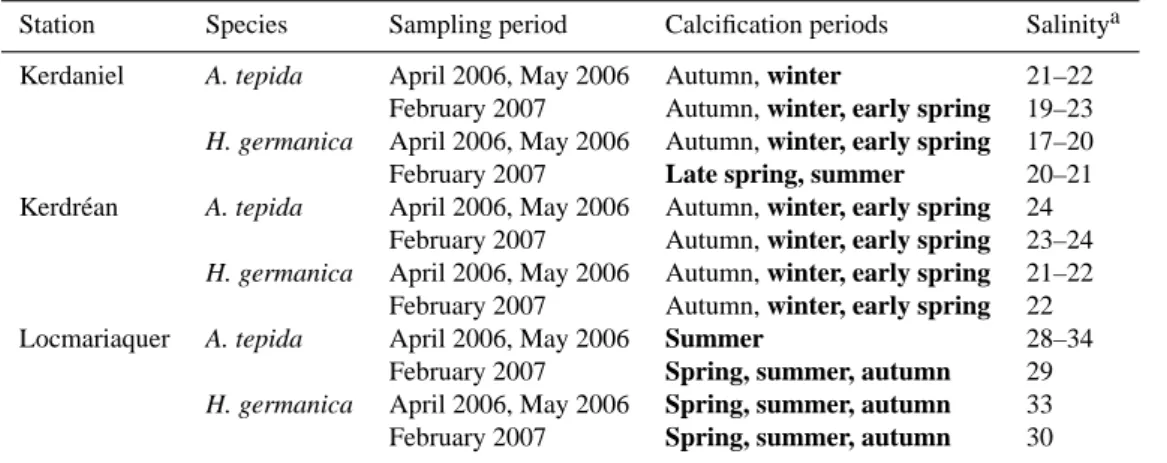
Table 2. Calcification periods of A. tepida and H. germanica in the Auray River estuary. The possible calcification periods are indicated in Fig. 6 by the overlap between the δ18O foraminiferal values and the areas representing the seasonal δ18Oeqsignature. Bold represent the
most feasible calcification periods based in the carbon isotopic signature of benthic foraminifera (a).
Station Species Sampling period Calcification periods Salinitya Kerdaniel A. tepida April 2006, May 2006 Autumn, winter 21–22
February 2007 Autumn, winter, early spring 19–23
H. germanica April 2006, May 2006 Autumn, winter, early spring 17–20 February 2007 Late spring, summer 20–21 Kerdr´ean A. tepida April 2006, May 2006 Autumn, winter, early spring 24
February 2007 Autumn, winter, early spring 23–24
H. germanica April 2006, May 2006 Autumn, winter, early spring 21–22 February 2007 Autumn, winter, early spring 22 Locmariaquer A. tepida April 2006, May 2006 Summer 28–34
February 2007 Spring, summer, autumn 29
H. germanica April 2006, May 2006 Spring, summer, autumn 33 February 2007 Spring, summer, autumn 30
aSalinity estimates from the carbon isotopic composition of A. tepida and H. germanica. Estimations are based on the assumption that
benthic foraminiferal δ13C is mainly a function of mixing between sea water and river water (Fig. 3).
spring. In the lower estuary H. germanica calcified in spring or in autumn, whereas A. tepida most probably calcified in summer (samples collected in spring 2006) or in summer, autumn or spring (samples collected in winter 2007). There-fore, benthic foraminifera calcified from a few months to half a year (or even more) before sampling. This is partic-ularly true for samples collected in February 2007 in Loc-mariaquer. In this area benthic foraminifera calcified more than half a year before the collection time. Although the life cycle of benthic foraminifera may be longer than one year (Murray, 1991), their reproduction and growth is limited to a relatively short period, possibly related to favourable envi-ronmental conditions. Laboratory experiments demonstrate that A. tepida can quickly grow to an adult size in 20 and 120 days depending on temperature, salinity and food availabil-ity (Bradshaw, 1957, 1961). Results of Bradshaw (1957) and unpublished observations in our laboratory indicate that after growing to adult size, chamber addition in A. tepida becomes slower as the individual grows larger. Culturing experiments also demonstrated that under suboptimal environmental con-ditions (e.g., 10◦C, Bradshaw, 1957), this species can remain
alive for long periods without growing or reproducing. In nature, dormancy has been suggested as survival strategy un-der adverse conditions such as anoxia (Bernhard and Sen-Gupta, 1999; Gustafsson and Nordberg, 1999; Polovodova et al., 2009). It is not impossible for episodic hypoxia events to occur in the muddy organic-rich environments of the upper and middle areas of the Auray estuary. Preferential calcifica-tion during warmer months in the lower estuary is probably related to the ecological preferences of the studied species. The lower part of the estuary is probably not the optimal habitat for H. germanica and A.tepida, as is shown by their low abundances (Fig. 4b, c). It appears that these taxa only
reproduce in the outer estuary during short periods of the year which may coincide with peaks in phytoplankton production in spring and summer (Paulmier, 1972). In the rest of the estuary, the most favourable calcification periods coincide with the colder months and/or early spring. Foraminiferal production peaks in winter and in early spring have been re-ported in the nearby Bay of Bourgneuf (Morvan et al., 2006; Debenay et al., 2006).
5.2 Constraints of the approach and future applications
Systematic offsets between the isotopic composition of the foraminiferal shell and the surrounding waters are usually explained as vital effects, which may be the combined ef-fect of multitude of processes (see reviews in Grossman, 1987; Rohling and Cooke, 1999). The consequence is that only few benthic foraminiferal taxa precipitate their shells in equilibrium. To our knowledge, there are no published data available on the isotopic disequilibria for the two species used here- Ammonia tepida and Haynesina germanica. A small isotopic offset from equilibrium fractionation would shift the lines of the T-S-δ18Oeqplots but would not
substan-tially change the interpretation of our data.
Tidal currents likely transport some live benthic foraminifera from more open marine settings into the estuary and vice versa. We consider transport of shells not to have substantially affected the spatial distribution of H. germanica and/or A. tepida. If foraminifera from the outer parts of the estuary were transported to the upper and middle parts, we should find lighter δ18O ratios indicative of calcification during the warm season. Additionally, because of their contrasting isotopic signature, we can exclude that specimens collected at Locmariaquer originated from sites in the upper estuary.
salinity on the basis of fossil assemblages.
Results obtained in this study show clearly that in subtidal environments, high spatial and temporal variability of the en-vironmental parameters as well as benthic foraminiferal as-semblages seriously hamper the application of oxygen and carbon isotope geochemistry for environmental reconstruc-tions. In these extremely variable environments, timing of foraminiferal calcification has a profound impact on the δ18O of the shells. Here we show that different calcification peri-ods apply to different species, in different parts of the es-tuary. Although stable isotopes have been used in brackish marine environments to reconstruct paleosalinity over time scales varying from centuries (Thomas et al., 2000; Scheurle and Hebbeln, 2003) to thousands of years (Winn et al., 1998; Kim and Kennett, 1998; Polyak et al., 2003; Peros et al., 2007), it is obvious that the reconstructing salinity or tem-perature in these settings needs additional constraints from independent proxies (Polyak et al., 2003; Peros et al., 2007). Acknowledgements. This work is a contribution to the PaleoSalt
project funded by the European Science Foundation (ESF) under the EUROCORES Programme EuroCLIMATE through contract number ERAS-CT-2003-980409 of the European Commission, DG Research, FP 02. The authors are grateful to Arnold van Dijk for running the isotope analysis and to all participants in the sampling cruises; Fabrice Redois, Gerald Duchemin, Sophie Terrien and H´elen´e Howa from Angers University and Evelyne Goulbert from Vannes University. We are especially thankful to E. Goulbert for proving us with the gravity core. The comments and suggestions of E. Geslin and C. Barras in an early version of this manuscript are sincerely acknowledged. P. D. and E. L. were funded by a postdoctoral grant from the Conseil G´en´eral of the Vend´ee (France). This manuscript benefited from the comments and suggestions of E. Thomas and an anonymous reviewer. Edited by: S. W. A. Naqvi
References
Alve, E.: Benthic foraminiferal responses to estuarine pollution: a review, J. Foramin. Res., 25, 190–203, 1995.
Alve, E. and Murray, J. W.: Temporal variability in vertical distribu-tions of live (stained) intertidal foraminifera, southern England, J. Foramin. Res., 31, 12–24, 2001.
Armynot du Chˆatelet, E., Debenay, J.-P., and Soulard, R.: Foraminiferal proxies for pollution monitoring in moderately polluted harbors, Environ. Pollut., 127, 27–40, 2004.
Aucour, A.-M., Sheppard, S. M. F., and Savoye, R.: δ13C of fluvial mollusk shells (Rhˆone River): A proxy for dissolved inorganic carbon?, Limnol. Oceanogr., 48, 2186–2193, 2003.
Gupta, B. K., Kluwer Academic Publishers, London, UK, 201– 216, 1999.
Boltovskoy, E. and Lena, H.: Seasonal occurrences, standing crop and production in benthic foraminifera of Puerto Deseado, Con-tributions from the Cushman Foundation for Foraminiferal Re-search, 20, 87–95, 1969.
Bouchet, V. M. P., Debenay, J. P., Sauriau, P.-G., Radford-Knoery, J., and Soletchnike, P.: Effects of short-term environmental dis-turbances on living benthic foraminifera during the Pacific oys-ter summer mortality in the Marennes-Ol´eron Bay (France), Mar. Environ. Res., 64, 358–383, 2007.
Bradshaw, J. S.: Laboratory studies on the rate of growth of the foraminifer, “Streblus beccarii (Linn´e) var. tepida (Cushman)”, J. Paleontol., 31, 1138–1147, 1957.
Bradshaw, J. S.: Laboratory experiments on the ecology of foraminifera, Contributions from the Cushman Foundation for Foraminiferal Research, 12, 87–106, 1961.
Buzas, M. A., Hayek, L.-A., Reed, S. A., and Jett, J. A.: Foraminiferal densities over five years in the Indian River La-goon, Florida: A model of pulsating patches, J. Foramin. Res., 32, 68–93, 2002.
Cearreta, A.: Distribution and ecology of benthic foraminifera in the Santo˜na estuary, Spain, Revista Espa˜nola de Paleontolog´ıa, 3, 23–38, 1988.
Chandler, G. T., Williams, D. F., Spero, H. J., and Xiaodong, G.: Sediment microhabitat effect on carbon stable isotopic signatures of microcosm-cultured benthic foraminifera, Limnol. Oceanogr., 41, 680–688, 1996.
Cronin, T. M., Thunell, R., Dwryer, G. S., Saenger, C., Mann, M. E., Vann, C., and Seal II, R. R.: Multiproxy evi-dence of Holocene climate variability from estuarine sedi-ments, eastern North America, Paleoceanography, 20, PA4006, doi:10.1029/2005PA001145, 2005.
Debenay, J.-P., Guillou, J.-J., Redois, F., and Geslin, E.: Distribu-tion trends of foraminiferal assemblages in paralic environments: a base for using foraminifera as bioindicators, in: Environmental Micropaleontology. The application of microfossils to environ-mental geology, edited by: Martin, J. E., Topics in Geobiology, Kluwer Academic/Plenum Publishers, New York, USA, 39–67, 2000.
Debenay, J.-P., Tsakiridis, E., Soulard, R., and Grossel, H.: Factors determining the distribution of foraminiferal assemblages in Port Joinville Harbor (Ile d’Yeu, France): the influence of pollution, Mar. Micropaleontol., 43, 75–118, 2001.
Debenay, J.-P., Bicchi, E., Goubert, E., and Amynot du Chˆatelet, E.: Spatio-temporal distribution of benthic foraminifera in relation to estuarine dynamics (Vie estuary, Vend´ee, W France), Estuar. Coast. Shelf Sci., 67, 181–197, 2006.
Duchemin, G., Jorissen, F. J., Redois, F., and Debenay, J.-P.: Foraminiferal microhabitats in a high marsh: Consequences for reconstructing past sea levels, Palaeogeogr. Palaeocl., 226, 167– 185, 2005.
Gillikin, D. P., and Bouillon, S.: Determination of δ18O of water and δ13C of dissolved inorganic carbon using a simple modifi-cation of an elemental analyzer-isotope ratio mass spectrometer: an evaluation, Rapid Commun. Mass Spectrom., 21, 1475–1478, 2007.
Grossman, E. L.: Stable isotopes in modern benthic foraminifera: a study of vital effect, J. Foramin. Res., 17, 48–61, 1987. Gustafsson, M., and Nordberg, K.: Benthic foraminifera and their
response to hydrography, periodic hypoxic conditions and pri-mary production in the Kolj¨o fjord on the Swedish west coast, J. Sea Res., 41 163–178, 1999.
Hippensteel, S. P., Martin, R. E., Nikita, D., and Pizzuto, J. E.: In-terannual variation of marsh foraminiferal assemblages (Bombay Hook National Wildlife Refuge, Smyrna, De): Do foraminifera assemblages have a memory?, J. Foramin. Res., 32, 97–100, 2000.
Hohenegger, J., Piller, W. E., and Baal, C.: Horizontal and vertical spatial microdistribution of foraminifers in the shallow subtidal Gulf of Trieste, Northern Adriatic Sea, J. Foramin. Res., 23, 79– 101, 1993.
Hut, G.: Stable Isotope Reference Samples for Geochemical and Hydrological Investigations, in: Report on Consultants’ Meet-ing, Vienna, 16-18 September 1985, edited by: Hut, G., IAEA, Vienna, Austria, 1987.
IAEA/WMO: Global Network of Isotopes in Precipitation. The GNIP Database, 2006.
Kim, J.-M. and Kennett, J. P.: Paleoenvironmental changes as-sociated with the Holocene marine transgression, Yellow Sea (Hwanghae), Mar. Micropaleont., 34, 71–89, 1998.
Labeyrie, L. D., Duplessy, J.-C., Duprat, J., Juillet-Leclerc, A., Moyes, J., Michel, E., Kallel, N., and Shackleton, N. J.: Changes in the vertical structure of the North Atlantic Ocean between glacial and modern times, Quat. Sci. Rev., 11, 401–414, 1992. Le Cadre, V. and Debenay, J.-P.: Morphological and cytological
responses of Ammonia (foraminifera) to copper contamination: Implication for the use of foraminifera as bioindicators of pollu-tion, Environ. Pollut., 143, 304–317, 2006.
Leorri, E., Cearreta, A., Irabien, M. J., and Yusta, I.: Geochemical and microfaunal proxies to assess environmental quality condi-tions during the recovery process of a heavily polluted estuary: The Bilbao estuary case (N. Spain), Sci. Total Environ., 396, 12– 27, 2008.
Leorri, E. and Cearreta, A.: Quantitative assessment of the salinity gradient within the estuarine systems in the southern Bay of Bis-cay using benthic foraminifera, Cont. Shelf Res., 29, 1226–1239, 2009.
McGann, M.: High-resolution foraminiferal, isotopic, and trace ele-ment records from Holocene estuarine deposits of San Francisco bay, California, J. Coastal Res., 24, 1092–1109, 2008.
Miyajima, T., Yamada, Y., Hanba, Y. T., Yoshii, K., Koitabashi, T., and Wada, E.: Determinig the stable isotope ratio of total dis-solved inorganic carbon in lake water by GC/C/IRMS, Limnol. Oceanogr., 40, 994–1000, 1995.
Morvan, J., Le Cadre, V., Jorissen, F., and Debenay, J.-P.: Foraminifera as potentiql bio-indicators of the ”Erika” oil spill in the Bay of Bourgneuf: Field and experimental studies, Aquat. Living Resour., 17, 317–322, 2004.
Morvan, J., Debenay, J.-P., Jorissen, F., Redois, F., B´en´eteau, E., Delplancke, M., and Amato, A.-S.: Patchiness and life cycle of
intertidal foraminifera: Implication for environmental and pale-oenvironmental interpretation, Mar. Micropaleontol., 61, 131– 151, 2006.
Murray, J. W.: Ecology and Palaeoecology of benthic foraminifera, Longman Scientific & Technical, Essex (UK), 397 pp., 1991. Murray, J. W.: When does environmental variability become
envi-ronmental change? The proxy record of benthic foraminifera, in: Environmental Micropaleontology. The application of microfos-sils to environmental geology, edited by: Martin, J. E., Topics in Geobiology, Kluwer Academic/Plenum Publishers, New York, USA, 7–37, 2000.
Murray, J. W., and Alve, E.: Major aspects of foraminiferal vari-ability (standing crop and biomass) on a monthly scale in an in-tertidal zone, J. Foramin. Res., 30, 177–191, 2000.
Murray, J. W.: Ecology and Applications of Benthic Foraminifera, Cambridge University Press, Cambridge (UK), 426 pp., 2006. Paulmier, G.: Seston-phytoplancton et microbenthos en riviere
d’Auray leur role dans le cycle biologique des huitres (Ostrea edulis L.), Revue des Travaux des Pˆeches Maritimes (ISTPM), 36, 375–506, 1972.
Peros, M. C., Reinhardt, E. G., Schwarcz, H. P., and Davis, A. M.: High-resolution paleosalintiy reconstruction from Laguna de la Leche, north coastal Cuba, using Sr, O, and C isotopes, Palaeo-geogr. Palaeocl., 245, 535–550, 2007.
Platon, E., Sen Gupta, B. K., Rabalais, N. N., and Turner, R. E.: Effect of seasonal hypoxia on the benthic foraminiferal commu-nity of the Louisiana inner continenatal shelf: the 20th century record, Mar. Micropaleont., 54, 263–283, 2005.
Polovodova, I., Nikulina, A., Sch¨onfeld, J., and Dullo, W. C.: Re-cent benthic foraminifera in the Flensburg Fjord (Western Baltic Sea), J. Micropalaeontol., 28, 1–14, 2009.
Polyak, L., Stanovoy, V., and Lubinski, D. J.: Stable isotopes in ben-thic foraminiferal calcite from a river-influenced Arctic marine environment, Kara and Pechora Seas, Paleoceanography, 18(1), 1003, doi:10.1029/2001PA000752, 2003.
Redois, F. and Debenay, J.-P.: Influence du confinement sur la r´epartition des foraminiferes benthiques: exemple de l’estran d’une ria mesotidal de Bretagne m´eridional, Revue de Pal´eobiologie, 15, 243–260, 1996.
Reinhardt, E. G., Fitton, R. J., and Schwarcz, H. P.: Isotopic (Sr, O, C) indicators of salinity and taphonomy in marginal marine environments, J. Foramin. Res., 33, 262–272, 2003.
Rohling, E. J. and Cooke, S.: Stable oxygen and carbon isotopes in foraminiferal carbonate shells, in: Modern Foraminifera, edited by: Sen Gupta, B. K., Kluwer Academic Publishers, Cornwall, 239–258, 1999.
Scheurle, C. and Hebbeln, D.: Stable oxygen isotopes as recorders of salinity and river discharge in the German Bight, North Sea, Geo-Mar. Lett., 23, 130–136, 2003.
Shackleton, N. J.: Attainment of isotopic equilibrium between ocean water and the benthonic genus Uvigerina; Isotopic changes in the ocean during the last glacial, Colloques Internationaux du C.N.R.S., 219, 203–219, 1974.
Swallow, J. E.: Intra-annual variability and patchiness in living as-semblages of salt-marsh foraminifera from Mill Rythe Creek, Chichester Harbour, England, J. Micropaleontol., 19, 9–22, 2000.
Thomas, E., Gapotchenko, T., Varekamp, J. C., Mecray, E. L., and Buchholtz ten Brink, M. R.: Benthic foraminifera and