HAL Id: hal-02598517
https://hal.inrae.fr/hal-02598517
Submitted on 15 May 2020
HAL is a multi-disciplinary open access
archive for the deposit and dissemination of
sci-entific research documents, whether they are
pub-lished or not. The documents may come from
teaching and research institutions in France or
abroad, or from public or private research centers.
L’archive ouverte pluridisciplinaire HAL, est
destinée au dépôt et à la diffusion de documents
scientifiques de niveau recherche, publiés ou non,
émanant des établissements d’enseignement et de
recherche français ou étrangers, des laboratoires
publics ou privés.
Mapping natural habitats using remote sensing and
sparse partial least square discriminant analysis
C. Corbane, Samuel Alleaume, M. Deshayes
To cite this version:
C. Corbane, Samuel Alleaume, M. Deshayes. Mapping natural habitats using remote sensing and
sparse partial least square discriminant analysis. GI_Forum, Jul 2013, Salzbourg, Austria.
pp.221-225, �10.1553/giscience2013s504�. �hal-02598517�
Mapping natural habitats using remote sensing and
Sparse Partial Least Square Discriminant Analysis
Christina CORBANE, Samuel ALLEAUME and Michel DESHAYES
Irstea, UMR TETIS, Montpellier/ France · [email protected]
1.
Introduction
In this paper, we tested a relatively new version of the Partial Least Square (PLS) method called the Sparse Partial Least Square Discriminant Analysis (SPLSDA). This improved method performs variable selection and classification in a one-step procedure and has been successfully applied in the field of bioinformatics (Lê Cao et al., 2011). We are applying the method on remote sensing data for the classification of natural and semi-natural habitats in a Natura 2000 site located in Southern France. The work has been performed in the framework of the MS.MONINA FP7 project which is using the potential of GMES for the development of a multi-scale mapping service aimed at monitoring European protected habitats and species at the local, regional and continental scales.
2.
Material and methods
2.1. Area of investigation
The area of investigation known as the “Foothills of Larzac” comprises a Natura 2000 site located in the French Mediterranean biogeographical region and covers an area of 5310 ha. It is situated in southern Massif Central, between Millau (Aveyron) and Lodève (Hérault) (Central coordinates: 3°24'29'' E; 43°45'56'' N).
2.2. Datasets
The remote sensing data comprise two RapidEye images acquired on 23 June 2009 and 08 July 2010. These images are part of two complete and consistent coverage of the French territory at a very high spatial resolution. A complete coverage for 2011 is currently under production. Hence, we consider that the methodology developed on our pilot site could serve as a basis for an approach that is transferable across the 48 Natura 2000 listed sites located in the French Mediterranean biogeographically region and covered by multi-date RapidEye data (5m spatial resolution and 5 spectral bands). For each image, the Normalised Difference Vegetation Index (NDVI) was calculated and used as a surrogate for vegetation productivity. In this study, elevation data has been integrated with remote sensing data for its potential influence on the spatial distribution of the habitats present in the study area. A Digital elevation model (DEM) with 25-meter grid cells provided by IGN, the French geopgraphic institute, was used. The DEM served as a basis for the calculation of the Topographic Position Index (TPI). This index is a flexible way to define the relative position of a location along a topographic gradient. For our study, two TPI have been calculated with a radius of 5 and 25 meters respectively.
222
The SPLSDA method used in this study belongs to the family of supervised classification algorithms. In the supervised classification framework, the classifier needs to be trained using a sample of homogeneous areas that can be identified either directly on the image or using thematic products (e.g. existing maps), or derived from field visits or through the combination of both approaches. In our case, a map of natural habitats at a nominal scale of 1/25 000 has been provided by the Conservatoire des Espaces Naturels du Languedoc
Roussillon (CEN-LR). The map was elaborated in 2007 by manual photointerpretation of
aerial photos complemented by field visits. The map covers the Natura 2000 site only partially, but extends beyond its boundaries allowing us to test our method not only within the limits of the Natura 2000 site but also in its surroundings. In this study, only habitat classes that correspond to non-agricultural vegetation classes with a minimum area of 1 ha were considered. Finally, from the initial 52 habitat classes, 15 classes were used for the sample selection (Table 1). For each class, half of the total polygons assigned to one specific class has been used for calibrating the SPLSDA algorithm (training set) and the other half has been used for evaluating the quality of the predicted classes (evaluation set).
Table 1: The main natural habitats existing in the Foothills of Larzac Natura 2000 site.
Each class of habitat is assigned a code according to the European Corine Biotope classification system that was developed in the 1980s and used to derive the habitats, meeting the requirements of the Habitats Directive.
2.3. Methodological framework
The method was implemented in an object-oriented image analysis framework. Hence the first step of the method consisted in the segmentation of the remote sensing data with the purpose of generating meaningful image objects. This phase drives the next steps of variable extraction to be used in the SPLSDA algorithm. The segmentation was performed using eCognition. The RapidEye image of 08 July 2010 with its 5 spectral bands was used as a basis for the segmentation because it showed the highest contrast. The following segmentation parameters gave the best results by generating the smallest possible number of image objects whilst providing homogenous objects in terms of the targeted habitat classes: colour= 0.8, shape= 0.2, compactness= 0.1, smoothness= 0.9, scale = 10. The image objects obtained from the segmentation can be characterized by features of different origins, spectral values (e.g. Mean values of image objects, brightness, etc.), texture (e.g. calculated on the gray level co-occurrence matrix (GLCM) and on the gray level difference vector (GLDV), etc.), context relationships and thematic or continuous information supplied by ancillary data. The next step consisted in extracting features for each image object falling within a class of habitat from the reference map on habitats. Hence for each of the 15 classes of habitats, image objects falling within this class were selected and defined by several features. A total of 98 object features including spectral, textural and
31.812 Blackthorn-privet scrub 38.22 Medio-European lowland hay meadows 32.11 Evergreen oak matorral 41.714 Eu-Mediterranean white oak woods 32.162 Western deciduous oak matorral 41.9 Chesnut woods
32.64 Supra-Mediterranean box scrub 42.67 Black pine reforestation
32.A Spanish-broom fields 44.63 Mediterranean riparian ash woods 34.332 Middle european xerobromion grasslands 45.313 Catalo-Provencal hill holm-oak forest 34.36 Phoenician torgrass swards 81.1 Improved grasslands
34.721 Aphyllanthes grasslands
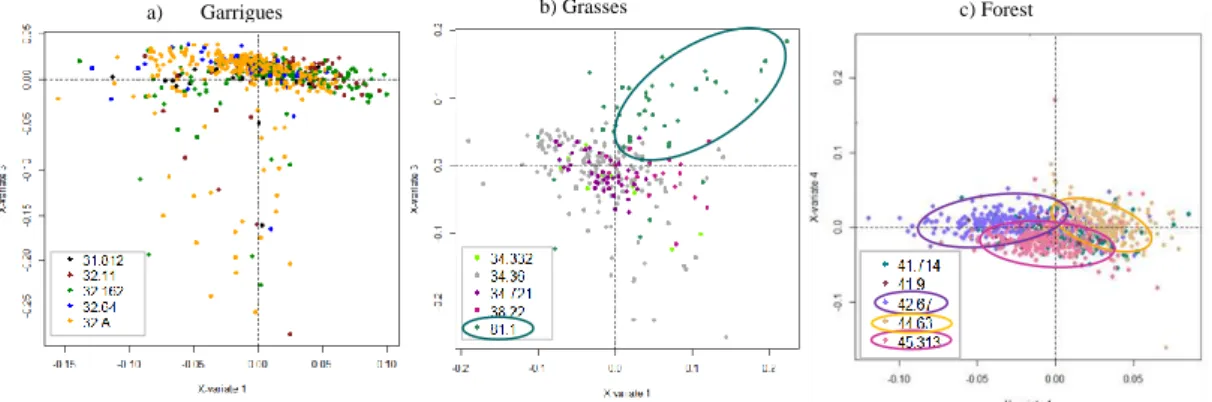
b) Grasses c) Forest a) Garrigues
thematic features (derived from the TPI) features were calculated and used as variables for input to the SPLSDA. Given the large number of habitat classes to identify (15 classes in total) and the difficulty in interpreting the visual and numerical results of the SPLSDA, the analysis of the sample dataset was conducted through a stepwise procedure. In a first step, the samples were grouped into three broad physiognomic categories of vegetation: a “Garrigues” group including all habitats that correspond to low, soft-leaved scrubs (31.812; 32.11; 32.64; 32.162; 32.A), a “Grasses” group including habitats with a herbaceous vegetation cover mainly composed of graminea (34.332, 34.36, 34.721, 38.22, 81.1) and a “Forest” group representing habitats with a high density of trees (41.714, 41.9, 42.67, 44.63, 45.313). Such a grouping of habitat classes is based on the hypothesis that physiognomic characteristics of vegetation can be readily distinguished in remote sensing data due to the signature of the dominant communities. In a second step, SPLSDA analysis is run sequentially on each of the three groups of habitats to analyze the within-group separability and to see which classes of habitats can to be considered separately from the rest of the physiognomic group. At each step which is the number of dimensions or variates to choose was set to where is the number of classes of the group. For selecting the number of variables to keep on each dimension, we plotted the mean classification error rate (10-cross-validation averaged 10 times) for each SPLSDA dimension. The estimated average error rate is an indication on the optimal number of variables to be selected. Once the most discriminant variables have been selected, the next step has been to run SPLSDA model on all the image objects resulting from the segmentation that fall within the area of investigation to produce the final classification. The accuracy of the map of predicted habitat classes was finally analyzed using the evaluation set. All the methods were implemented in R statistical software.
3.
Results
Figures 1a, 1b and 1c represent the samples by habitat type within each of the three groups (Garrigues, Grasses and Forest groups respectively) as a function of the variables selected by the SPLSDA. We show here only the dimensions (variates) that show the most evident similarities and dissimilarities between the samples.
These results show that it is impossible to differentiate the different classes of habitats within the Garrigues group (Fig. 1a). Inversely the isolation of class 81.1 from the rest of
a) Garrigues
224
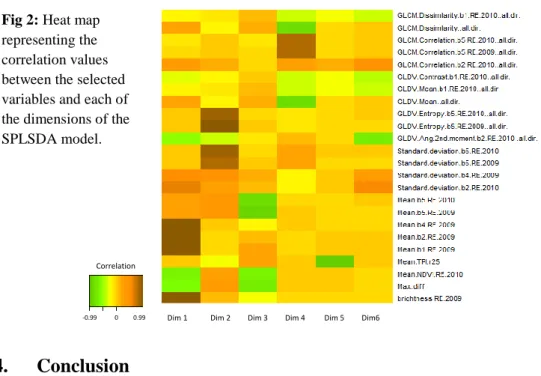
the habitats of the Grasses group as shown in Fig.1b indicates that this class can be classified separately. The same applies to classes 42.67, 44.63 and 45.313 of the Forest group (Fig. 1c). Therefore, the next step consisted in running the SPLSDA analysis with the following classes: Garrigues, Grasses, Improved grassland (class 81.1.), Black pine (class 42.67), Mediterranean riparian ash woods (class 44.63), Catalo-Provencal hill holm-oak forest (class 45.313) and Other Forests. An analysis of the mean classification error rate (10 cross-validation averaged 10 times) for each SPLSDA dimension showed that the lowest error rate (r2= 0.37) was observed for H = 6 dimensions and KeepX= 4 selected variables on each dimension. These parameters were used to build the final SPLSDA classification model. The selected variables that strongly contribute to the discrimination of the 7 classes of habitats are shown in Fig.2 and are highlighted by high correlation values with the latent variables (e.g. the spectral features of the RapidEye image in 2009 on dimension 1 and the textural features of the RapidEye image in 2010 on dimensions 2 and 4). The validation of the final map of the predicted habitat classes gave an error rate of 0.36. The latter was considered satisfactory due to the complexity of the habitat mosaics in the study area.
4.
Conclusion
The SPLSDA variable selection and classification method is a simple and reliable approach for the classification of natural and semi-natural habitats with remote sensing data. The most important advantage is the transferability of the approach to other Natura 2000 sites with different types of habitats. The recent successful implementation of the method on the Lagoons of Palavas site using colour infrared aerial photos is an evidence of its potential for habitats mapping.
References
LÊ CAO, K.-A., BOITARD, S., & BESSE, P. (2011), Sparse PLS discriminant analysis: biologically relevant feature selection and graphical displays for multiclass problems. BMC Bioinformatics 12 (253).
Correlation
-0.99 0 0.99
Correlation
Dim 1 Dim 2 Dim 3 Dim 4 Dim 5 Dim6
-0.99 0 0.99
Fig 2: Heat map
representing the correlation values between the selected variables and each of the dimensions of the SPLSDA model.