HAL Id: hal-01567911
https://hal.archives-ouvertes.fr/hal-01567911
Submitted on 16 Mar 2019
HAL is a multi-disciplinary open access
archive for the deposit and dissemination of
sci-entific research documents, whether they are
pub-lished or not. The documents may come from
teaching and research institutions in France or
abroad, or from public or private research centers.
L’archive ouverte pluridisciplinaire HAL, est
destinée au dépôt et à la diffusion de documents
scientifiques de niveau recherche, publiés ou non,
émanant des établissements d’enseignement et de
recherche français ou étrangers, des laboratoires
publics ou privés.
Epidemiological feedbacks affect evolutionary emergence
of pathogens
Matthew Hartfield, Samuel Alizon
To cite this version:
Matthew Hartfield, Samuel Alizon.
Epidemiological feedbacks affect evolutionary emergence
of pathogens.
American Naturalist, University of Chicago Press, 2014, 183 (4), pp.E105-17.
�10.1086/674795�. �hal-01567911�
Epidemiological Feedbacks Affect Evolutionary Emergence of Pathogens.
Author(s): Matthew Hartfield and Samuel Alizon
Source: The American Naturalist, Vol. 183, No. 4 (April 2014), pp. E105-E117
Published by: The University of Chicago Press for The American Society of Naturalists
Stable URL: http://www.jstor.org/stable/10.1086/674795
.
Accessed: 21/03/2014 01:47
Your use of the JSTOR archive indicates your acceptance of the Terms & Conditions of Use, available at
.
http://www.jstor.org/page/info/about/policies/terms.jsp
.
JSTOR is a not-for-profit service that helps scholars, researchers, and students discover, use, and build upon a wide range of content in a trusted digital archive. We use information technology and tools to increase productivity and facilitate new forms of scholarship. For more information about JSTOR, please contact [email protected].
.
The University of Chicago Press, The American Society of Naturalists, The University of Chicago are collaborating with JSTOR to digitize, preserve and extend access to The American Naturalist.
vol. 183, no. 4 the american naturalist april 2014
E-Article
Epidemiological Feedbacks Affect Evolutionary
Emergence of Pathogens
Matthew Hartfield* and Samuel Alizon
Laboratoire Maladies Infectieuses et Vecteurs: Ecologie, Ge´ne´tique, Evolution et Controˆle (Unite´ Mixte de Recherche CNRS 5290, Institut de Recherche pour le De´veloppement [IRD] 224, Universities of Montpellier 1 and 2), 911 Avenue Agropolis, B.P. 64501, 34394 Montpellier Cedex 5, France
Submitted June 28, 2013; Accepted September 26, 2013; Electronically published February 11, 2014 Online enhancement: appendix, zip file. Dryad data: http://dx.doi.org/10.5061/dryad.kj238.
abstract: The evolutionary emergence of new pathogens via mu-tation poses a considerable risk to human and animal populations. Most previous studies have investigated cases where a potentially pandemic strain emerges though mutation from an initial mal-adapted strain (i.e., its basic reproductive ratio R0!1). However, an
alternative (and arguably more likely) cause of novel pathogen emer-gence is where a “weakly adapted” strain (with R0≈ 1) mutates into
a strongly adapted strain (with R0k1). In this case, a proportion
of the host susceptible population is removed as the first strain spreads, but the impact this feedback has on emergence of mutated strains has yet to be quantified. We produce a model of pathogen emergence that takes into account changes in the susceptible pop-ulation over time and find that the ongoing depletion of susceptible individuals by the first strain has a drastic effect on the emergence probability of the mutated strain, above that assumed by just scaling the reproductive ratio. Finally, we apply our model to the docu-mented emergence of Chikungunya virus on La Re´union Island and demonstrate that the emergence probability of the mutated strain was reduced approximately 10-fold, compared to models assuming that susceptible depletion would not affect outbreak probability. These results highlight the importance of taking population feedbacks into account when predicting disease emergence.
Keywords: epidemiology, evolution, outbreaks, pathogen emergence,
changing population sizes, Chikungunya virus.
Introduction
The emergence of new pathogens arising from preexisting zoonotic or human strains poses a major worldwide health risk. For humans, the most well-documented examples include pathogens spilling over from zoonotic reservoirs (Wolfe et al. 2007), but this is not the only mechanism that can lead to emergence. An existing pathogen could be contained with a low rate of spread but then create a
* Corresponding author; e-mail: [email protected].
Am. Nat. 2014. Vol. 183, pp. E105–E117.䉷 2014 by The University of Chicago. 0003-0147/2014/18304-54776$15.00. All rights reserved.
DOI: 10.1086/674795
stronger outbreak, either due to the pathogen mutating or to environmental change. For example, there exists evi-dence that following a vaccination program, new patho-genic strains can arise that ave evolved so are resistant to existing treatment (Gandon and Day 2008). Pathogen emergence also poses a severe risk to livestock populations (e.g., through foot and mouth disease; Woolhouse et al. 2012), and plant crop populations (Fargette et al. 2006). It is therefore important to ascertain when spillovers and emergence of new outbreaks are likely to occur, especially from preexisting strains, in order to monitor and control their spread (Arinaminpathy and McLean 2009; Pe´rez-Reche et al. 2012).
Stochasticity has long been known to be at the heart of emergence processes because in the initial stages of an outbreak the number of infected hosts is very dlow. In a deterministic model, the spread of a pathogen strain in a host population is governed solely by the number of sec-ondary infections it generates, which is the basic repro-ductive ratio R0(Anderson and May 1991). In stochastic
models, this is not the case as the number of secondary infections caused by each infected host is drawn from a distribution. For instance, if the duration of infection is exponentially distributed and contacts follow a Poisson pro-cess, then the probability of emergence equals 1 ⫺ 1/R0
(Diekmann and Heesterbeek 2000). Additionally, the role of pathogen evolution and migration in causing new out-breaks in novel populations has been recognized and widely studied (recently reviewed in Gandon et al. 2013). Previous models highlighted the important fact that even benign strains can be dangerous, as even though they are due to become extinct, they may persist in large popu-lations long enough to give rise to well-adapted mutants that can subsequently cause an outbreak (Antia et al. 2003; Iwasa et al. 2003, 2004). The effect of pathogen life history (Andre´ and Day 2005) and population structure (Alex-ander and Day 2010; Kubiak et al. 2010) have also been
Table 1: Nomenclature used for different epidemic states
Reproductive
ratio Name Properties
R0!1 Maladapted Guaranteed to become
extinct unless mutation occurs
R0p1⫹ y, yK1
Weakly adapted Can cause a large out-break, but likely to be-come extinct by drift R0k1 Strongly adapted Almost certain to cause a
major epidemic in the population
modeled, as well as the effect of host heterogeneity and assortative mating (Yates et al. 2006).
Importantly, previous models have focused on the case where the pandemic (well-adapted) strain, with an R011,
emerges through mutation from a maladapted strain, with an R0! 1, which is bound to become extinct rapidly (see
table 1 for the nomenclature we use to denote general R0
values for different strains). However, this is not the only scenario that can lead to a pandemic, nor arguably the likeliest. An alternate scenario, which has received less at-tention, is where an intermediately adapted strain would first create an initial outbreak, which would be limited in spread as it would have a low R0 close to 1. A mutation
could then arise in one individual that would subsequently increase the R0 of the pathogen to a much higher level,
creating a more potent outbreak. This type of emergence, from a limited to a large outbreak, plays an important role in the transferring of zoonotic pathogens into complete human agents (Wolfe et al. 2007). This scenario is also an example of “evolutionary rescue” (Gonzalez et al. 2013), where evolution is needed to prevent quick extinction of the weaker strain, which can also be important regarding the emergence of novel drug-resistant strains at the intra-host, cellular level (Alexander and Bonhoeffer 2012).
Although this scenario is more likely to occur for many microparasitic infections (because the initial and the mu-tant strain are likely to be antigenically close), it is also more difficult to capture mathematically because it leads to the violation of one of the important simplifying as-sumptions made by earlier models. When a pathogen mu-tates from R0! 1 to R0 k1, it is safe to assume that the
number of hosts infected by the initial (maladapted) strain is negligible. However, if R01 1 initially, then the
suscep-tible population would, in general, reduce over time as individuals become immune or die out. This reduces the emergence probability of the second strain, as there are fewer susceptible individuals available to transmit the pathogen to. Furthermore, the initial strain might continue to spread for awhile, hence further depleting the pool of susceptible hosts available to the mutant strain. This pro-cess is likely to arise due to infection by the first strain rendering the host immune to the mutant strain (cross-immunity), which is the basis for vaccination (Keeling and Rohani 2007).
A model incorporating such population dynamics feed-backs is needed to allow the analysis of several outbreaks. For instance, mutations arising in the vector-borne Chi-kungunya virus around the Indian Ocean caused a new infection wave to arise, with a higher reproductive rate, from an initially smaller one where viruses had a lower reproductive rate (Schuffenecker et al. 2006). The first strain, which created a minor outbreak in May–June 2005 at La Re´union (Renault et al. 2007), seemed to have an
R0 of around 1, because while it did not greatly increase
in frequency over time, it was maintained in the popu-lation at a low frequency. The second strain, which appears to consistently differ from the first by two point mutations (Schuffenecker et al. 2006), created a major outbreak in La Re´union over January and February 2006 (Renault et al. 2007). Further analyses revealed that this mutated strain was particularly well adapted to exploit the mosquito vec-tor Aedes albopictus (Vazeille et al. 2007), the dominant vector on the island, infecting it in around 90% of cases, while experimental infections of vectors using the previous strain only had a success rate of around 20%. This effect most likely explains the increase in its R0. Additionally,
these virus mutations seem to have occurred indepen-dently in several distant populations (de Lamballerie et al. 2008), which underlines the importance of virus evolution in triggering further outbreaks. Finally, it is known that recovering from a Chikungunya infection generates a strong immunity, which seems to target both the initial and the mutated strain (Renault et al. 2007).
Another example is the so-called Spanish flu of 1918, which started with a mild first wave in summer 1918, before a second wave was triggered in August that caused millions of deaths (Frost 1919). However, it is unknown whether the more virulent second wave was caused due to the strain evolving or due to demographic or environ-mental changes (Me´thot and Alizon 2014). Again, cross-immunity is thought to be strong for antigenically close influenza viruses (Ferguson et al. 2003). Modeling this evolutionary process can therefore provide insight into the possible causes of the onset of the second strain.
Finally, in a modeling study of dengue fever, Lourenc¸o and Recker (2010) found that novel strains of the disease had their highest emergence probability when existing strains are at a low frequency. This is because invasion of new genotypes can be hampered by competition from ex-isting strains, exemplifying how population feedbacks can prevent the spread of new strains, in a manner similar to the above examples.
Mutation Creating a New Outbreak E107 Table 2: Glossary of notation
Symbol Usage
R0 Basic reproductive ratio of first outbreak
F0 Basic reproductive ratio of second (mutated)
outbreak
b1, b2 Transmission rate of first, second pathogen
d1, d2 Total removal rate of first, second pathogen
m Mutation rate from first to second strain S Size of susceptible class (number of individuals) I1, I2 Size of those infected with first, second
pathogen
R Size of removed class
N Total host population size (S⫹ I1⫹ I2⫹ R)
Q Extinction probability in an nonequilibrium population for a single strain
P Extinction probability in an nonequilibrium population if a strain is already present Pemer Overall probability of mutated strain emerging
A
B
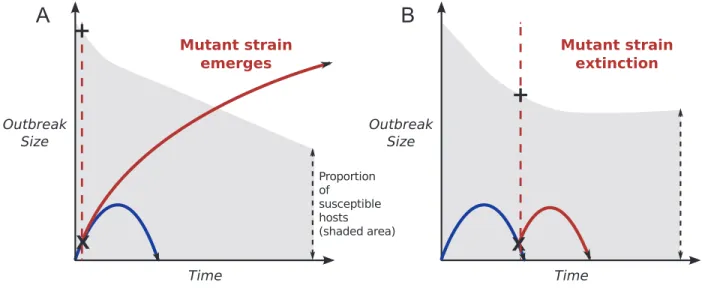
Figure 1: A schematic of the model and second-strain emergence possibilities. A, An adaptive mutation arises early on as the first strain
is emerging (denoted by X). As there are enough susceptible individuals present (denoted by gray shading; the plus sign (⫹) indicates susceptible frequency when the second strain arises) then this strain can emerge into a stronger outbreak. B, The second strain appears later on and has less chance of emerging due to fewer susceptible individuals present. Therefore it is more likely to become extinct.
Here, we outline an analytical model to investigate the effect of epidemiological feedbacks on pathogen emer-gence. We derive the probability that, given an initial weakly spreading pathogen (R0close to but exceeding 1),
it can mutate into a second pathogen with a much greater rate of spread (R0). We form this probability via a
two-step model. In the first stage, the initial pathogen spreads deterministically but can mutate into a new strain at any time before it goes extinct. The second stage calculates the probability that this second strain emerges, instead of be-coming extinct by drift. We find that the ongoing depletion of the susceptible population by the initial strain drastically reduces the emergence probability, compared to classical branching process results that assume that the susceptible population remains fixed as the new strain emerges (Allen 2008). We produce analytical solutions for the probability of emergence in this scenario, which we show to be ac-curate when compared to stochastic simulations. Specifi-cally, we derive an equation for the emergence probability for the second strain, while accounting for the feedback that causes continual depletion of the susceptible popu-lation (an effect often overlooked in emergence modeling), and show how this mechanism drastically decreases the emergence probability. Our model therefore highlights how epidemiological feedbacks can strongly affect emer-gence probabilities of emerging strains. Finally, we apply our model to the Chikungunya virus outbreak in La Re´-union and show the severe reduction in emergence prob-ability due to susceptible depletion, which could
counter-act the adaptive ability of the initial strain and limit the possibility for future outbreaks to arise.
Model Formulation and Analysis
Model Outline
In order to produce the probability of emergence of a mutated strain, we proceed as follows. A schematic of the process is outlined in figure 1, and table 2 outlines the notation used in this model. We first assume that an initial
strain is spreading throughout the population with repro-ductive ratio R0. Generally, this R0 will be close to but
exceeding 1; additionally, we assume that the epidemic is not lost in its early stages and generates a small outbreak. Therefore, the first strain will spread in a fairly determin-istic manner and exists for long enough to potentially mutate into a new strain. Second, at any point in time during the emergence of this first strain, one of the hosts infected by this initial strain can transmit a pathogen that mutated into a more forceful strain (defined here as having a larger reproductive ratio, F0 1 R0). The emergence of
mutated strains therefore depends on a balance between the size of the initial outbreak at a certain time, which determines the overall probability of mutation, and there being enough susceptible hosts to enable the second strain to spread, while the first strain is still transmitting infection.
The second (mutated) strain can emerge in the host population with probability P. In traditional epidemic models, P is equal to 1 ⫺ 1/F0 (Allen 2008). However,
this result assumes that the underlying host population is fully susceptible. This assumption is violated in this model in two ways. First, the initial strain is still spreading as the second strain emerges, using up the underlying susceptible population. Additionally, the second strain can appear at any time during the spread of the first strain (fig. 1); unless the second strain appears as the first strain is emerging, then the assumption of a fully susceptible population is also vi-olated. Normally, the effects of a partially susceptible pop-ulation are accounted for by using an “effective” repro-ductive ratio, P p 1⫺ 1/F0, eff, where F0, eff pF0(S/N)
(McCallum et al. 2001; Lloyd-Smith et al. 2005a). How-ever, this term does not take epidemiological feedbacks into account due to ongoing susceptible depletion and will therefore overestimate the actual emergence probability. We will subsequently discuss an approximation for P that can be used to provide an accurate emergence probability in this case, which accounts for both the susceptible pop-ulation present when a new strain emerges and how it is affected by subsequent population feedbacks. Finally, by integrating these probabilities over the entire course of the initial epidemic, we obtain the overall probability of the second strain emerging and causing a major outbreak.
Derivation of Model
Assume that the dynamics of the first strain are governed by a traditional susceptible-infected-removed (SIR) model (Anderson and May 1991), as given by the following set of differential equations: dS S p⫺ b1 I ,1 (1a) dt N dI1 S p
(
b1 ⫺ d I ,1)
1 (1b) dt N dR pd I ,1 1 (1c) dtwhere S, I1, and R are the absolute number of susceptible,
infected, and either recovered and/or immunized individ-uals present at time t; N is the total population size; b1is
the transmission rate of new infection on contact; and d1
is the recovery rate. Note that these equations sum to 0, indicating that the population size N is constant over time (as dN/dt p 0). Also note that in the long-term, the initial and mutated pathogens will both become extinct, as I1
goes to 0 if the susceptible population becomes too low to carry an epidemic. However, it still makes sense to discuss pathogens emerging as there is a certain time frame at the start of an epidemic when the pathogen reaches a high-enough frequency and spreads in a fairly determin-istic manner (Allen 2008; Hartfield and Alizon 2013b).
In order to track the deterministic spread of the first pathogen strain, an analytical form for I1as it changes over
time is needed. However, it is not possible to solve equa-tion (1) analytically to find I1as a function of t. To make
progress, we follow the approach used in Hansen and Day (2011) and note that since the current number of suscep-tible hosts S is a strictly decreasing function of time, then we can rewrite equations (1) as functions of S instead. Specifically, by dividing equation 1b by equation (1a), we obtain:
dI1 N
p ⫺ 1. (2)
dS SR0
Here, R0p b1/d1and is the basic reproductive ratio of
the epidemic (Anderson and May 1991). Equation (2) makes explicit that if the population is fully susceptible (N p S), the epidemic can spread deterministically if R0 1 1. We can solve this differential equation with the
condition I1(S p N) p I0to obtain:
N N
I (S) p (N1 ⫺ S) ⫺ log
( )
⫹ I .0 (3) R0 SNormally, I0 p 0; that is, if the population is fully susceptible, then no infected individuals exist. However, this formalization does not take into account the fact that if the epidemic escapes stochastic loss, then it will increase in frequency faster than predicted by the deterministic rate of change (eq. [2]). This is because there is a large sto-chastic effect on trait frequency when it is rare, and cases
Mutation Creating a New Outbreak E109 where the trait increases in frequency faster than expected
are more likely to lead to the new trait emerging. This is a well-known issue in population-genetic studies of emer-gence of new adaptive traits (Maynard Smith and Haigh 1974; Otto and Barton 1997; Barton 2000). To correct for this effect, it is sufficient to simply increase the initial frequency of the pathogen I0, in order to account for this
oversampling (Barton 1994), and to minimize the effects of drift while the trait is emerging. We set it to 5/log(R0),
which is the number of infected individuals needed to make it unlikely (P!.005) that the strain is lost by drift
in a large population (Hartfield and Alizon 2013b). Note that when we compared our model to simulations, this frequency was reduced to 1/log(R0) for N p 100, as
oth-erwise the previous threshold would exceed N if R0 was
small enough, due to this result primarily holding for large populations.
For a specific number of susceptible hosts S, a current infection can mutate with probability m into a new strain; assuming that mK1, so that it is rare for more than one
new mutant to appear per generation, then the probability that a new strain appears by mutation is mI1(S). The new
strain can then fully emerge and overcome stochastic loss with probability P(S). In order for this strain to never emerge at all, then at each time step a mutant strain never emerges; the probability of this at a single time point is 1 ⫺ mI1(S)P(S). One minus this probability, multiplied
for all time points, is the probability Pemerthat a mutant
strain ultimately emerges. That is,
S0
Pemerp1⫺
写
(1⫺ mI (S)P(S)),1 (4)SpSmin
where Sminis the minimum susceptible population needed
to give a nonzero emergence probability of the mutant strain. If each probability P(S) is small, then we can ap-proximate this product function by an exponential integral (see Hartfield and Otto 2011 for a similar derivation):
S0
Pemer≈ 1 ⫺
写
exp (⫺mI (S)P(S))1 (5a)SpSmin S0 p1⫺ exp ⫺
(
冘
mI (S)P(S)1)
(5b) SpSmin S0 ≈ 1 ⫺ exp ⫺(
冕
mI (S)P(S) .1)
(5c) SpSminTo complete this derivation, we need to find an analytical form for P(S) and Smin, which we will analyze in turn.
Probability of a Mutant Strain Emerging (P(S)). In the appendix (and supplementary material S1, available online), we derive the form for the emergence probability of a mutant strain, given that the susceptible population is being depleted by a preexisting strain (strain 1):
F0 N F0⫺ 1 ⫺(F ⫺1)/F 0 0 P(S) p
[ (
1⫺ 1⫺ e)]
, (6)I (S)R1 0⫹ F0 S F0
where F0 is the reproductive ratio of the mutant strain.
This equation assumes that the rate at which an infection ends are approximately equal for both strains; we will show that for R0close to 1, this solution remains accurate, even
if the recovery rates differ. The important thing to note is that not only is part of this solution proportional to N/S (reflecting the growth rate R0decreasing by a fraction
S/N as susceptible individuals are removed), but it is also proportional to 1/(I1R0⫹ F0). This highlights the fact that
even as the second strain appears by mutation and spreads, the emergence probability is decreasing during this initial phase, as the susceptible population is reduced due to the continuing spread of the first strain. This formulation as-sumes complete cross-immunity is present between the original and mutated strains. It also assumes that the death rates for both strains are approximately equal, so that the final equation is only given as a function of reproductive ratios, which are easier to measure from empirical data. We will show that this equation to remain accurate if R0
is close to 1, even if the death rates differ.
Minimum Susceptible Level (Smin)
The lowest limit of S for the emergence of the mutant strain to be possible depends on which limit is attained first. Either the first strain I1 exhausts itself (by running
out of hosts to infect), therefore there are no infected individuals that can mutate into the second strain. This arises when equation (3) equals 0, which holds for
N ⫺ R (N⫹I )]/N[ ] 0 0
Smin , 1p⫺ W (Z⫺R e0 ), (7)
R0
where WZ is the Lambert W function (Abramowitz and
Stegun 1970) and I0the initial frequency of the first strain.
Note that this limit is determined solely by the reproduc-tive ratio of the first strain (R0). Alternatively, S can drop
low enough so that P falls below zero; that is, there are no longer enough susceptible individuals in the population that can carry a new epidemic if it appears. In this case, the lower limit for S is
F0⫺ 1 ⫺(F ⫺1)/F0 0
Smin , 2pN 1
(
⫺ e)
. (8) F0In contrast, Smin, 2 is determined solely by the
repro-ductive ratio of the second, mutated strain (F0). Overall,
the lower limit of integration Sminis the maximum out of
Smin, 1or Smin, 2; that is, either when the first epidemic
ex-hausts itself or when there are no longer susceptible in-dividuals present to carry a new infection, whichever limit is reached first.
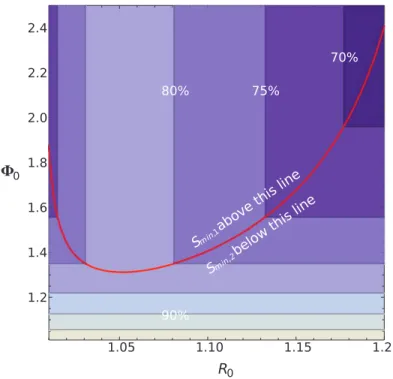
Figure 2 displays Sminas a function of the reproductive
ratios of both strains (R0and F0). In general, we see that
as R0increases, the limitation on emergence is caused by
the burnout of the susceptible population by the first strain. What is unexpected is that the increase in the boundary between Smin, 1and Smin, 2is nonlinear as a
func-tion of R0. This is due to the fact that not only are
sus-ceptible individuals being removed after the first strain clears (reducing emergence probability by a factor of S/N at a set timepoint) but also that the susceptible population continues to decrease as the second strain emerges because the first strain is still spreading. This nonlinearity with increased R0 clearly illustrates how ongoing feedbacks,
which are usually neglected in epidemiological models, lead to a larger, negative effect on pathogen emergence.
Note also that if R0 is very close to 1 (less than 1.04
with the default parameter used in fig. 2), Smin, 2becomes
more likely to determine the the minimum susceptible population size Smin (i.e., Sminp Smin, 2 in this parameter
space), even though the first infection should not spread for a long time. This is due to the fact that our assumption of an increased I0 value has important consequences for
these small R0values, as the maintenance of weakly
spread-ing strains by drift can create more opportunities for emerging strains to arise, compared to deterministic mod-els where these pathogens quickly become extinct. How-ever, this does not appear to make the analytical results inaccurate compared to simulations, as the high I0
com-pensates for the fact that the infected population size drifts at low frequency (if it does not become extinct), which can create more frequent opportunities for adaptation. Furthermore, the maintenance of this weak strain at a low frequency, rather than having it rapidly spread, will not create large feedbacks that can deplete existing susceptible populations, which can be the case if initial R0 is higher.
This effect dissipates with increased population size, as drift effects are reduced in larger populations (see fig. S1 and supplementary material S2 for a similar plot but with N p 100,000).
Simulation Methods
In order to test the accuracy of these solutions, we compare the analytical solution, as derived above in equation (5c), with simulation data produced using the Gillespie algo-rithm with tau-leaping approximations (Gillespie 1977,
2001) and a step size of Dt p 0.05. We chose this step size since it was accurate for larger population sizes; that is, the results did not significantly change with a smaller step size (see also Keeling and Rohani 2007), and it was not too expensive in terms of computational time. The step size was reduced to Dt p 0.01 if N p 100, as larger step sizes in small populations can overestimate the rate of change of each compartment (Keeling and Rohani 2007); simulations results were not strongly affected for N p 1,000 if Dt p 0.01 (see Mathematica, supplementary material S2). Simulation data was obtained based on 1,000,000 reintroductions of the first strain into a fully susceptible population (increased to 10,000,000 reintrod-uctions for N p 50,000 and Nm p 0.001). We looked at the case where the initial R0is low, ranging between 1 and
1.2, and can mutate into a more adapted strain with F0
equal to 1.2, 1.5, 1.8, or 2.5. For simplicity (unless stated otherwise), the removal rates for both strains (by this we mean the recovery rate) was set to 1, therefore the trans-mission rate was equal to the reproductive ratio. Since the long-term probability of extinction for both strains is 1 with SIR dynamics, we say that the second strain has “emerged” if it reaches its outbreak threshold, here set to 5/log(F0) infected hosts. This threshold means that it
sub-sequently has less than a 0.5% probability of becoming extinct by stochastic drift (Hartfield and Alizon 2013b). Note that the analytical solution (eq. [5c]) gives the emer-gence probability of a second strain given that the first strain has emerged. Therefore, we scale down our analyt-ical solution by 1 ⫺ 1/R0, the emergence probability of
the first strain in a fully susceptible population (Allen 2008), in order to account for the first strain emerging in the simulations. Simulations were written in C, and source code was deposited in the Dryad Digital Repository: http://dx.doi.org/10.5061/dryad.kj238 (Hartfield and Ali-zon 2013a).1
Comparison of Analytical Solutions with Simulation Data
Plots of the main comparisons are provided in figure 3 (and fig. S2, supplementary material S2). For N p 10,000 and N p 50,000, it is seen that the analytical solution generally provides an accurate solution of emergence prob-ability, although it slightly underestimates simulation re-sults when R0 1 1.1. This is because integration over all
extinction probabilities as the first strain spreads as well as the second strain emergence probability P both assume that these values change by a small amount per time step. This assumption is valid for R0 close to 1 but is slightly
1 Code that appears in the American Naturalist is provided as a convenience to the readers. It has not necessarily been tested as part of the peer review.
Mutation Creating a New Outbreak E111
Figure 2: Contour plot of the minimum susceptible population needed for the original strain to mutate into a faster-spreading strain.
Below this proportion, emergence of a new strain is impossible. The overall population size is N p 10,000. Contour labels indicate the minimum susceptible proportion. The red contour shows where the transition from where emergence is prevented due to the first strain becoming extinct (Smin, 1, above the red line), to where emergence is limited due to the first strain burning out the existing susceptible
population (Smin, 2, below the red line).
violated if larger due to the increased rate at which the first pathogen spreads and therefore by the increased pro-pensity to mutate into a fitter strain. For smaller host population sizes (N p 1,000), results are generally accurate but tend to consistently slightly underestimate simulation results. This is probably due to increased stochastic effects affecting the spread of both the original and second path-ogen due to the small population size. To account for these factors a fully stochastic analytical treatment should be implemented (Karlin and Taylor 1981), but this is complex for an SIR-type infection and appears to be intractable if considering more than one strain spreading (see Allen and Burgin 2000 for an example of how to formulate a fully stochastic model for a one-strain SIR epidemic). We also investigated the case where the transmission rates biwere
fixed at 1 and the recovery rates varied to define the re-productive rates. We observed that simulation results were generally the same for R0!1.1, where the original model
is most accurate (figs. S3, S4; supplementary material S2). It was also of interest to determine whether the solutions were accurate if the mutation rate m was large, as this might have violated the assumption that only a single new strain can appear at a given time. Figure 4 shows results for Nm p 10 with N p 10,000 and 50,000. As with smaller
m results, the analytical solution is accurate yet slightly underestimates simulation values for large R0values.
Sim-ilar results were obtained for Nm p 0.1 or 1 (fig. S5). However, the analytical solution consistently underesti-mates simulations for N p 1,000 (for Nm p 0.1 and 1), creating a large discrepancy in very small populations (N p 100; fig. S6). We interpret this result as arising due to stochastic forces (population drift) dominating over deterministic ones in driving the size of the infected pop-ulation, so both strains can reach high frequencies by chance. Additionally, the mutation rate is high enough so as to consistently introduce the second strain purely through mutation, which is not accounted for in the model formulation.
In general, the analytical solution appears to be accurate as long as the population size is not too small (N≤ 1,000) and the mutation rate is not extremely high. Considering that most outbreaks arise over large areas, where N is large, and point mutation estimates (for beneficial, neutral, and deleterious mutations) for viruses and bacteriophages sel-dom exceed 1 # 10⫺ 4(Sniegowski et al. 2000), then these assumptions should not be greatly violated when consid-ering real-world cases.
A
B
C
D
E
F
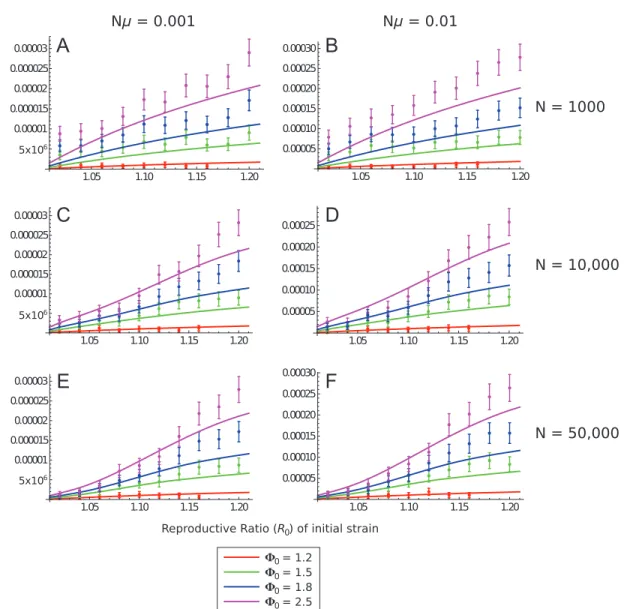
Figure 3: Plots of the analytical solution for emergence probability of second strain (eq. [5c]; solid lines) in comparison with simulation
data (points; error bars are 95% confidence intervals). The first strain mutates into a new strain with F0equal to 1.2 (red lines/points),
1.5 (green), 1.8 (blue), or 2.5 (purple). Population sizes are 1,000 (A, B), 10,000 (C, D) or 50,000 (E, F), with compound mutation rate
Nm equal to 0.001 (A, C, E) or 0.01 (B, D, F). Plots covering R0between 1 and 1.1 only are shown in figure S2, available online.
Application to a Two-Wave Outbreak of Chikungunya Virus, La Re´union Island
We will now apply our model to the two-wave outbreak of Chikungunya virus on La Re´union. Over 2005, the virus was present at a low frequency in the population of La Re´union Island, peaking at 500 reported cases and sta-bilized at 100 until the end of September. Afterward, a secondary wave emerged in December 2005, causing nearly a 100-fold increase in the number of cases, peaking at more than 45,000 (Renault et al. 2007). More than 90% of viruses in the secondary outbreak harbored two novel substitutions in the structural region (Schuffenecker et al.
2006). Viruses harboring these substitutions also replicated faster, compared to ancestral variants (Vazeille et al. 2007). Therefore, it is clear that the secondary outbreak was al-most surely caused by adaptive mutation increasing the replication rate of the pathogen. Here, we use our ana-lytical results to provide estimates of the emergence prob-ability of this pathogen and how it compares to models where emergence probabilities are not affected by deple-tion of susceptible individuals by the first strain. Specifi-cally, given that a first strain already appeared in the pop-ulation, was there a high probability that a second strain would appear over time, due to the large susceptible
pop-Mutation Creating a New Outbreak E113
A
B
Figure 4: Plots of the analytical solution for emergence probability
of second strain (eq. [5c]; solid lines) in comparison with simulation data (points; error bars are 95% confidence intervals). Color scheme is the same as in figure 3. Term Nm p 10, and N p 10,000 (A) or 50,000 (B). In this plot, error bars lie within individual points.
A
B
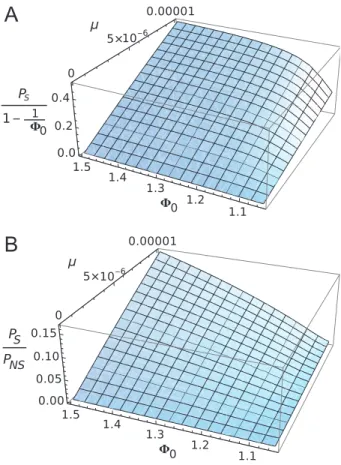
Figure 5: Three-dimensional plots of emergence probability of a
mutated strain of the Chikungunya virus in La Re´union. A, Results predicted by our model (PS), as scaled to the emergence probability
for a de novo strain. B, Results scaling our model to one that assumes that emergence of new pathogens are not affected by limitation of the susceptible population. Values are given as a function of the reproductive ratio of the mutated strain F0and the advantageous
mutation rate m. See “Application to a Two-Wave Outbreak of Chi-kungunya Virus, La Re´union Island” for the other parameters used.
ulation size? Alternatively, would susceptible depletion greatly restrict the emergence of secondary strains, making the appearance of mutated strains unlikely?
The population size of La Re´union is around 776,000 individuals (Renault et al. 2007). We assume that the sus-ceptible population size before infection would cover the whole island. This seems a reasonable assumption since infection did not seem to be located at any one location on La Re´union (Renault et al. 2007). It is also generally assumed that cross-immunity between Chikungunya strains is extremely strong, due to the onset of strong innate immunity (both with Chikungunya virus, and al-phaviruses in general; Wauquier et al. 2011; Volk et al. 2010), combined with the fact that Chikungunya virus strains are antigenically similar, which forms the basis of vaccine creation against it (Akahata et al. 2010; Wang et al. 2011). The estimated substitution rate for the virus was 8.8 # 10⫺4substitutions per site per year (Cherian et al. 2009). However, what is of interest for our model is the advantageous mutation rate. While the substitution rate is equal to the neutral mutation rate (Kimura 1983), the advantageous mutation rate is generally greatly lower than this, as advantageous mutations only make up a tiny pro-portion of all mutations (Eyre-Walker and Keightley 2007).
However, if we consider the per-genome mutation rate (as opposed to the per-site rate), then this would increase the adaptive mutation rate. Again, to be conservative, we in-vestigate m varying between 10⫺5 and 10⫺7. Finally, we estimated the reproductive ratios by comparing epidemic data from (Renault et al. 2007) with those produced from analytical results. It appears that a good fit for R0is 1.04,
while that for F0 is higher at approximately 1.4
(supple-mentary material S3). We therefore fix R0at 1.04 and vary
F0 between 1.05 and 1.5 to determine to what extent F0
affects emergence probability.
Figure 5A shows the probability of emergence according to our model, PS, scaled to that expected for a single
in-fected individual in a fully susceptible homogeneous pop-ulation (that is, 1⫺ 1/F0). We see that, unless the mutation
gen-erally lies between 0.2 and 0.4. Therefore, the need to mutate from a preexisting strain reduces the probability of emergence only by two- to fivefold, compared to the emergence of a single strain in a fully susceptible popu-lation. This is due to the fact that, even though the mu-tation rate is low, the susceptible population in La Re´union is assumed to be very large, creating multiple opportunities for the first strain to mutate into a faster-spreading strain. We can also determine how saturation of the susceptible population affected the emergence probability. Figure 5B compares PSto a model that assumes that susceptible
de-pletion does not affect the emergence probability of new strains (that is, the emergence probability of a single strain is 1⫺ 1/F0). The overall probability of emergence is
de-noted as PNS. We clearly see that the ongoing depletion of
the susceptible population greatly reduced the emergence probability of mutated strains in this epidemic, with a 10– 20-fold reduction in probability observed. Similar values are obtained if the pathogen emergence probability is set to the naive expectation using an “effective” reproductive rate that does not account for feedbacks, 1⫺ N/(SF0) in
PNS; that is, susceptible dilution affects pathogen
emer-gence when it first appears but not in subsequent gener-ations (result not shown). This result give a clear indication as to how susceptible depletion strongly affects the emer-gence of new mutated strains from preexisting ones. It could also explain why observing mutated strains arising in the field is uncommon, as the change in the underlying population size would impact their appearance.
However, we wish to stress that this is a basic analysis, based on broad-scale parameters used. These results are likely to be qualitatively robust because we used conser-vative estimates for the parameters. Nevertheless, in order to make it more accurate, we need a detailed knowledge of population structure, so as to determine the initial sus-ceptible population size, as well as improved knowledge of the beneficial mutation rate.
Discussion
The evolution of infectious diseases, especially causing spillovers from zoonotic reservoirs into human popula-tions, is a major health threat. Due to this hazard, there has been a substantial research focus on determining the likelihood of pathogens mutating into more virulent strains. However, most previous research has focused on cases where the initial pathogen is maladapted and is bound to become extinct rapidly unless it mutates. Here, we investigate a related but overlooked scenario, where a weakly emerging strain (with R0 ≈ 1) can mutate into a
faster-spreading strain before dying out, causing a second outbreak that has the potential to be maintained for a longer period of time. Studying emergence of pandemic
strains originating from intermediately adapted strains of-fers more applications for monitoring outbreaks than searching for strains originating from maladapted ones, because the initial strain is present in the population for a longer time. It also opens a new perspective for predicting the pandemic risk for pathogens that are known to be emerging (or re-emerging) but generate only localized out-breaks (e.g., with avian influenza or ebola).
We have derived an analytical formulation for the emer-gence probability of the second strain from the first, by tracking the population trajectory over time and calcu-lating the emergence probability at each time point (eq. [5c]). One of the most important insights from our der-ivation is that even though the first strain’s R0 is low
enough to ensure that, in general, a large susceptible pop-ulation remains for the second strain to spread through, the decreasing susceptible population would still act to reduce the emergence probability of the second strain. This finding reflects similar results on how a reduced popu-lation size reduces emergence probabilities in evolutionary genetics (Otto and Whitlock 1997) and evolutionary res-cue models (Martin et al. 2013).
By applying our model to a well-documented case of pathogen reemergence, that of the Chikungunya virus in La Re´union Island, we provide a stark example of how the ongoing depletion of the susceptible population has a strong negative effect on the emergence probability of the mutated virus strain. However, the overall emergence probability is only slightly lower than that for a single strain in a fully susceptible population. Overall, this ex-ample highlights that while susceptible depletion can strongly limit the emergence of mutated strains, the risk remains on the order of that expected for completely new strains emerging, meaning that there is still a nonnegligible risk of emergence. This model was based on broad-scale estimates of mutation rates, population sizes, and popu-lation structure, for which most of the finer details are unknown. Therefore, we hope that this model, as well as others, would encourage further investigations into adap-tive mechanisms and rates of pathogens, in order to aid the application of emergence models to understanding the risk of secondary outbreaks emerging through evolution of the pathogen.
Our model assumes that both pathogens are apparent in a large homogeneous population. However, most real populations of interest are heterogeneous, due to either the presence of subpopulations (Alexander and Day 2010; Kubiak et al. 2010) or differences in immune history or contact structure. Specifically, most outbreaks show the presence of “super-spreaders” that cause a greater amount of secondary infections than average (Galvani and May 2005). Super-spreaders have also been detected in vector-borne disease outbreaks (Woolhouse et al. 1997), which
Mutation Creating a New Outbreak E115 could also affect the dynamics of the Chikungunya
ex-ample, although the degree of heterogeneity with this out-break is unknown. The presence of host heterogeneity is known to decrease the emergence probability of new out-breaks, as an increased proportion of the population are unlikely to spread the initial pathogen and trigger a full outbreak (Lloyd-Smith et al. 2005b). However, Yates et al. (2006) concluded that the presence of super-spreaders only has a minute impact on emergence probabilities, if the initial strains have R0 !1. Therefore, implementing host
heterogeneity and spatial structure in addition to epide-miological feedbacks would be an important next step in increasing the realism of the model.
The application of our model to the Chikungunya out-break also poses the question as to how population feed-backs in pathogen vectors would affect the emergence probability. The likelihood of emergence could be further decreased if the preexisting pathogen confers immunity to a large fraction of the vector population, as with the host population studied here. Furthermore, immunity can be conferred on vectors by having their immune system “primed” by a weaker version of a pathogen (reviewed in Little and Kraaijeveld 2004). Alternatively, priming can arise due to the presence of a competing pathogen (e.g., with Wolbachia preventing infection in Aedes aegypti mos-quitos from a variety of infections; Moreira et al. 2009). Immunity can also be transgenerational in invertebrates due to this “immune priming,” of which there are several cataloged examples (Little et al. 2003; Sadd et al. 2005; Sadd and Schmid-Hempel 2007) that could maintain im-munity in a vector population, even if it has a high turn-over. However, this reduction may be offset by different replication rates in the vector; for example, the mutated strain of the Chikungunya virus had a greatly higher rep-lication rate in Aedes albopictus, compared to the ancestral strain (Vazeille et al. 2007). It is clear that this intriguing question requires further study using an extended model, in order to quantify the effect of differences between the host and vector populations.
Since it can be tricky to infer the effect of mutation and population feedbacks from real-world epidemic data, ex-perimental bacterial systems might be useful in testing the predictions of the model (as discussed in Dennehy 2009; Martin et al. 2013). For example, Benmayor et al. (2009) found that phages could evolve to infect novel host bacteria only if seeded at initial frequencies between 0.1% and 1%. It was argued that lack of adaptation occurred at higher initial frequencies due to increase costs of host switching and lack of mutation supply. However, our results also suggest that a decrease of susceptible individuals, caused by seeding the initial strain at too high a frequency, could also prevent new types from appearing. We therefore hope that our model would motivate further experimental work
on the relative impact of demographic effects and evo-lutionary effects on pathogen emergence.
In summary, we have produced a model for the prob-ability that a second, stronger outbreak can be caused from an initial weaker one, which is accurate if the population size N is large and R0 is close to 1. This study highlights
how to implement information about changing population sizes (specifically the susceptible population size) into an-alytical models to determine the probability of a new strain emerging, without relying solely on numerical simulations. By applying the model to a well-known example of disease reemergence, we have shown that these population feed-backs can drastically reduce the emergence of new, mu-tated strains arising from preexisting outbreaks. These findings therefore have implications in public health man-agement and also highlight how competition between new strains can prevent the subsequent emergence of new out-breaks once a preexisting epidemic has established itself.
Acknowledgments
We would like to thank D. Fontenille for advising us on the epidemiology of the Chikungunya outbreak on La Re´-union, L. Wahl for discussions on the mathematical anal-ysis, and two anonymous reviewers for helpful comments on the manuscript. M.H. is funded by an ATIP-Avenir grant from CNRS and Institut national de la sante´ et de la recherche me´dicale (INSERM) to S.A.; S.A. and M.H. acknowledge additional support from the CNRS and the Institut de Recherche pour le De´veloppement (IRD).
Literature Cited
Abramowitz, M., and I. Stegun. 1970. Handbook of mathematical functions. Dover, New York.
Akahata, W., Z.-Y. Yang, H. Andersen, S. Sun, H. A. Holdaway, W.-P. Kong, M. G. Lewis, et al. 2010. A virus-like particle vaccine for epidemic Chikungunya virus protects nonhuman primates against infection. Nature Medicine 16:334–338.
Alexander, H. K., and S. Bonhoeffer. 2012. Pre-existence and emer-gence of drug resistance in a generalized model of intra-host viral dynamics. Epidemics 4:187–202.
Alexander, H. K., and T. Day. 2010. Risk factors for the evolutionary emergence of pathogens. Journal of the Royal Society Interface 7: 1455–1474.
Allen, L. 2008. An introduction to stochastic epidemic models. Pages 81–130 in F. Brauer, P. van den Driessche, and J. Wu, eds. Math-ematical epidemiology. Lecture Notes in Mathematics. Vol. 1945. Springer, Berlin.
Allen, L. J. S., and A. M. Burgin. 2000. Comparison of deterministic and stochastic SIS and SIR models in discrete time. Mathematical Biosciences 163:1–33.
Anderson, R. M., and R. M. May. 1991. Infectious diseases of humans: dynamics and control. Oxford University Press, Oxford.
Andre´, J.-B., and T. Day. 2005. The effect of disease life history on the evolutionary emergence of novel pathogens. Proceedings of the Royal Society B: Biological Sciences 272:1949–1956. Andre´, J.-B., and M. E. Hochberg. 2005. Virulence evolution in
emerging infectious diseases. Evolution 59:1406–1412.
Antia, R., R. R. Regoes, J. C. Koella, and C. T. Bergstrom. 2003. The role of evolution in the emergence of infectious diseases. Nature 426:658–661.
Arinaminpathy, N., and A. R. McLean. 2009. Evolution and emer-gence of novel human infections. Proceedings of the Royal Society B: Biological Sciences 276:3937–3943.
Barton, N. H. 1994. The reduction in fixation probability caused by substitutions at linked loci. Genetics Research 64:199–208. ———. 2000. Genetic hitchhiking. Philosophical Transactions of the
Royal Society B: Biological Sciences 355:1553–1562.
Benmayor, R., D. J. Hodgson, G. G. Perron, and A. Buckling. 2009. Host mixing and disease emergence. Current Biology 19:764–767. Cherian, S. S., A. M. Walimbe, S. M. Jadhav, S. S. Gandhe, S. L. Hundekar, A. C. Mishra, and V. A. Arankalle. 2009. Evolutionary rates and timescale comparison of Chikungunya viruses inferred from the whole genome/E1 gene with special reference to the 2005– 07 outbreak in the Indian subcontinent. Infection, Genetics and Evolution 9:16–23.
de Lamballerie, X., E. Leroy, R. Charrel, K. Ttsetsarkin, S. Higgs, and E. Gould. 2008. Chikungunya virus adapts to tiger mosquito via evolutionary convergence: a sign of things to come? Virology Jour-nal 5:33.
Dennehy, J. J. 2009. Bacteriophages as model organisms for virus emergence research. Trends in Microbiology 17:450–457. Diekmann, O., and J. Heesterbeek. 2000. Mathematical epidemiology
of infectious diseases: model building, analysis and interpretation. Wiley, Chichester.
Eyre-Walker, A., and P. D. Keightley. 2007. The distribution of fitness effects of new mutations. Nature Reviews Genetics 8:610–618. Fargette, D., G. Konate´, C. Fauquet, E. Muller, M. Peterschmitt, and
J. M. Thresh. 2006. Molecular ecology and emergence of tropical plant viruses. Annual Review of Phytopathology 44:235–260. Ferguson, N. M., A. P. Galvani, and R. M. Bush. 2003. Ecological
and immunological determinants of influenza evolution. Nature 422:428–433.
Frost, W. H. 1919. The epidemiology of influenza. Public Health Reports (1896–1970) 34:1823–1836.
Galvani, A. P., and R. M. May. 2005. Epidemiology: dimensions of superspreading. Nature 438:293–295.
Gandon, S., and T. Day. 2008. Evidences of parasite evolution after vaccination. Vaccine 26(suppl. 3):C4–C7.
Gandon, S., M. E. Hochberg, R. D. Holt, and T. Day. 2013. What limits the evolutionary emergence of pathogens? Philosophical Transactions of the Royal Society B: Biological Sciences 368: 20120086.
Gillespie, D. T. 1977. Exact stochastic simulation of coupled chemical reactions. Journal of Physical Chemistry 81:2340–2361.
———. 2001. Approximate accelerated stochastic simulation of chemically reacting systems. Journal of Physical Chemistry 115: 1716–1733.
Gonzalez, A., O. Ronce, R. Ferriere, and M. E. Hochberg. 2013. Evolutionary rescue: an emerging focus at the intersection between ecology and evolution. Philosophical Transactions of the Royal Society B: Biological Sciences 368:20120404.
Hansen, E., and T. Day. 2011. Optimal antiviral treatment strategies
and the effects of resistance. Proceedings of the Royal Society B: Biological Sciences 278:1082–1089.
Hartfield, M., and S. Alizon. 2013a. Data from: Epidemiological feed-backs affect evolutionary emergence of pathogens. Amercan Nat-uralist, Dryad Digital Repository, http://dx.doi.org/10.5061 /dryad.kj238.
———. 2013b. Introducing the outbreak threshold in epidemiology. PLoS Pathogens 9:e1003277.
Hartfield, M., and S. P. Otto. 2011. Recombination and hitchhiking of deleterious alleles. Evolution 65:2421–2434.
Iwasa, Y., F. Michor, and M. A. Nowak. 2003. Evolutionary dynamics of escape from biomedical intervention. Proceedings of the Royal Society B: Biological Sciences 270:2573–2578.
———. 2004. Evolutionary dynamics of invasion and escape. Journal of Theoretical Biology 226:205–214.
Karlin, S., and H. M. Taylor. 1981. A second course in stochastic processes. Academic Press, New York.
Keeling, M. J., and P. Rohani. 2007. Modeling infectious diseases in humans and animals. Princeton University Press, Princeton, NJ. Kimura, M. 1983. The neutral theory of molecular evolution.
Cam-bridge University Press, CamCam-bridge.
Kubiak, R. J., N. Arinaminpathy, and A. R. McLean. 2010. Insights into the evolution and emergence of a novel infectious disease. PLoS Computational Biology 6:e1000947.
Little, T. J., and A. R. Kraaijeveld. 2004. Ecological and evolutionary implications of immunological priming in invertebrates. Trends in Ecology and Evolution 19:58–60.
Little, T. J., B. O’Connor, N. Colegrave, K. Watt, and A. F. Read. 2003. Maternal transfer of strain-specific immunity in an inver-tebrate. Current Biology 13:489–492.
Lloyd-Smith, J. O., P. C. Cross, C. J. Briggs, M. Daugherty, W. M. Getz, J. Latto, M. S. Sanchez, A. B. Smith, and A. Swei. 2005a. Should we expect population thresholds for wildlife disease? Trends in Ecology and Evolution 20:511–519.
Lloyd-Smith, J. O., S. J. Schreiber, P. E. Kopp, and W. M. Getz. 2005b. Superspreading and the effect of individual variation on disease emergence. Nature 438:355–359.
Lourenc¸o, J., and M. Recker. 2010. Viral and epidemiological deter-minants of the invasion dynamics of novel dengue genotypes. PLoS Neglected Tropical Diseases 4:e894.
Martin, G., R. Aguile´e, J. Ramsayer, O. Kaltz, and O. Ronce. 2013. The probability of evolutionary rescue: towards a quantitative comparison between theory and evolution experiments. Philo-sophical Transactions of the Royal Society B: Biological Sciences 368:20120088.
Maynard Smith, J., and J. Haigh. 1974. The hitch-hiking effect of a favourable gene. Genetics Research 23:23–35.
McCallum, H., N. Barlow, and J. Hone. 2001. How should pathogen transmission be modelled? Trends in Ecology and Evolution 16: 295–300.
Me´thot, P.-O., and S. Alizon. 2014. Emerging diseases and the evo-lution of virulence: the case of the Spanish influenza pandemic.
In G. Lambert, P. Huneman, and M. Silberstein, eds. Disease,
classification, and evidence. New Essays in the Philosophy of Med-icine. Springer (forthcoming).
Moreira, L. A., I. Iturbe-Ormaetxe, J. A. Jeffery, G. Lu, A. T. Pyke, L. M. Hedges, B. C. Rocha, et al. 2009. A Wolbachia symbiont in
Aedes aegypti limits infection with dengue, chikungunya, and Plas-modium. Cell 139:1268–1278.
Mutation Creating a New Outbreak E117
Otto, S. P., and N. H. Barton. 1997. The evolution of recombination: removing the limits to natural selection. Genetics 147:879–906. Otto, S. P., and M. C. Whitlock. 1997. The probability of fixation in
populations of changing size. Genetics 146:723–733.
Pe´rez-Reche, F. J., F. M. Neri, S. N. Taraskin, and C. A. Gilligan. 2012. Prediction of invasion from the early stage of an epidemic. Journal of the Royal Society Interface 9:2085–2096.
Renault, P., J.-L. Solet, D. Sissoko, E. Balleydier, S. Larrieu, L. Filleul, C. Lassalle, et al. 2007. A major epidemic of Chikungunya virus infection on Re´union Island, France, 2005–2006. American Journal of Tropical Medicine and Hygiene 77:727–731.
Sadd, B. M., Y. Kleinlogel, R. Hempel, and P. Schmid-Hempel. 2005. Trans-generational immune priming in a social insect. Biology Letters 1:386–388.
Sadd, B. M., and P. Schmid-Hempel. 2007. Facultative but persistent trans-generational immunity via the mother’s eggs in bumblebees. Current Biology 17:R1046–R1047.
Schuffenecker, I., I. Iteman, A. Michault, S. Murri, L. Frangeul, M.-C. Vaney, R. Lavenir, et al. 2006. Genome microevolution of Chi-kungunya viruses causing the Indian Ocean outbreak. PLoS Med-icine 3:e263 EP.
Sniegowski, P. D., P. J. Gerrish, T. Johnson, and A. Shaver. 2000. The evolution of mutation rates: separating causes from consequences. BioEssays 22:1057–1066.
Vazeille, M., S. Moutailler, D. Coudrier, C. Rousseaux, H. Khun, M. Huerre, J. Thiria, et al. 2007. Two Chikungunya isolates from the outbreak of La Reunion (Indian Ocean) exhibit different patterns of infection in the mosquito, Aedes albopictus. PLoS ONE 2:e1168. Volk, S. M., R. Chen, K. A. Tsetsarkin, A. P. Adams, T. I. Garcia, A.
A. Sall, F. Nasar, et al. 2010. Genome-scale phylogenetic analyses of Chikungunya virus reveal independent emergences of recent epidemics and various evolutionary rates. Journal of Virology 84: 6497–6504.
Wang, D., A. Suhrbier, A. Penn-Nicholson, J. Woraratanadharm, J. Gardner, M. Luo, T. T. Le, et al. 2011. A complex adenovirus vaccine against Chikungunya virus provides complete protection against viraemia and arthritis. Vaccine 29:2803–2809.
Wauquier, N., P. Becquart, D. Nkoghe, C. Padilla, A. Ndjoyi-Mbi-guino, and E. M. Leroy. 2011. The acute phase of Chikungunya virus infection in humans is associated with strong innate im-munity and T CD8 cell activation. Journal of Infectious Diseases 204:115–123.
Wolfe, N. D., C. P. Dunavan, and J. Diamond. 2007. Origins of major human infectious diseases. Nature 447:279–283.
Woolhouse, M., F. Scott, Z. Hudson, R. Howey, and M. Chase-Top-ping. 2012. Human viruses: discovery and emergence. Philosoph-ical Transactions of the Royal Society B: BiologPhilosoph-ical Sciences 367: 2864–2871.
Woolhouse, M. E. J., C. Dye, J.-F. Etard, T. Smith, J. D. Charlwood, G. P. Garnett, P. Hagan, et al. 1997. Heterogeneities in the trans-mission of infectious agents: implications for the design of control programs. Proceedings of the National Academy of Sciences of the USA 94:338–342.
Yates, A., R. Antia, and R. R. Regoes. 2006. How do pathogen evo-lution and host heterogeneity interact in disease emergence? Pro-ceedings of the Royal Society B: Biological Sciences 273:3075–3083.
Associate Editor: Locke Rowe Editor: Judith L. Bronstein