Adoption of Healthcare Information Technology and the
Clinician Behavior
byAdam Weinstein
B.A., Computer Science Brandeis University, 2001
Masters of Business Administration MIT Sloan School of Management, 2008
Impact on
OF TECHNOLOGY
SEP 17
2009
LIBRARIES
Submitted to the Harvard-MIT Division of Health Sciences and Technology in Partial Fulfillment of the Requirements for the Degree of
MASTER OF SCIENCE in HEALTH SCIENCES AND TECHNOLOGY AT THE
MASSACHUSETTS INSTITUTE OF TECHNOLOGY
June 2009
C Massachusetts Institute of Technology All rights reserved
ARCHIVES
Signature of Author ...
Biomedical Enterprise Program Harvard-MIT Division of Health Sciences and Technology
Certified by...
Teo Forcht Dagi, MD, MPH, MBA Senior Lecturer Harvard-MJ Divisio f Health Sciences and Technology
/
6/ Thesis Co-SupervisorCertified by...
John Halamka, MD, MS Chief Information Officer, 4-arvard Medical School and Beth Israel Deaconess Medical Center
- Thesis Co-Supervisor
Accepted by ... ...
Ram Sasisekharan, Ph.D. Edward Hood Taplin Professor of Health Sciences & Technology and Biological Engineering Director, Harvard-MIT Division of Health Sciences and Technology
Adoption of Healthcare Information Technology and the Impact on
Clinician Behavior
by
Adam Weinstein
Submitted to the Harvard-MIT Division of Health Sciences and Technology on May 15, 2009 in Partial Fulfillment of the Requirements for the
Degree of Master of Science in Health Sciences and Technology
Abstract
It is widely believed that healthcare information technology (health IT) can improve care and lower costs. However, the pattern and uptake of beneficial features of health IT is poorly understood, and is an important part of realizing the full benefits of health IT. This thesis examines the factors relating to adoption and use of reporting features within an outpatient practice management system. A retrospective observational study was performed utilizing web log data from a practice management and electronic health record system vendor. Two years of data were analyzed on the use of features within the system in two different scenarios: the use of a newly released custom reporting feature among existing clients, and the use of a physician-level monthly report among new clients.
Among these two different populations and features, the first use and subsequent utilization exhibited similar patterns. Using the Bass model of technology diffusion to quantify the adoption of these features, it was found that adoption had a low social component (coefficient of
imitation) and a high personal component (coefficient of innovation). One physician's use of a feature in his practice did not appear to influence whether a new physician joining the same practice would use the feature. In addition, the earliest users of a feature tended to utilize that
feature more often. Practices and providers that used these features performed better across three of four operational and financial metrics.
The purchase and installation of a health IT system by an organization does not ensure that individuals within it will fully utilize the system and realize all the benefits. Incentives for health IT should focus on the advantages gained from these systems, and not merely on their purchase. Health IT vendors should be cognizant of the way they introduce new functionality to their clients in order to ensure maximal use.
Thesis Co-Supervisor: Teo Forcht Dagi, MD, MPH, MBA
Title: Senior Lecturer, Harvard-MIT Division of Health Sciences and Technology
Thesis Co-Supervisor: John Halamka, MD, MS
Title: Chief Information Officer, Harvard Medical School and Beth Israel Deaconess Medical Center
To my parents, Mark and Lucy, for their love and support throughout my life and career. To my wife, Kate, for her endless love and encouragement.
--Acknowledgements
The author would like to thank his thesis supervisors, Teo Dagi and John Halamka. Their
generosity with their time and intellectual guidance was critical throughout the process of writing this thesis.
I have been fortunate to study under a brilliant group of professors during my time in the Biomedical Enterprise Program. In particular, I would like to acknowledge Ernie Berndt, Peter Szolovits, and my academic advisor, Martha Gray, for their feedback as I explored and refined my thesis topic.
This study would not have been possible without the support of many individuals at
athenaHealth. In particular, I would like to thank Diane Kaye, Geoff Maletta, Jack Nye and Katie Vahle. Their input proved invaluable throughout the research and writing of this study.
I would like to express my appreciation to my wife, Kate Weinstein. I cannot thank you enough for your love and support over the last three years. You have been an editor, contributor and friend throughout, and I owe everything to you.
Last, but not least, I would like to thank Zoe. Your endless energy and enthusiasm for life inspires us all.
Table of Contents
Abstract ... ...
Acknow ledgem ents ... ... 4
Table of Figures ... ... 7
Statem ent of Purpose and Goals ... ... Introduction and Background ... 10
Significance of Health IT Adoption ... 10
Reporting in Health IT... 11
Benefits of Health IT ... ... 11
Current State of Health IT ... ... 12
Effective U se and Benefits of Health IT ... . ... 13
Technology D iffusion M odel...13
Factors in Adoption of Health IT ... . 14
Background on athenaHealth ... 15
M ethodology... 16
Study Dataset ... 16
Identification of Features ... 16
U sage D ataset...16
D em ographic and Perform ance Dataset ... ... 17
Data Classification ... 17
Study Population ... 18
Practices Included ... 18
Statistical Analysis ... 19
Results ... 21
Provider Exploration and Use of the Clinician Performance Review ... 21
Exploration of the CPR by N ew Practices ... ... 21
Exploration of the CPR by N ew Providers ... ... 22
Factors Associated w ith Exploration...23
Utilization of the CPR ... ... 25
U se of the CPR and Perform ance ... ... 26
Practice Exploration and Use of Report Builder... 32
Exploration of Report Builder... 33
Factors Associated w ith Exploration... ... 34
Utilization of Report Builder ... ... 35
Relationship to Perform ance ... ... 38
D iscussion ... ... 41
Sim ilarity in Adoption Patterns...41
Variation in Adoption Patterns ... ... ... 43
Adoption Levels Achieved ... ... 44
Factors Relating to U se... ... 44
Factors Relating to Performance ... 45
Applicability to Health IT ... ... 45
Implications for Policy ... ... 46
Implications for Health IT Vendors ... 46
Recomm endations for Further Research ... . ... 47
Study Lim itations ... 47
Bibliography ... ... 49
6
Table of Figures
Table 1. Provider Specialty Classification ... ... ... 18
Table 2. Provider Type Classification... ... 18
Table 3. Provider Population Characteristics ... 19
Table 4. Diffusion Coefficient Estimates ... 23
Table 5. Factors Associated with CPR Exploration...24
Table 6. New Provider Prior Utilization Percentage...25
Table 7. Factors Relating to CPR Utilization ... 25
Table 8. Provider Characteristic in CPR Performance Evaluation ... 27
Table 9. Variables Associated with Hold Lag in New Practices ... 30
Table 10. Factors Associated with DAR in New Practices ... 31
Table 11. Factors Associated with Denial Rate in New Practices ... 31
Table 12. Factors Associated with Work RVU in New Practices ... 32
Table 13. Factors Associated with Practice Exploration of Report Builder ... 34
Table 14. Factors Associated with Early Exploration of Report Builder... 35
Table 15. Factors Related To Heavy Report Builder Utilization ... 36
Table 16. Performance Rank Prior to Utilization ... ... 38
Table 17. Factors Associated with Hold Lag in Existing Practices ... 38
Table 18. Factors Associated with DAR in Existing Practices ... 39
Table 19. Factors Associated with Denial Rate in Existing Practices ... 39
Table 20. Factors Associated with Work RVU in Existing Practices ... 40
Table 21. Report Builder Use and Change in Performance ... ... 40
Figure 1. Cumulative Adoption S-Curve ... 14
Figure 2. Cumulative CPR Exploration Curve by All Providers... .... 22
Figure 3. Cumulative CPR Exploration by New Providers... ... 23
Figure 4. Days to First Use by Quartile of Utilization...26
Figure 5. Average Hold Lag by CPR Utilization... ... 28
Figure 6. Average Work RVUs per Month by CPR Utilization... ... 29
Figure 7. Days in Accounts Receivable by CPR Utilization ... .... 29
Figure 8. Denial Rate per Appointment by CPR Utilization...30
Figure 9. Report Builder Cumulative Exploration Percentage ... 34
Figure 10. Report Builder Monthly Utilization after First Use ... .... 37
Figure 11. Report Builder Utilization and Days to First Use ... ... 37
Figure 12. Exploration Growth Rate in Various Scenarios ... ... 43 L.
Statement of Purpose and Goals
Healthcare information technology (health IT) has been well studied in medical literature, yet these studies have produced a variety of conflicting answers and even more questions. There is a general consensus that health IT can produce cost savings and improve the quality of care, yet for any given technology there exist studies that show a negative impact. In addition, there are varying estimates of the level of adoption of health IT systems in the United States, depending on how "adoption" and the system being studied are defined.
Knowledge of health IT in an outpatient context is particularly lacking. Despite the fact that most physicians work in small ambulatory practices and deliver the majority of care, outpatient clinics have been particularly slow to adopt health IT. Due to this slow adoption and the de-centralized nature of this population, there are particular challenges in studying health IT in this group.
Despite these challenges, a growing number of people are looking to health IT to help save the U.S. healthcare system. This increased attention to health IT was underscored recently by the $19 billion invested in health IT by the Obama administration to encourage adoption of electronic health records (EHR) systems among inpatient and outpatient physicians. This increased installed base of EHRs, and of health IT generally, creates significant opportunity to capture the savings and improvements hinted at in the literature. However, it is only the first step. It is the effective use of the capabilities that these systems provide today and in the future that will lead to value being realized, not merely the installation of these systems. This fact is not being ignored by those who are guiding health policy. In a recent article in the New England Journal of Medicine, Dr. Blumenthal, the National Coordinator for Health Information
Technology, stated, "...if EHRs are to catalyze quality improvement and cost control, physicians and hospitals will have to use them effectively."
This study looks at a population of outpatient medical providers over a two year period of time and across different health IT components. It attempts to explore adoption and effective use in greater detail in order to answer the following questions:
* Is there a consistent pattern of health IT adoption across functionality? * Are there factors that correlate with adoption of health IT?
* Is the effective use of health IT associated with cost savings or operational improvements?
* What can companies and regulators do to maximize health IT adoption so that the full range of benefits can be realized?
Introduction and Background
This study explores the dynamics of healthcare information technology adoption, with a
particular focus on the implications for Electronic Health Records. The dynamics that come into play in an organization after a health IT system has been installed are critically important to realizing its benefits, yet are poorly understood. This pilot study is intended to show how the purchase and installation of a health IT system - the typical measures of health IT adoption
-relate to the full utilization of the system.
The answer to this question has implications in a number of areas. Most directly, researchers in health IT adoption can use this pilot study to understand the dynamics of health IT adoption at a more fundamental level. However, the implications extend to physicians' practices, EHR
companies and policy makers. Organizational factors can play a significant role in determining the success of IT, and practices that are unable to realize improvements will lose increasing amounts of revenue from pay-for-performance and government reporting initiatives. EHR vendors whose clients do not realize the full value of their investment will be at a competitive disadvantage in an increasingly competitive market. Finally, if policy makers hope to realize the cost savings that are possible from health IT adoption, they must understand the dynamics at play and create the appropriate incentives.
Significance of Health IT Adoption
Health IT adoption has become a significant issue due to the large amount of attention and investment in this area. With the recent American Recovery and Reinvestment Act (ARRA), the government is investing $19 billion to encourage the adoption of health IT, and $17 billion of that will be used for direct payments to doctors and hospitals for EHR adoption2. These
incentives are intended to help achieve President Obama's goal of complete computerization of medical records by 20143. Through this adoption, the Congressional Budget Office estimates that savings of $34 billion over 10 years could be realized through a reduction in medical errors and decreased healthcare utilization4.
This investment also has significant implications for the EHR marketplace. The U.S. EHR market is currently estimated at around $1.2 billion dollars in terms of yearly revenue5' 6 Therefore, the sizeable government investment in this area could effectively double the size of this industry in a five year period.
Reporting in Health IT
The ARRA recognizes the importance of effective utilization by specifying that providers must demonstrate "meaningful use of health information technology", and gives the following three general criteria for this: 1. Quality metric reporting; 2. Connection to exchange data; 3. Certified systems7. While these guidelines have yet to be defined specifically as of this writing, it is generally believed that quality reporting will involve the submission of quality and outcomes metrics.
Reporting is becoming an increasingly important part of health care, and this trend was
underway before the quality reporting provision of the ARRA was announced. For example, the Health Plan Employer Data and Information Set (HEDIS) was initially developed in 1991, and comprised numerous process and quality measures. More recently, the Physician Quality
Reporting Initiative (PQRI) was established legislatively in 2007, and offers incentive payments as part of Medicare reimbursement for quality reporting8. In addition, non-government pay-for-performance programs are making up an increasing share of healthcare payment programs .
Benefits of Health IT
Information technology (IT) investment has led to improvements in many industries across a number of dimensions, so it is not unreasonable to expect similar benefits in healthcare. IT investment has been found to improve productivity and lower costs in multiple industries, and two-thirds of the labor productivity improvement from 1990-2000 has been attributed to IT10,11, 12
In healthcare, it is believed that a number of benefits will accrue from increased IT adoption, but the evidence has shown mixed results3',14. A review of randomized controlled trials by Bales et. al (1996) involving a variety of clinical information systems found that certain features were associated with operational improvements15. A more recent review of the medical literature on
the impact of healthcare IT by Chaudry et. al (2006) had more mixed results1 6. This study looked
at EHR and decision support systems, and found that there was quality improvement due to better guideline adherence and decreased medical errors. The study also found that there were some efficiency gains due to decreased utilization of care. However, the impact on operational efficiency was mixed. A limitation of this study was that a significant proportion (25%) of underlying studies took place at four institutions with internally developed systems, whereas most outpatient physicians will acquire commercially developed systems.
This year, a study by Amarasingham et. al (2009), studying a set of hospitals in Texas, found that a higher level of use of clinical information systems was associated with lower mortality rates and a lower cost per admission for the population of patients older than 50 years of age'7 Another recent study on the Kaiser Permanente HealthConnect program, which provided an EHR across multiple care settings as well as secure patient-provider and intra-provider messaging, showed a 26% decrease in office visits1 8.
Increased spending on health IT has been shown to be associated with increased financial returns in certain situations. A firm level analysis of integrated health delivery systems by Thouin et al. (2008) found that an increase in IT spending and IT outsourcing were associated with increased firm profitability 9
Current State of Health IT
Information technology is being used more and more in healthcare, and incentives from payers are an important part of this growth, going beyond those for EHRs in the ARRA. For example, in January 2009 Medicare began providing an incentive to doctors for e-prescribing, and now approximately 70,000 physicians utilize this technology, representing 12% of all office-based physicians20
Despite gains in certain areas, the U.S. continues to lag behind the rest of the world. A study by the Commonwealth Fund in 2008 found that the Netherlands, New Zealand, the United Kingdom and Austria have all achieved greater than 75% use of EHRs, which is significantly higher than
the level of use in the U.S21. Support from the U.S. government has also lagged other OECD
countries by as much as a decade22
The true level of U.S. adoption of health IT and EHRs in particular has been difficult to gauge. Burt and Sisk (2005), examining data from 2001-2003 based on the National Ambulatory Medicare Care Survey (NAMCS) of office-based physicians, found that an average of 18% of physicians used an EHR23. By 2008, a survey by the National Center for Health Statistics found
that 38% of physicians were using an EHR, although only 4% of those systems were considered fully functional24.
Effective Use and Benefits of Health IT
The value of health IT is realized not just from the installation of new technology, but with the widespread use and adoption of that technology. Research has shown that installation alone is not good enough to impact healthcare; individual factors within the organization can lead to wide variations in the gains from technology25. Research has also shown that the biggest gains come not only from adoption of the technology, but in changes in behavior that best take advantage of this technolog 26. In healthcare, effective use has been shown to be significant in realizing the benefits of EHRs27
Davidson and Heineke (2007) describe five steps to realizing the full benefits of health IT28: 1. Availability of effective health IT systems
2. Installation of the system 3. Use of the system
4. Modification of work processes
5. Measurement of the effect on quality, efficiency and cost. Technology Diffusion Model
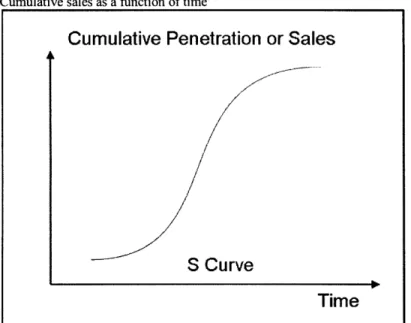
The theoretical basis for the diffusion of new technologies was described in detail by Everett Rogers in Diffusion of Innovations in 196229. He described how an intersection of social forces
leads to the probability of adoption. Cumulative adoption, when plotted over time, results in the now-familiar S-Curve:
Figure 1. Cumulative Adoption S-Curve
Cumulative sales as a function of time30
Cumulative Penetration or Sales
S Curve
Time
In 1967, Frank Bass published A New Product Growth for Model Consumer Durables,
describing formulas that could be used to model the growth in sales of new products based on the theories of Rogers. The Bass model has been utilized in healthcare to look at the adoption of durable goods, such as CT and MRI machines31. It has also been applied in health IT to predict the adoption of electronic health records by outpatient physicians, and develop recommendation for Informatics Nurse Specialist training32 33
Factors in Adoption of Health IT
Technology diffusion literature suggests that individual, technological and organizational characteristics influence the adoption and use of new technologies. Romano (1995) found that a combination of technological and organizational factors explained 52% of the variation in adoption ofa computerized staffing system34. A 2005 study of outpatient practices in
Massachusetts looked at organizational attributes associated with EHR adoption35. It found that larger practice size, hospital-based practices and practices that teach medical students were more likely to have an EHR. Another study, examining physician adoption of an ambulatory
prescription expert system, found that 72% of physicians had significant use (> 50% of prescription) after 6 months36. Burt and Sisk (2005) found that larger practices and certain
specialties were more likely to have installed an EHR system23. Other factors, such as the physician's age and the payer mix were not found to correlate significantly.
Fischer, et. al. (2008) studied Massachusetts physicians' utilization of an e-prescribing tool3 7 This system was provided free of charge, and the population studied was mostly community physicians. They found that younger clinicians, pediatric practices and larger practices were
associated with greater utilization of the system.
Background on athenaHealth
All data used in this study were provided by athenaHealth, Inc. athenaHealth is a Massachusetts-based provider of web-Massachusetts-based practice management and EHR services and software. As of 2008,
athenaHealth provided services to over 18,785 medical providers in 1,226 practices across 39 states38
athenaHealth releases new versions of its software at regular intervals, multiple times a year. Due to the nature of its software, all practices receive the new versions simultaneously. Each new version contains new functionality and feature changes. This regular and uniform update process combined with the rich data source due to the web-based software model created an ideal
opportunity to observe how practices and medical providers adopted new features.
Methodology
Study Dataset
Identification of Features
Through discussions with athenaHealth, a set of features to be included in this study was identified. The criteria for inclusion were as follows:
* Available to a significant portion of the client base: the feature in question had to be available to a large enough population of individuals to produce statistically significant results.
* Provided at no additional cost: I aimed to remove cost as a factor of adoption. * Optional to use: the client had to make a conscious effort to utilize the feature.
* The feature must provide actionable information: the feature had to provide information significant enough to the medical provider or practice such that it might initiate a change in operating or care procedures.
Through these discussions, the following features were identified:
* Report Builder - the report builder feature allows the client to create custom reports based on practice data on an ad-hoc basis.
* Clinician Performance Review (CPR) - the CPR is a monthly report that contains financial, administrative and operational metrics pertaining to an individual physician39
It is produced automatically for each medical provider in a practice three months after the practice "goes live" with athenaHealth (meaning that athenaHealth's software is installed at the client site, and they are ready to utilize the system).
Usage Dataset
For the features described above, athenaHealth provided a usage dataset. This dataset consisted of web log data for athenaHealth products covering the period January 1, 2007 to March 1, 2009. Since athenaHealth provides its software through a standard web browser via an internet
connection, this dataset was sufficient to identify the utilization of the system. This dataset contained information on who accessed the feature, when it was accessed, and to what practice
and department the user was logged in when the feature was accessed. The dataset excluded entries originating from athenaHealth employees and was limited to the features included in the study.
Demographic and Performance Dataset
In addition to web log information, athenaHealth provided de-identified information on the practices and medical providers using their services, including medical specialty, length of time as a client, geographic region of practice, and provider type. In addition, the following
performance metrics were also available for each provider on a monthly basis:
* Days in Accounts Receivable (DAR) - measures how quickly claims were paid starting with the date that service was provided40
* Work RVUs per Month - measures the amount and complexity of work performed by the clinician. Work RVUs are not affected by insurance contracts, regional differences or unpaid claims.
* Denial Rate per Appointment - measures the number of denied claims given the number of patients seen by the provider.
* Hold Lag - measures the amount of time it took for the practice to resolve billing errors41
Collectively, these measures were used to assess the financial and operational performance of the providers and practices included in this study. One caveat to these metrics is that factors outside of a practice's control can influence their performance. DAR can be affected by how quickly the insurer processes claims. Denial rate can be affected by athenaHealth's performance in catching errors early on in the claim submission process as well as by insurers' rules. For the purposes of this study, I assumed that these factors affected each practice equally and on a uniform basis.
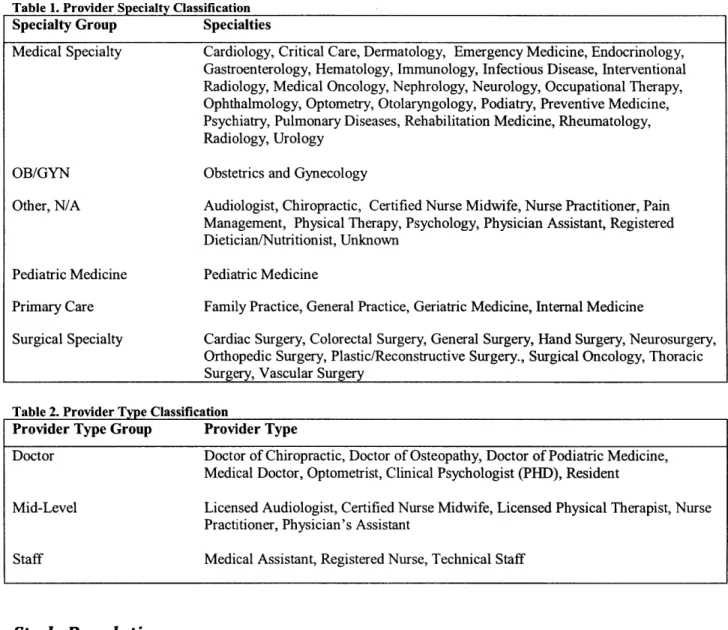
Data Classification
For the purposes of statistical analysis, certain data elements were categorized using standard classifications while ensuring a large enough population to achieve statistical significance. Table
1 and Table 2 show the categorizations performed.
Table 1. Provider Specialty Classification
Specialty Group Specialties
Medical Specialty OB/GYN Other, N/A Pediatric Medicine Primary Care Surgical Specialty
Cardiology, Critical Care, Dermatology, Emergency Medicine, Endocrinology, Gastroenterology, Hematology, Immunology, Infectious Disease, Interventional Radiology, Medical Oncology, Nephrology, Neurology, Occupational Therapy, Ophthalmology, Optometry, Otolaryngology, Podiatry, Preventive Medicine, Psychiatry, Pulmonary Diseases, Rehabilitation Medicine, Rheumatology, Radiology, Urology
Obstetrics and Gynecology
Audiologist, Chiropractic, Certified Nurse Midwife, Nurse Practitioner, Pain Management, Physical Therapy, Psychology, Physician Assistant, Registered Dietician/Nutritionist, Unknown
Pediatric Medicine
Family Practice, General Practice, Geriatric Medicine, Internal Medicine
Cardiac Surgery, Colorectal Surgery, General Surgery, Hand Surgery, Neurosurgery, Orthopedic Surgery, Plastic/Reconstructive Surgery., Surgical Oncology, Thoracic
Surgery, Vascular Surgery
Table 2. Provider Type Classification
Provider Type Group Provider Type
Doctor Doctor of Chiropractic, Doctor of Osteopathy, Doctor of Podiatric Medicine,
Medical Doctor, Optometrist, Clinical Psychologist (PHD), Resident
Mid-Level Licensed Audiologist, Certified Nurse Midwife, Licensed Physical Therapist, Nurse Practitioner, Physician's Assistant
Staff Medical Assistant, Registered Nurse, Technical Staff
Study Population
This study involved two different populations in order to understand adoption and use in two different scenarios (see Table 3 for all population characteristics). In the first scenario, I observed the way a new feature (Report Builder) was adopted by existing clients; in the second, I observed how new clients adopted existing functionality (CPR report).
Practices Included
To be included, a practice had to be a current client and not have given an indication that they would be terminating their contract with athenaHealth. The reason for this second requirement was that practices that have given notice that they are terminating their contract begin to utilize other systems, which then distorts the data collected by athenaHealth. "New practices" were
defined as practices that went live with athenaHealth software on or after January 1 st, 2007 and before October st, 2008. This ensured that there were data for the entire time the practice was in the study, and that there would be a minimum of six months of data. "Existing practices" were defined as practices that were athenaHealth clients as of January 1 st, 2007, and were still clients as of March 1st, 2009.
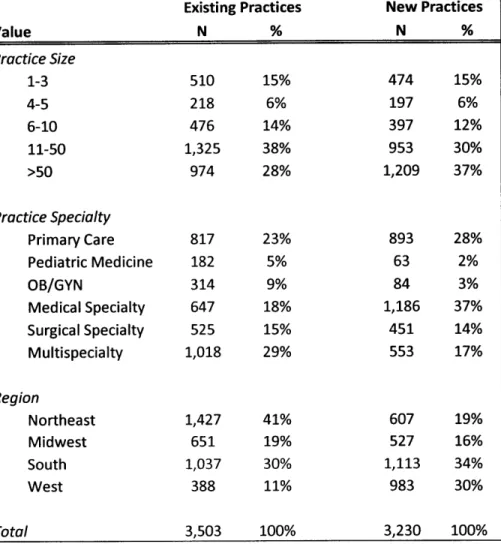
Table 3. Provider Population Characteristics
Selected characteristics for the two populations used in this study. "Existing Practices" denotes those providers that were with practices that were clients as of January 1st, 2007, as well as study exclusions. "New Practices"
denotes those providers with practices that became clients after January 1st, 2007, as well as study exclusions.
Existing Practices New Practices
Value N % N % Practice Size 1-3 510 15% 474 15% 4-5 218 6% 197 6% 6-10 476 14% 397 12% 11-50 1,325 38% 953 30% >50 974 28% 1,209 37% Practice Specialty Primary Care 817 23% 893 28% Pediatric Medicine 182 5% 63 2% OB/GYN 314 9% 84 3% Medical Specialty 647 18% 1,186 37% Surgical Specialty 525 15% 451 14% Multispecialty 1,018 29% 553 17% Region Northeast 1,427 41% 607 19% Midwest 651 19% 527 16% South 1,037 30% 1,113 34% West 388 11% 983 30% Total 3,503 100% 3,230 100% Statistical Analysis
Statistical analysis was performed using STATA version 10.1 and Microsoft Excel 2007. Multivariate linear and logistic regression with stepwise estimation using backwards selection
was used with a p<=0.05 cutoff to test a variety of assumptions. Model variables are listed in each case.
To quantify and compare exploration curves, the Bass diffusion model was used42. This is
represented by the following formula:
Nt = Nt-1 + p(m - Nt_-) + qq( N (m - N- ) Equation 1. Technology Diffusion Model
where Nt = the number of adopters at time t, p = coefficient of external influence (innovation) representing the inherent willingness to adopt, q = coefficient of internal influence (imitation) representing the factor that social forces play in adoption, and m = the total market potential.
To determine the coefficient of innovation (p) and imitation (q), I used Excel's Solver
functionality to create a linear optimization. Its objective function was to minimize the difference between the observed exploration curve and a technology diffusion curve described byp, q, and m for all monthly time points t.
Results
Provider Exploration and Use of the Clinician Performance Review
To understand adoption and information effects at the provider level, I looked at CPR adoption among clients who went live after January 1, 2007, and I observed the uptake of the CPR by the providers. For the purposes of this study, a medical provider was defined as a practice employee who provided billable clinical services. To be included, a provider had to be with their practice by October 1, 2008 and be active with the practice through March 1, 2009. In addition, to ensure that the included providers used athenaHealth's services in a consistent manner and that the providers were active throughout the study period, the provider had to average at least 20 appointments per month during the study period.
Exploration of the CPR by New Practices
I defined "exploration" as the first time a report for a given provider was accessed. I examined the length of time in months between when the physician first became active in the system and the time that the CPR report for that provider was explored. For consistency, I defined the provider's date of first activity as the date of the provider's first patient appointment resulting in billable activity.
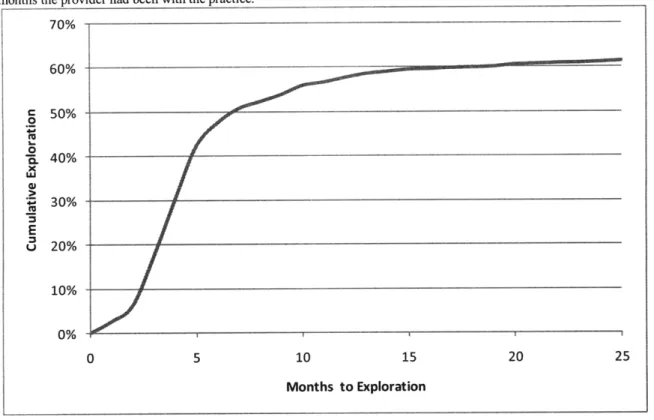
The exploration curve of the CPR by providers in new practices displayed a sharp initial uptake, with a declining rate of exploration as time went on (Figure 2). Ultimately, 61% of the CPR reports for the providers in this study were accessed at least once during the study timeframe of January, 2007 through March, 2009. Using the Bass diffusion formula (Equation 1) and linear optimization, I estimated coefficients of external (p) and internal (q) influences to be 0.18 and
Figure 2. Cumulative CPR Exploration Curve by All Providers
Displays the cumulative percent of medical providers whose CPR report had been accessed, as a function of the number of months the provider had been with the practice.
70% 60% c 50% ( 40% - 20% 10% 0% 0 5 10 15 20 25 Months to Exploration
Exploration of the CPR by New Providers
I also examined if there was a different rate of exploration among those providers who joined practices after the practices were already athenaHealth clients, and providers who joined practices that had already explored the CPR. I defined a "new provider" as a provider who was
entered into the system more than three months after the practice became an athenaHealth client. The cumulative exploration curve shows that there was little difference in the rate of exploration among all new providers compared with new providers who joined practices where other
providers had explored the CPR (Figure 3). The estimated coefficients of external and internal influence also were similar (Table 4).
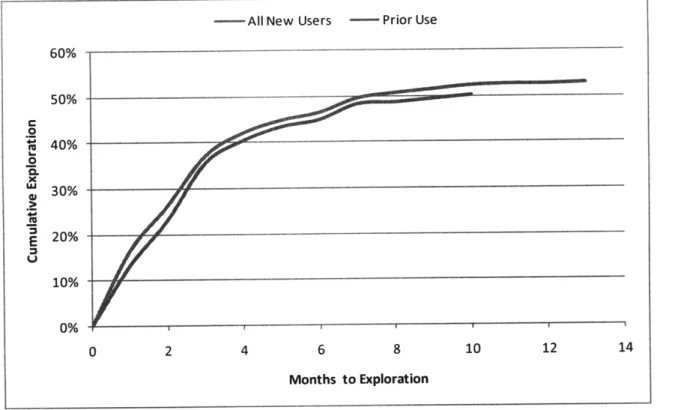
Figure 3. Cumulative CPR Exploration by New Providers
Displays the cumulative percent of providers who explored the CPR (n=358) to the cumulative exploration percent among
providers who joined practices where other providers had already explored the CPR (n=265)
- All New Users - Prior Use
60% 50% 30% -0 m 20% 10% -0% 0 2 4 6 8 10 12 14 Months to Exploration
Table 4. Diffusion Coefficient Estimates
Technology diffusion model estimates for the CPR exploration curve for all providers, providers who joined existing practices,
and providers who joined practices where other providers explored the CPR. Coefficients were estimated using linear
timization.
Coefficient of external Coefficient of internal
influence (p) influence (q)
All Providers 0.18 -0.29
New Providers 0.20 -0.36
New Providers with Prior Exploration 0.19 -0.34
Factors Associated with Exploration
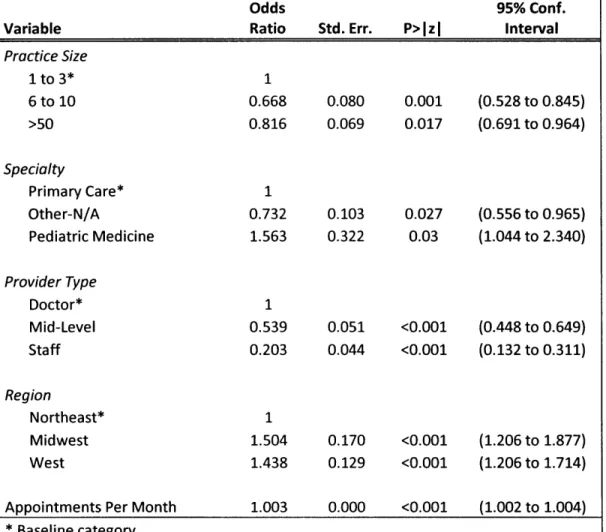
I created a multivariate model to determine if certain practice factors (region, practice size) or medical provider factors (specialty, provider type, provider activity level) were associated with exploring the CPR. Logistic regression using backwards elimination was used to determine the significant factors (Table 5). Pediatric providers were found to be more likely to explore the CPR (Odds=1.6, p =0.03). Mid-level and staff providers were significantly less likely to explore the
CPR (Odds=0.5 and 0.2 respectively, p<0.001). In addition, regional variation and practice size factors were observed. Activity level in terms of appointments per month was also a significant
factor. Providers who explored the CPR saw more patients per month: 207 (95% C.I. 200-213) vs. 156 (95% C.I.149-163).
Table 5. Factors Associated with CPR Exploration
P-Values were calculated using a multivariate logistic regression model using backwards elimination. Practice size, specialty, provider type, region and appointments per month were included in the model.
Odds 95% Conf.
Variable Ratio Std. Err. P> I z I Interval
Practice Size 1 to 3* 1 6 to 10 0.668 0.080 0.001 (0.528 to 0.845) >50 0.816 0.069 0.017 (0.691 to 0.964) Specialty Primary Care* 1 Other-N/A 0.732 0.103 0.027 (0.556 to 0.965) Pediatric Medicine 1.563 0.322 0.03 (1.044 to 2.340) Provider Type Doctor* 1 Mid-Level 0.539 0.051 <0.001 (0.448 to 0.649) Staff 0.203 0.044 <0.001 (0.132 to 0.311) Region Northeast* 1 Midwest 1.504 0.170 <0.001 (1.206 to 1.877) West 1.438 0.129 <0.001 (1.206 to 1.714)
Appointments Per Month 1.003 0.000 <0.001 (1.002 to 1.004)
* Baseline category
I also examined the factors influencing new providers who joined existing practices. In this analysis, I included another variable, the percentage of practices providers' CPRs that had been explored at the time a new provider joined a practice. I then examined whether this was different among new providers who explored the CPR vs. those that did not. I wanted to answer the question: if a significant portion of a practice's providers had explored the CPR, were new providers more likely to explore it? Although I found that the percentage of prior access was slightly higher among new providers who explored the CPR, this difference was not significant ( Table 6). In addition, when adjusted for specialty, region, provider type and activity level, the prior utilization in the practice did not emerge as a significant factor.
Table 6. New Provider Prior Utilization Percentage
P-value was calculated using a two-sample t-test with equal variances, testing the mean percentage of prior CPR exploration at the time a new provider joined a practice.
Group N Mean Std. Dev. 95% Confidence Interval
Explored?
No 168 0.31 0.27 0.27 0.35
Yes 191 0.32 0.31 0.27 0.36
Pr(l T/ > Itl) = 0.818
Utilization of the CPR
While exploration of the CPR report is important, it is the incorporation of this information into the provider's regular practice that will have an impact. To measure this, I looked at CPR utilization on a monthly basis among the population of providers that explored the CPR. I defined the utilization percentage for a given provider as the number of unique monthly CPR reports that were viewed divided by the number of months a provider was active. I defined a "heavy user" as one who accessed more than 50% of the available monthly reports during the provider's active period. Of the 3,230 providers, 1,983 went on to utilize it at least once, and 403 went on to become heavy users. This represents 12.5% of the study population, and 20% of the explorer population.
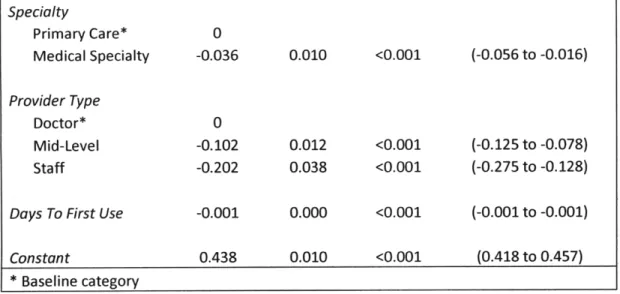
Using backwards elimination on a multivariate linear regression model with a p<0.05 cutoff, I created a model showing the significant factors relating to utilization (Table 7). The provider type again emerged as a significant factor, as well as practice size > 50. Medical specialties tended to utilize the report slightly less. Also, the number of days to the first use of the report
emerged as a significant factor; exploring the CPR earlier led to higher utilization. Providers in the highest quartile of use accessed the CPR 113 days earlier compared with the lowest quartile of use (Figure 4).
Table 7. Factors Relating to CPR Utilization
Results of a multivariate analysis using linear regression using backwards elimination and a p<0.05 cutoff. The following variables were included: region, provider type, practice size, specialty and the number of days to first use.
Variable Coefficient Std. Err. P>ItI 95% Conf. Interval
Practice Size
1 to 3* 0
Specialty Primary Care* Medical Specialty Provider Type Doctor* Mid-Level Staff
Days To First Use Constant 0 -0.036 -0.102 -0.202 -0.001 0.438 0.010 0.012 0.038 0.000 0.010 <0.001 <0.001 <0.001 <0.001 <0.001 (-0.056 to -0.016) (-0.125 to -0.078) (-0.275 to -0.128) (-0.001 to -0.001) (0.418 to 0.457) * Baseline category
Figure 4. Days to First Use by Quartile of Utilization
Shows the average number of days before the CPR was first accessed by quartile of utilization percent, as well as the 95% C.I.
The 4thquartile contains the heaviest users of the CPR.
300 250 200 150 100 50
1st Quartile 2nd Quartile 3rd Quartile 4th Quartile
Quartile of Utilization
Use of the CPR and Performance
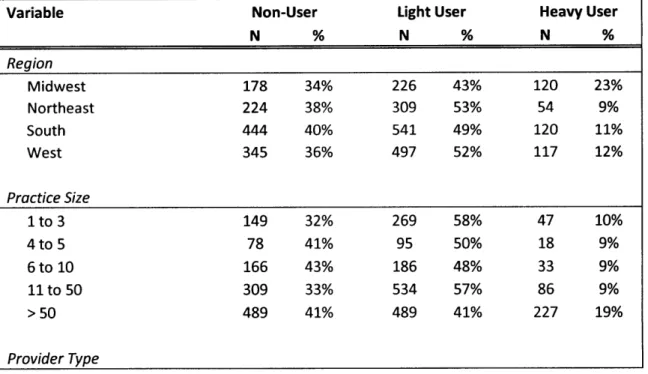
I divided the provider population into three classifications: heavy user (>50% utilization), light-user (<=50% utilization) and non-user. In addition, to ensure a more accurate comparison,
providers with missing performance data were eliminated. I compared the classifications across four performance metrics, two financial (days in accounts receivable and work RVUs per month) and two operational (denial rate per appointment and hold lag).
After eliminating providers with missing performance data, I was left with a provider population of 3,175 (Table 8). I found that heavy CPR users performed better in the hold lag metric and had more work RVUs per month (Figure 5 and Figure 6). There was a trend towards improved Days in Accounts Receivable, although this was not statistically significant (Figure 7). Interestingly, the denial rate showed a trend in the opposite direction, with heavy utilization associated with worse performance, although this was not statistically significant (Figure 8).
I tested whether utilization was a significant factor after adjusting for specialty, practice size and provider type by running a multivariate analysis. After running a regression with backwards elimination, utilization was the most significant factor relating to an improvement in hold lag (Table 9). Utilization was also significant with regard to improvements in DAR and Work RVU after adjusting for specialty, practice size and provider type (Table 10 and Table 12), and was associated with a slightly worse denial rate (Table 11).
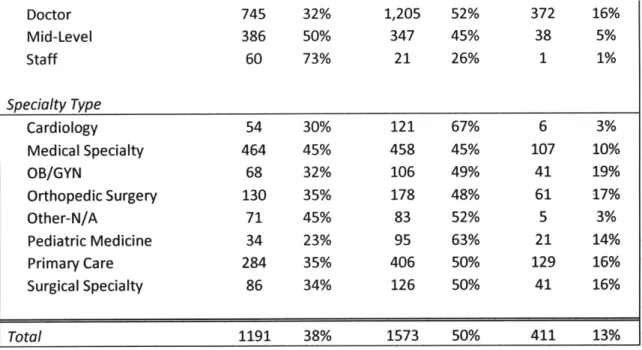
Table 8. Provider Characteristic in CPR Performance Evaluation
Characteristics of different types of users of the CPR. Heavy use of the CPR is defined as using the report >50% of the months it
was available; light use is defined as use of<= 50%.
Variable Non-User Light User Heavy User
N % N % N % Region Midwest 178 34% 226 43% 120 23% Northeast 224 38% 309 53% 54 9% South 444 40% 541 49% 120 11% West 345 36% 497 52% 117 12% Practice Size 1 to 3 149 32% 269 58% 47 10% 4 to 5 78 41% 95 50% 18 9% 6 to 10 166 43% 186 48% 33 9% 11 to 50 309 33% 534 57% 86 9% > 50 489 41% 489 41% 227 19% Provider Type ~ -:- -- r~~~s~a~,Y-,r~-~-a~,~
Mid-Level 386 50% 347 45% 38 5% Staff 60 73% 21 26% 1 1% Specialty Type Cardiology 54 30% 121 67% 6 3% Medical Specialty 464 45% 458 45% 107 10% OB/GYN 68 32% 106 49% 41 19% Orthopedic Surgery 130 35% 178 48% 61 17% Other-N/A 71 45% 83 52% 5 3% Pediatric Medicine 34 23% 95 63% 21 14% Primary Care 284 35% 406 50% 129 16% Surgical Specialty 86 34% 126 50% 41 16% Total 1191 38% 1573 50% 411 13%
Figure 5. Average Hold Lag by CPR Utilization
Average performance on the hold lag metric, by utilization group; lower is better. 95% C.I. is shown.
Heavy User
Light User
Non-User
0 1 2 3 4 5 6 7
Hold Lag (Days)
--745 32% 1,205 52% 372 16%
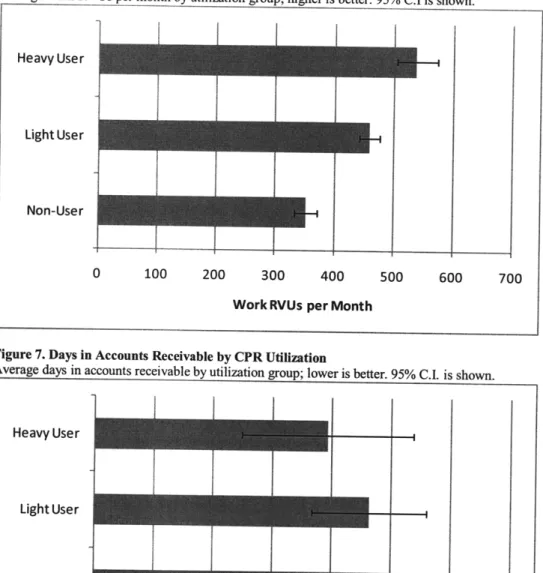
Figure 6. Average Work RVUs per Month by CPR Utilization
Average work RVUs per month by utilization group; higher is better. 95% C.I is shown.
Heavy User
Light User
Non-User
0 100 200 300 400 500 600 700
Work RVUs per Month
Figure 7. Days in Accounts Receivable by CPR Utilization
Average days in accounts receivable by utilization group; lower is better. 95% C.I. is shown.
I
i
Ij
Heavy User Light User Non-Useri_
~1~___
__I
40 41 42 43 44 45 46 47Days in Accounts Recievable
_ _ f
L
i
-
--- 1 -I---
I---Figure 8. Denial Rate per Appointment by CPR Utilization
Average number of denials per appointment by utilization group; lower is better. 95% C.I. is shown.
Heavy User
Light User
Non-User
0.00 0.05 0.10 0.15 0.20 0.25
Denial Rate per Appointment
Table 9. Variables Associated with Hold Lag in New Practices
Results of a multivariate analysis using linear regression and backwards elimination with a p<0.05 cutoff. Shows factors
associated with hold lag among providers in new practices; lower coefficients are better. Variables included were: provider type,
ractice size, specialty, and CPR utilization.
Variable Coefficient Std. Err. P Value 95% C.I.
Provider Type Doctor* 0 Mid-Level -0.573 0.229 0.012 (-1.022 to -0.124) Practice Size 1 to 3* 0 6 to 10 -1.977 0.339 <0.001 (-2.641 to -1.313) 11 to 50 -1.133 0.270 <0.001 (-1.661 to -0.604) >50 -1.295 0.259 <0.001 (-1.803 to -0.786) Specialty Primary Care* 0 Cardiology -0.831 0.411 0.043 (-1.637 to -0.025) Surgical Specialty -0.778 0.349 0.026 (-1.463 to -0.093) Utilization -2.612 0.393 <0.001 (-3.382 to -1.841) Constant 7.364 0.226 <0.001 (6.921 to 7.807) * Baseline category
Table 10. Factors Associated with DAR in New Practices
Results of a multivariate analysis using linear regression and backwards elimination with a p<0.05 cutoff. Shows factors associated with days in accounts receivable among providers in new practices; lower coefficients are better. Variables included were: provider type, practice size, specialty, and CPR utilization.
Variable Coefficient Std. Err. P Value 95% C.I.
Provider Type Doctor* 0 Staff -4.902 2.129 0.021 (-9.076 to -0.728) Practice Size 1 to 3* 0 6 to 10 -4.689 1.033 <0.001 (-6.714 to -2.664) Specialty Primary Care* 0 Cardiology -4.701 1.524 0.002 (-7.690 to -1.712) Medical Specialty -3.406 0.838 <0.001 (-5.049 to -1.764) Orthopedic Surgery -3.031 1.145 0.008 (-5.276 to -0.787) Other-N/A -3.931 1.615 0.015 (-7.096 to -0.765) Pediatric Medicine -8.6 1.650 <0.001 (-11.835 to -5.364) Surgical Specialty 3.438 1.325 0.010 (0.840 to 6.037) Utilization -3.853 1.403 0.006 (-6.603 to -1.103) Constant 48.333 0.691 <0.001 (46.979 to 49.687) * Baseline category
Table 11. Factors Associated with Denial Rate in New Practices
Results of a multivariate analysis using linear regression and backwards elimination with a p<0.05 cutoff. Shows factors associated with the per appointment denial rate among providers in new practices; lower coefficients are better. Variables included were: provider type, practice size, specialty, and CPR utilization.
Variable Coefficient Std. Err. P Value 95% C.I.
Provider Type Doctor* 0 Mid-Level -0.051 0.01 <0.001 (-0.070 to -0.032) Specialty Primary Care* 0 Cardiology 0.185 0.016 <0.001 (0.153 to 0.216) Medical Specialty 0.057 0.009 <0.001 (0.041 to 0.074) OB/GYN -0.043 0.015 0.003 (-0.072 to -0.015) Other-N/A 0.048 0.018 0.008 (0.012 to 0.084) Utilization 0.062 0.015 <0.001 (0.032 to 0.091) I--' - - - - , ", - _ _ I - - _ - _ _ _ - , _ _ _ - _ - - _ -I '
-* Baseline category
Table 12. Factors Associated with Work RVU in New Practices
Results of a multivariate analysis using linear regression and backwards elimination with a p<0.05 cutoff. Shows factors associated with the average monthly work RVU among providers in new practices; higher coefficients are better. Variables included were: provider type, practice size, specialty, and CPR utilization.
Variable Coefficient Std. Err. P Value 95% C.I.
Provider Type Doctor* 0 Mid-Level -239.554 14.546 <0.001 (-268.074 to -211.034) Staff -321.969 34.282 <0.001 (-389.187 to -254.751) Practice Size 1 to 3* 0 4 to 5 -89.040 23.981 <0.001 (-136.060 to -42.021) 11 to 50 -48.248 14.329 0.001 (-76.343 to -20.153) >50 -99.448 13.657 <0.001 (-126.225 to -72.671) Specialty Primary Care* 0 Cardiology 373.136 24.777 <0.001 (324.556 to 421.716) Medical Specialty 207.516 14.641 <0.001 (178.810 to 236.223) OB/GYN 140.426 22.965 <0.001 (95.397 to 185.454) Orthopedic Surgery 377.397 18.762 <0.001 (340.610 to 414.184) Other-N/A 146.497 27.922 <0.001 (91.749 to 201.244) Pediatric Medicine 71.244 26.587 0.007 (19.114 to 123.374) Surgical Specialty 333.806 21.550 <0.001 (291.552 to 376.060) Utilization 199.725 22.639 <0.001 (155.336 to 244.114) Constant 334.040 14.515 <0.001 (305.580 to 362.499) * Baseline category
Practice Exploration and Use of Report Builder
To understand adoption and use at the practice level, I studied the Report Builder feature. This feature was released in May, 2007, and it allows practices to create custom reports on their practice data. Prior to this, there were a number of predefined reports that were provided by
athenaHealth; custom reports were created on an individual basis for clients. Some of these predefined reports were incorporated into the Report Builder feature so that clients who
- --- ~-- I---, - --- --- _ ,-- --l c ~-laru;~.~-s~--- --- ~
previously used a predefined report on a regular basis would now use it through the Report Builder feature, which brought with it extra customization and display options.
There are a variety of users of the Report Builder feature. Operational reports might be run by the office staff. Larger practices with a dedicated management staff would typically run the higher level financial reports; in smaller practices, the physicians themselves might be the user. There was no fee for using the Report Builder feature; it was included in the regular software updates that all practices receive automatically.
To examine the Report Builder feature, I used the set of practices that were using the software as of January 1, 2007. In addition, there were a small number of practices that beta-tested the feature before its release; these practices were excluded.
Exploration of Report Builder
I defined Report Builder exploration as the first time a person from a practice accessed the Report Builder feature, based on web log data up to October 1, 2008. Overall, the cumulative
exploration curve exhibited a sharp initial uptake, with a declining rate of penetration as time went on (Figure 9). It took only 2 months for 50% of the practices to try the feature at least
once. However, it took 7 months to achieve 75%. As of October 1, 2008, 88% of these practices had used the feature at least once. Using linear optimization, the coefficient of internal (p) and
external (q) influence were calculated to be 0.36 and -0.35 respectively.
Figure 9. Report Builder Cumulative Exploration Percentage
Displays the cumulative percent of practices that tried the Report Builder feature at least once, as a function of the number of days after the Report Builder feature was released.
100% -90% 80% 0% 0 60% 5 50% t 40% E S30% 20% 10% 0% 0 5 10 15 20 25
Months After Feature Release
Factors Associated with Exploration
I ran a multivariate analysis to examine the practice factors associated with the exploration of the feature, as well as exploration in the first 30 days - "early explorers"(Table 13 and Table 14). Practice size of more than 5 physicians was associated with exploring the feature as well as being
an "early explorer". In addition, certain practices (OB/GYN and Pediatric Medicine) were
associated with early exploration. Region and the length of time as a client were other variables I explored, and were not found to be significant factors.
Table 13. Factors Associated with Practice Exploration of Report Builder
Significant factors associated with exploration of the Report Builder were determined with a multivariate model using logistic regression and backwards elimination. Variables included in the model were: practice size, specialty, region, and the number of months as a client.
Variable Odds Ratio Std. Err. P> z 95% Conf. Interval
Practice Size 1-3* 6-10 11-50 12.612 23.481 13.016 27.102 0.014 0.006 (1.668 to 95.338) (2.445 to 225.528) Specialty -- ~---- 1
* Baseline category
Table 14. Factors Associated with Early Exploration of Report Builder
Significant factors relating to early exploration (within 30 days) of the Report Builder feature were determined with a multivariate model using logistic regression and backwards elimination. Variables included in the model were: practice size, specialty, region, and the number of months as a client.
Variable Odds Ratio Std. Err. P> z 95% Conf. Interval
Practice Size 1-3* 1 6-10 4.236 1.282 <0.001 (2.340 to 7.666) 11-50 10.882 4.159 <0.001 (5.145 to 23.014) Specialty OB/GYN 2.030 0.546 0.009 (1.198 to 3.440) Pediatric Medicine 3.962 1.459 <0.001 (1.925 to 8.155) * Baseline category
Utilization of Report Builder
A feature such as custom reporting, despite providing valuable information, is not an integral part of practices' day to day operations. Therefore I decided to look at effective use of this
feature on a monthly scale, and measure the number of months that a practice utilized this feature, beginning with the month that it first used it. The question is essentially: once the practice tried this feature, did it incorporate it into its monthly operations?
The practices were roughly evenly distributed in their utilization of the Report Builder feature after using it once (Figure 10). 236 practices used it more than 50% of the months in the study period after using it once ("heavy users"); 218 practices used it 50% or less ("light users"). Heavy users represented 46% of the study population, and 52% of the explorer population.
I ran a multivariate analysis to look at factors related to heavy utilization of the report after exploration. These included the practice factors studied previously, as well as the length of time the practice waited before trying the Report Builder feature. Practice size of greater than 3 and
exploring the feature earlier were significant factors related to heavy use (Table 15). 100% of multispecialty practices were heavy users; OB/GYN practices were less likely to be heavy users.
(0.030 to 0.886) 1
Table 15. Factors Related To Heavy Report Builder Utilization
Heavy utilization was defined as use during >50% of months during the study period. Factors were determined through a
multivariate analysis using logistic regression and backwards elimination. Variables included practice size, region, specialty,
months as client and months to first use of the feature.
Variable Odds Ratio Std. Err. P> zl 95% Conf. Interval
Practice Size 1-3* 1 4-5 3.495 1.286 0.001 (1.699 to 7.189) 6-10 3.611 1.162 <0.001 (1.922 to 6.786) 11-50 5.987 2.521 <0.001 (2.623 to 13.668) Specialty Primary Care* 1 OB/GYN 0.479 0.148 0.018 (0.261 to 0.880)
Months To First Use 0.83 0.032 <0.001 (0.769 to 0.895)
* Baseline category
Figure 11 shows the association between utilization and days to first use in more detail. Those practices in the top two quartiles of use (practices that used the report more than 50% of the months) had a significantly lower delay in first exploring the report feature compared with those in the bottom two quartiles of use.
b~-Figure 10. Report Builder Monthly Utilization after First Use
Shows a histogram of the practices, grouped by the percentage of months that a practice accessed the Report Builder feature after trying for the first time. For example, a practice that used the Report Builder feature for the first time in January, 2008, and then used it four other months between then and October 2008 would have a utilization of 50%.
180 160 140 120 C 100 Cr W 80-60 40 20
>=25% 26%to 50% 51%to 75% 76%to 100%
%of Months Utilized
Figure 11. Report Builder Utilization and Days to First Use
Shows the average days to first use (measured in the number of days until the Report Builder feature was first used) by quartile of
Report Builder utilization. The error bars show the 95% confidence interval.
>75% 50-75% 0 25-50% <=25% 0 20 40 60 80 100 120 140
Days to First Use
Relationship to Performance
As mentioned earlier, information alone is rarely valuable. It is the actions that it inspires and the incentives that it creates that are the most telling and interesting. First, I examined whether higher performing practices were more likely to utilize the report builder heavily. I examined
three performance indicators, DAR, hold lag and denial rate (Work RVUs were excluded since this was not normalized for practice size) in the five month period prior to the release of the feature. All practices were ranked on a scale of 1 to n on these three metrics, with the best performer in a given metric receiving a 1, the next best a 2, and so on. A basic analysis indicated that future utilization of the Report Builder was associated with a better hold lag and DAR ranking (Table 16). However, when adjusted for practice size, specialty, and region, this effect was not present.
Table 16. Performance Rank Prior to Utilization
Shows the rank (lower is better) across three metrics in the five month period before the Report Builder feature was released, by future utilization of the feature. Heavy usage was defined as >50% of months.
usage N Avg. Hold Rank Avg. DAR Rank Avg. Denial Rate Rank
heavy 192 228 226 251
light 218 223 227 216
none 51 276 268 215
Next, I looked at whether utilization of the Report Builder feature was associated with improved performance during the study period. I ran a multivariate analysis looking at multiple factors relating to the performance metrics described above: DAR, hold lag, denial rate and work RVU. Included in this model was the utilization, which was defined as the number of months that a practice accessed the Report Builder feature during the study period of May 2007 to October 2008. Utilization of the feature was significantly associated with better performance in the DAR, hold lag, and work RVU metrics (Table 17, Table 18 and Table 20). However, utilization was associated with a slightly worse denial rate (Table 19).
Table 17. Factors Associated with Hold Lag in Existing Practices
Results of a multivariate analysis of hold lag performance using linear regression and backward elimination with a p < 0.05 cutoff. Shows factors related to hold lag performance among existing practices; lower coefficients are better. Variables included in the model were: region, specialty, size, and Report Builder utilization during the period May, 2007 through October, 2008.
Variable Coefficient Std. Err. P Value 95% Conf. Interval
Specialty
Primary Care* 0
Multispecialty 10.274 3.334 0.002 (3.723 to 16.825)
~C-p---7.18 1.829 <0.001 (-10.773 to -3.586)
Constant 11.16 1.024 <0.001 (9.147 to 13.173)
* Baseline category
Table 18. Factors Associated with DAR in Existing Practices
Results of a multivariate analysis of days in accounts receivable performance using linear regression and backward elimination with a p < 0.05 cutoff. Shows factors related to days in accounts receivable performance among existing practices; lower
coefficients are better. Variables included in the model were: region, specialty, size, and Report Builder utilization during the period May, 2007 through October, 2008.
Variable Coefficient Std. Err. P Value 95% Conf. Interval
Specialty Primary Care* 0 Multispecialty 16.893 5.783 0.004 (5.527 to 28.258) Surgical Specialty 10.488 2.765 <0.001 (5.054 to 15.922) Region Northeast* 0 West 7.01 3.14 0.026 (0.840 to 13.180) Utilization -8.006 3.177 0.012 (-14.250 to -1.762) Constant 42.726 1.954 <0.001 (38.885 to 46.567) * Baseline category
Table 19. Factors Associated with Denial Rate in Existing Practices
Results of a multivariate analysis of the per appointment denial rate using linear regression and backward elimination with a p < 0.05 cutoff. Shows factors related denial rate performance among existing practices; lower coefficients are better. Variables
included in the model were: region, specialty, size, and Report Builder utilization during the period May, 2007 through October, 2008.
Variable Coefficient Std. Err. P Value 95% Conf. Interval
Specialty Primary Care* 0 OB/GYN -0.017 0.007 0.014 (-0.031 to -0.003) Region Northeast* 0 South 0.013 0.006 0.021 (0.002 to 0.025) Utilization 0.019 0.007 0.008 (0.005 to 0.033) Constant 0.076 0.004 <0.001 (0.067 to 0.085) * Baseline category Utilization
Table 20. Factors Associated with Work RVU in Existing Practices
Results of a multivariate analysis of the average monthly work RVUs using linear regression and backward elimination with a p
< 0.05 cutoff. Shows factors related to work RVU performance among existing practices; lower coefficients are better. Variables
included in the model were: region, specialty, size, and Report Builder utilization during the period May, 2007 through October,
2008.
Variable Coefficient Std. Err. P Value 95% Conf. Interval
Practice Size 1-3* 0 4-5 20,030 10,189 0.05 ( 7 to 40,054) 6-10 64,932 9,923 <0.001 (45,431 to 84,433) 11-50 193,897 10,881 <0.001 ( 172,514 to 215,281) >50 470,239 22,548 <0.001 (425,927 to 514,552) Specialty Primary Care* 0 Medical Specialty 25,263 7,569 0.001 ( 10,388 to 40,139) OB/GYN 25,796 9,127 0.005 (7,860 to 43,733) Surgical Specialty 50,574 8,348 <0.001 (34,169 to 66,979) Utilization 39,136 10,136 <0.001 (19,217 to 59,056) Constant -10,556 6,609 0.111 (-23,544 to 2,433) * Baseline category
To detect whether the use of the Report Builder feature had a direct impact on performance, I studied financial and operation performance for a period of five months before the release of the feature (January, 2007 through May, 2007) and compared that to the same period the following year (January, 2008 through May, 2008). For each practice, I calculated the percentage change across four performance metrics: DAR, hold lag, denial rate and work RVUs per month. Again, in this basic analysis improved performance in all but work RVUs seemed to be present, but was not significant after adjusting for other factors (Table 21).
Table 21. Report Builder Use and Change in Performance
Shows the percentage change across four performance metrics from the period five months prior to the release of report builder and the same period in the next year after the release. Lower percentage change is better for hold lag, DAR and denial rate; higher is better for work RVU.
% Change in Hold % Change in Denial % Change in Work
usage Freq. Lag % Change in DAR Rate RVU per Month
heavy 192 12.9% 1.2% -4.8% 3.7%
light 218 56.8% 1.4% -11.9% 2.2%
none 51 57.8% 2.7% 8.8% 6.2%