HAL Id: hal-02921433
https://hal.inrae.fr/hal-02921433
Submitted on 26 Aug 2020
HAL is a multi-disciplinary open access
archive for the deposit and dissemination of
sci-entific research documents, whether they are
pub-lished or not. The documents may come from
teaching and research institutions in France or
abroad, or from public or private research centers.
L’archive ouverte pluridisciplinaire HAL, est
destinée au dépôt et à la diffusion de documents
scientifiques de niveau recherche, publiés ou non,
émanant des établissements d’enseignement et de
recherche français ou étrangers, des laboratoires
publics ou privés.
Distributed under a Creative Commons Attribution| 4.0 International License
analysis through differential analysis based on contrasts
inside GLM models
Ilana Lambert, Christine Paysant-Le Roux, Stefano Colella, Marie-Laure
Martin-Magniette
To cite this version:
Ilana Lambert, Christine Paysant-Le Roux, Stefano Colella, Marie-Laure Martin-Magniette.
DiCo-Express: a tool to process multifactorial RNAseq experiments from quality controls to co-expression
analysis through differential analysis based on contrasts inside GLM models. Plant Methods, BioMed
Central, 2020, 16 (1), �10.1186/s13007-020-00611-7�. �hal-02921433�
Lambert et al. Plant Methods (2020) 16:68 https://doi.org/10.1186/s13007-020-00611-7
SOFTWARE
DiCoExpress: a tool to process multifactorial
RNAseq experiments from quality controls
to co-expression analysis through differential
analysis based on contrasts inside GLM models
Ilana Lambert
1, Christine Paysant‑Le Roux
2,3, Stefano Colella
1and Marie‑Laure Martin‑Magniette
2,3,4*Abstract
Background: RNAseq is nowadays the method of choice for transcriptome analysis. In the last decades, a high num‑
ber of statistical methods, and associated bioinformatics tools, for RNAseq analysis were developed. More recently, sta‑ tistical studies realised neutral comparison studies using benchmark datasets, shedding light on the most appropriate approaches for RNAseq data analysis.
Results: DiCoExpress is a script‑based tool implemented in R that includes methods chosen based on their perfor‑
mance in neutral comparisons studies. DiCoExpress uses pre‑existing R packages including FactoMineR, edgeR and coseq, to perform quality control, differential, and co‑expression analysis of RNAseq data. Users can perform the full analysis, providing a mapped read expression data file and a file containing the information on the experimental design. Following the quality control step, the user can move on to the differential expression analysis performed using generalized linear models thanks to the automated contrast writing function. A co‑expression analysis is implemented using the coseq package. Lists of differentially expressed genes and identified co‑expression clusters are automatically analyzed for enrichment of annotations provided by the user. We used DiCoExpress to analyze a publicly available RNAseq dataset on the transcriptional response of Brassica napus L. to silicon treatment in plant roots and mature leaves. This dataset, including two biological factors and three replicates for each condition, allowed us to demonstrate in a tutorial all the features of DiCoExpress.
Conclusions: DiCoExpress is an R script‑based tool allowing users to perform a full RNAseq analysis from quality
controls to co‑expression analysis through differential analysis based on contrasts inside generalized linear models. DiCoExpress focuses on the statistical modelling of gene expression according to the experimental design and facili‑ tates the data analysis leading the biological interpretation of the results.
Keywords: RNA‑seq, Analysis workspace, Differential expression, Contrasts, Co‑expression
© The Author(s) 2020. This article is licensed under a Creative Commons Attribution 4.0 International License, which permits use, sharing, adaptation, distribution and reproduction in any medium or format, as long as you give appropriate credit to the original author(s) and the source, provide a link to the Creative Commons licence, and indicate if changes were made. The images or other third party material in this article are included in the article’s Creative Commons licence, unless indicated otherwise in a credit line to the material. If material is not included in the article’s Creative Commons licence and your intended use is not permitted by statutory regulation or exceeds the permitted use, you will need to obtain permission directly from the copyright holder. To view a copy of this licence, visit http://creat iveco mmons .org/licen ses/by/4.0/. The Creative Commons Public Domain Dedication waiver (http://creat iveco mmons .org/publi cdoma in/ zero/1.0/) applies to the data made available in this article, unless otherwise stated in a credit line to the data.
Background
During the last decades, Next-Generation Sequencing (NGS) technologies have developed at a fast pace with the improvement of data quality coupled with a reduc-tion of experimental costs. Since the early years of NGS, the use of RNAseq to profile transcriptomes became the method of choice replacing in time
microarray-based analyses [1]. Plant biologists use RNAseq-based
Open Access
Plant Methods
*Correspondence: Marie‑[email protected]
2 Institute of Plant Sciences Paris‑Saclay (IPS2), Université Paris‑Saclay,
CNRS, INRAE, Univ Evry, Bat. 630, 91405 Orsay, France
transcriptomic extensively, generating knowledge about transcriptional regulation in several biological processes [2–5]. Differential gene expression analysis across dif-ferent experimental conditions is classically used to gain insight into gene regulation events and gene co-expres-sion analysis to identify functional modules.
A classical analysis workflow starts with a data nor-malization step to account for technical biases that affect the number of reads mapped to a gene. Several meth-ods are available, and among the most used, we can find RPKM (Reads Per Kilobase per Million mapped reads) [6], Upper quartile normalization [7], RLE
(Rela-tive Log Expression) [8] and TMM (Trimmed Mean of
the M-values) [9]. Multiple methods, based on different
statistical modelling of data, are available to perform dif-ferential expression analysis. Negative binomial-based models with robust mean–variance modelling, have been used extensively at the beginning, and they are
avail-able in the R-packages edgeR [10] and DESeq [11]. More
recently, the linear models and their generalized exten-sions for negative binomial distributions (GLM) have been proposed to account for the versatility of multifac-torial experiments. They are available in the R-package
limma [12] for the linear models and in the R-packages
edgeR [10] and DESeq2 [11] for the generalized linear
models. Following differential gene expression analysis, several approaches to identify and group co-expressed genes have been in use over the years. Pearson’s or Spear-man’s correlations, WGCNA (Weighted correlation
net-work analysis) method [13], hierarchical clustering and
K-means are the most conventional approaches found in the literature [14, 15]. With these approaches, the num-ber of clusters is chosen, either a priori or a posteriori, by the user. Mixture models offer a different approach by identifying an underlying structure which corresponds to clusters of co-expressed genes. Moreover, a model selec-tion criterion allows determining the most appropriate cluster number [16, 17].
To perform such analysis, tools associated with the methods are available in R to quite quickly get from data to results [18]. In parallel bioinformatics tools offering a Graphical User Interface (GUI), and interactive visualiza-tion tools were developed. First-generavisualiza-tion tools included
the RNAseq read-mapping step [19–21], more often
real-ized independently at present, depending on data and genome availability. Several of these GUI tools [22–28] ease the use of the main RNAseq analysis R-packages for normalisation and differential expression analysis such as limma [12], DESeq [9], DESeq2 [11] and edgeR [10]. The role of these GUI is to realize R-based RNAseq data analysis with little or no experience in the command line. More recent tools take advantage of the R-shiny frame-work that eases the creation of a GUI for R-packages and
pipelines [29]. The majority of these GUI tools includes
a high number of data visualisation options and the pos-sibility to generate figures for publications.
Even with all these tools, a biologist is often facing a dilemma on how to analyse his dataset correctly. Indeed a characteristic shared by the majority of GUI tools developed up to date is to offer the user the possibility to choose among multiple statistical methods for each step of the analysis with no specific propositions. How-ever, the RNAseq data specificities, such as heterogeneity of counts or overdispersion among biological replicates, represent a methodological challenge that has to be addressed by proper statistical modelling of the gene expression. It is worth noting that in the case of multi-factorial experiments, if interaction terms are included in the modelling, the writing of the contrasts might become tricky, requiring a good understanding of some statisti-cal concepts, not always mastered by a biologist. As a result, the large-scale data analysis of RNAseq data is not straightforward for a biologist.
To respond to some of these challenges in RNAseq data analysis, we developed DiCoExpress to analyse RNAseq projects with at most two biological factors and an unbal-anced number of replicates for any condition.
Implementation
DiCoExpress is a script-based tool implemented in R with a set of directories where data, scripts and results are organised. The potential users of DicoExpress should know what a linear model and a contrast to be tested in such a context are. Regarding programming skills, the users should know how to use a function in R, identifying required and optional arguments.
Selection of the statistical methods
DiCoExpress offers a validated set of methods, based on three neutral comparison studies [17, 30, 31]. The idea of such studies is to design and implement a framework to generate realistic benchmark datasets with known truth to make an objective and reproducible performance assessment. Comparing normalisation methods, Dillies
et al. [30] showed that the RLE method implemented in
the package DESeq2 [11] and the TMM method
imple-mented in the package edgeR [10] demonstrate
satisfac-tory behaviour in the presence of highly expressed genes. Both these methods maintain a reasonable false-positive rate without loss of power. The choice of both methods was confirmed by Reddy et al. [32] and Evans et al. [33] even in experiments with slightly asymmetric differential expression or different amounts of mRNA/cell per condi-tion. Based on these detailed evaluations, both RLE and TMM are suitable, but we decided to choose the TMM normalisation as the default method and proposed RLE
Page 3 of 10 Lambert et al. Plant Methods (2020) 16:68
as an alternative due to the choice made for the differen-tial analysis described below.
Rigaill et al. [31] made a neutral comparison study
among differential gene expression methods, including negative binomial-based, generalized linear models, and linear models on transformed data. Performance analy-ses based on the p-value distributions, ROC curves, and proportion of true and false-positive rates show a clear difference of behaviour between negative binomial-based methods and the others. Linear models on transformed data or generalized linear models are consequently the most adapted for the differential analysis. Among these
models, as also observed in Schurch et al. [34], when
the proportion of differentially expressed genes is low, the results obtained with the method implemented in the edgeR package are more satisfying. We thus chose the statistical model implemented in the edgeR pack-age as a method of choice for differential expression data analysis. Moreover, we propose automatic writing of a large number of contrasts in order to facilitate the com-parisons between the biological conditions considered in the experimental design. This automatic writing is a real advantage because, in the available R-packages, most contrasts in GLM with interactions between two fac-tors must be handwritten and require thus an excellent understanding of the statistical modelling.
For the co-expression analysis, we preferred mixture models to correlation-based approaches. Mixture els aim at identifying an underlying structure in mod-elling the unknown distribution by a weighted sum of parametric distributions, each one representing a group of co-expressed genes. Gaussian mixture models were relevant for microarray data and were applied with suc-cess on several datasets [35, 36]. For RNAseq data, which are discrete, Rau et al. [16] first concluded that normal-ized expression profiles modelled with a Poisson mix-ture are relevant for co-expression analysis. However, in the Poisson mixture, the dependence structure between samples is not considered and can mislead the results. To tackle this problem, they proposed then a Gaussian mixture after a transformation of the normalized
expres-sion profiles [17]. This model seems to be more
suit-able for RNAseq co-expression analysis by providing a proper identification of the groups of co-expressed genes because it accounts for per-cluster correlation structures among samples. For these reasons, we chose this
Gauss-ian mixture implemented in the coseq R-package [17].
Architecture of DiCoExpress
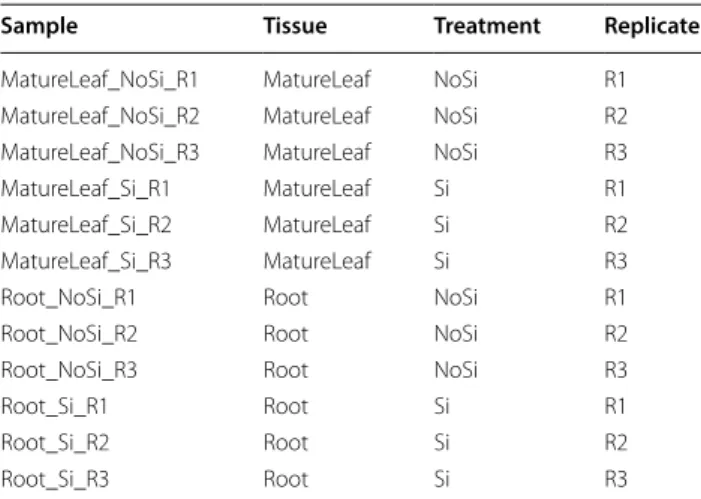
Using these neutral comparison studies, we combined the most suitable methods for each step of a standard RNAseq analysis. The tool DiCoExpress is a direc-tory composed of a set of subdirectories that is to be
installed on a computer for analysing RNAseq datasets (see Fig. 1). The directory Data stores all the projects, and the directory Results contains a subdirectory per project with all the results of the different steps. The directory Sources contains the R functions used by DiCoExpress. Finally, the directory Template_scripts contains an R script file for each project, allowing a semi-automated data analysis where the user is guided through all the steps from normalisation to co-expres-sion analysis. With DiCoExpress, our objective is to automate the statistical analysis of gene expression
Fig. 1 DiCoExpress workspace. A visual representation of the
DiCoExpress Workspace. a Sources directory contains all R functions implemented in DiCoExpress. b Template_scripts directory is the directory where an analysis script for each project analyzed must be saved. c Data directory is the directory where for each project, the input files (target and count tables) must be saved. If an annotation file used to describe biologically the different result tables as well as an reference file for the enrichment analysis are available, they must be also be saved in this directory. d Results directory contains all results obtained for each project
according to the experimental design to ease the inter-pretation of the results in biological terms.
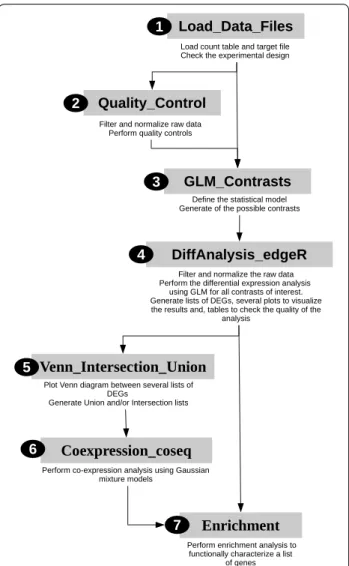
To create DiCoExpress, we use the R programming lan-guage and several R-packages from CRAN and Biocon-ductor [37, 38]. Each step of the analysis has a dedicated function available in the directory Sources. Seven
func-tions compose the core of DiCoExpress (Fig. 2), and they
are combined in a script, stored in the directory
Tem-plate_scripts for each project to specify the steps of the
analysis and the parameters to use. A full description of these seven functions is available in the Reference Man-ual (Additional file 1).
Input files and data quality controls
To use DiCoExpress on a project, the user has to pro-vide only two input files: one containing a count table summarizing the mapped reads for each gene, named Project_Name_COUNTS.csv, and a second one with a description of the project design according to the experi-mental factors, named Project_Name_TARGET.csv. If functional gene annotations are available in a file, the user has the option to upload it. This information is inte-grated into the result tables and can also be used to per-form enrichment tests.
The (1) Load_Data_Files function allows the user to upload the Project_Name_COUNTS.csv and Project_ Name_TARGET.csv files. A check is done to be sure that both files are adequately built: the samples in Project_ Name_COUNTS.csv file must be organized in the same order as the rows of the Project_Name_TARGET.csv. If it is inconsistent, then the columns of the Project_Name_ COUNTS.csv are reorganized according to the column of the target file. DiCoExpress performs analysis for a com-plete experimental design. If this condition is not veri-fied, then an error message appears, and the script stops running. A filter option in Load_Data_Files is proposed to extract or remove a subset of samples, thus avoiding manual modifications of the expression file. The filtering rules are described according to the Project_Name_TAR-GET.csv (see section Results for an example).
The (2) Quality_Control function produces a PDF file containing graphical outputs before and after normali-sation: histograms of the library sizes, boxplots of the counts for each sample, heatmap, and principal
compo-nent analysis (PCA), as shown in Additional file 2. This
step is optional, but we advise the users to perform it to evaluate the quality of the RNAseq data before further analyses.
Differential expression analysis
The differential analysis is based on a negative binomial GLM, where the log of the gene expression is modelled by all the factors describing the experiment. When the
number of observations is two times greater than the number of parameters of the model, we advise to include interaction terms between the biological factors. Such terms in the gene expression definition might reveal meaningful interactions such as genotype-environment interaction and answer in a direct way to some
biologi-cal questions [39–41]. The (3) GLM_Contrasts
func-tion automatically writes a list of contrasts based on the model specified by the user. We focused on contrasts
Fig. 2 Overview of DiCoExpress workflow. DiCoExpress is composed
of seven functions written in R programming language and available in the directory Sources. After loading the input files with the (1) Load_Data_Files function, a data quality control is done with the (2) Quality_Control function. Differential expression analysis using generalized linear models is performed by using the (3) GLM_Contrasts and (4) DiffAnalysis_edgeR functions. The union or intersection lists of differentially expressed genes are generated by the (5) Venn_Intersection_Union function. A co‑expression analysis is performed on these lists by the (6) Coexpression_coseq function. Finally, the functional characterisation of lists of genes is tested by using the (7) Enrichment function
Page 5 of 10 Lambert et al. Plant Methods (2020) 16:68
involving the biological factors, and their names are suf-ficiently explicit to understand the associated biological question addressed. For example, we proposed automatic writing of the difference between two modalities of a bio-logical factor averaged on the second factor or for a given modality of the second factor. Running this function is a prerequisite to run the differential expression analysis. The (4) DiffAnalysis_edgeR function uses edgeR R-pack-age to estimate the parameters of the GLM and then test every contrast chosen by the user. As proposed by Rigaill et al. [31], the distribution of raw p-values of each con-trast is inspected to assess the quality of the statistical modelling of the gene expression. Since the distribution
of raw p-values is theoretically dominated by a uniform distribution, the fit between the statistical model and the data can be observed on these raw p-value histograms. If the raw p-value distribution is not satisfactory (see exam-ple in the section Results and Fig. 3), we advise repeating the analysis using a more stringent cut-off for the filter-ing step or another rule of filterfilter-ing. If the raw p-value distribution remains unsatisfactory, the problem might come from a large number of parameters compared to the number of observations available to estimate them. In this case, we advise modifying the modeling of the gene expression removing, for example, the interaction term. For each contrast, a subdirectory is created to store
[MatureLeaf−Root] Raw pvalue Frequenc y 0.0 0.2 0.4 0.6 0.8 1.0 0 10000 20000 30000 [NoSi−Si] Raw pvalue Frequency 0.0 0.2 0.4 0.6 0.8 1.0 0 500 100 0 150 0 [MatureLeaf−Root] Raw pvalue Frequency 0.0 0.2 0.4 0.6 0.8 1.0 0 5000 15000 25000 [NoSi−Si] Raw pvalue Frequency 0.0 0.2 0.4 0.6 0.8 1.0 0 500 1000 150 0
a
b
Fig. 3 Histograms of raw p‑values Brassica napus analysis. Histograms of the raw p‑value for the contrasts [MatureLeaf–Root] and [NoSi–Si]
information about all the tested genes and also about the differentially expressed genes (DEGs). The function also generates graphical outputs about the behaviour of the top list of the DEGs (Additional file 3). All these files are described in details in the Reference Manual (Additional file 1).
Co‑expression analysis
The (5) Venn_Intersection_Union function helps the user in the interpretation of the results by comparing differ-ent DEG lists. This function also generates the union and/or the intersections of these DEG lists to perform a co-expression analysis with the (6) Coexpression_coseq
function. This latter function uses coseq R-package [17]
to transform the raw data into normalised expression profiles. We kept the filter function of coseq removing the genes with low mean normalised counts. Those dis-carded genes are assigned in Cluster 0. A co-expression analysis is performed on the remaining genes using a Gaussian mixture after an arcsin transformation of the normalised expression profiles. Practically, multidimen-sional Gaussian mixtures of 5–30 subpopulations with unequal proportions and general covariance matrix are estimated. The EM algorithm used to estimate the model parameters is known to be sensitive to the initialisation point. Coseq uses a small-EM strategy, and in DiCoEx-press, we go further to get robust results. First, mixture models with 5, 10, 15, 20, 25, and 30 subpopulations are estimated 5 times each to identify an interval for the final number of co-expressed gene clusters. A second collec-tion of models on this interval of a subpopulacollec-tion is then estimated 40 times each (per default). The best mixture model is the one minimising the Integrated Completed Likelihood (ICL). The ICL curve is expected to be a con-vex function of the number of subpopulations, and we use this criterion to assess that the chosen model fits well the data. When a different behaviour of the ICL curve is observed, we advise the user to modify the dataset removing some genes that show a too flat normalised profile. For the co-expression analyses, we recommend using a powerful calculation server. The RData object of the second loop is saved for each mixture model so, if the function is stopped, the analysis can be resumed. The RData of the selected model is also saved. Moreover, several tables and graphics are saved to check the analy-sis quality and to explore the co-expression results. An example is discussed in the section Results, and all the files are described in details in the Reference Manual (Additional file 1).
Enrichment analysis
Once an RNAseq statistical data analysis is complete, researchers often evaluate the coherence of the results by
comparing them with biological knowledge. To this end, the (7) Enrichment function performs hypergeometric tests to find annotation terms that are specifically over or under-represented in a given list of genes with respect to a reference specified by an annotation file. The enrich-ment analysis can be performed both on the lists of dif-ferentially expressed genes, and the co-expressed gene clusters.
Results and discussion
We illustrate the use of DiCoExpress by analysing a data-set associated with the publication of Haddad et al. [42]. This RNAseq dataset describes gene expression in roots and mature leaves of Brassica napus with or without sili-con (Si) treatment. Three biological replicates are avail-able. The experimental design can be described by two biological factors Tissue and Treatment, and a
techni-cal factor Replicate with three modalities (Table 1). To
illustrate the outputs of enrichment tests, we used the GO annotation of B. napus v.5 from the Brassica genome database [43, 44] to perform enrichment analyses.
We tested DiCoExpress on the full dataset available in contrast to Haddad et al, who only focused on the root samples. The procedure is described in Additional
file 4 as a tutorial of DiCoExpress. We started the
anal-ysis by filtering not expressed genes and those with low counts. We used the Counts Per Million (CPM) method with CPM_Cutoff = 1 and Filter_Strategy = “NbCondi-tions” that are the default arguments of Quality_Control function. We choose the default method TMM to nor-malise the RNAseq libraries. Checking the quality con-trol results in Brassica_napus_Data_Quality_Concon-trol. pdf output file, we observe a higher number of reads in the mature leaf samples compared to the root samples;
Table 1 Target table of Brassica napus dataset in R
The target table provides the experimental design. Each row describes a sample by specifying the level for each factor in the columns
Sample Tissue Treatment Replicate
MatureLeaf_NoSi_R1 MatureLeaf NoSi R1 MatureLeaf_NoSi_R2 MatureLeaf NoSi R2 MatureLeaf_NoSi_R3 MatureLeaf NoSi R3 MatureLeaf_Si_R1 MatureLeaf Si R1 MatureLeaf_Si_R2 MatureLeaf Si R2 MatureLeaf_Si_R3 MatureLeaf Si R3
Root_NoSi_R1 Root NoSi R1
Root_NoSi_R2 Root NoSi R2
Root_NoSi_R3 Root NoSi R3
Root_Si_R1 Root Si R1
Root_Si_R2 Root Si R2
Page 7 of 10 Lambert et al. Plant Methods (2020) 16:68
nonetheless, the normalisation seems suitable for fur-ther analysis since the boxplots of normalised counts are almost similar across all the samples (Additional file 2: Fig. A, B). A hierarchical clustering heatmap and prin-cipal component analysis graphs are generated to look at the sample similarities. In our analysis, we observe, as expected, a clear difference between the two tissues as well as an apparent clustering of mature leaf samples according to the treatment (Additional file 2: Fig. C, D).
We performed a differential expression analysis using a GLM with both biological factors and the technical rep-licate factor. We included an interaction between the two biological factors in the model. We checked the quality by looking at the raw p-value histograms of the seven contrasts automatically written by the GLM_Contrasts function. For the three contrasts, [MatureLeaf-Root], [NoSi_MatureLeaf-NoSi_Root], and [Si_MatureLeaf-Si_Root], the end of the histograms of raw p-values cor-responds to a uniform distribution indicating a good fit of the GLM model. However, on the histograms of the four other contrasts, [NoSi-Si], [MatureLeaf_NoSi-MatureLeaf_Si], [Root_NoSi-Root_Si] and [MatureLeaf_ NoSi-MatureLeaf_Si]-[Root_NoSi-Root_Si], we observe an increase of the frequency around 1: this usually sug-gests that data are not properly filtered (Fig. 3a). Follow-ing this observation, we went back to the beginnFollow-ing of the analysis, setting a more stringent CPM_Cutoff = 5, and we obtained satisfying raw p-value histograms for
the seven contrasts (Fig. 3b). We observed, as expected
that the highest number of differentially expressed genes is found for the comparison of both tissues with 28 261, 25 734, and 25 757 DEGs for the contrasts [Mature-Leaf-Root], [NoSi_MatureLeaf-NoSi_Root] and [Si_ MatureLeaf-Si_Root], respectively. A small number of differentially expressed genes is identified between the two treatments: 218, 754 and 173 DEGs for the contrasts [NoSi-Si], [MatureLeaf_NoSi-MatureLeaf_Si] and [Root_
NoSi-Root_Si], respectively (Additional file 3: Fig. A).
An advantage of using a GLM with an interaction term is to identify straightforward genes that respond differ-ently to the Silicon treatment in the two tissues using the [MatureLeaf_NoSi-MatureLeaf_Si]-[Root_NoSi-Root_Si] contrast. In this interaction analysis, we found 106 genes differentially expressed, and an example of a gene in this list is shown in Additional file 3: Fig. B. The hierarchical clustering on the top 50 DEGs ranking on their p-val-ues for this contrast is also proposed by DiCoExpress (Additional file 3: Fig. C). On the bottom of this plot, we observe groups of genes with a clear opposite behaviour between the two tissues. For the others, the behaviour is more variable, but all these genes are declared to be the most impacted genes by the treatment and in different ways in the two tissues.
As users often need to compare DEG lists, in DiCoEx-press, we propose the Venn_Intersection_Union func-tion to generate these lists quickly. In the Brassica napus dataset, we unite three contrasts: [MatureLeaf_NoSi-MatureLeaf_Si], [Root_NoSi-Root_Si] and [Mature-Leaf_NoSi-MatureLeaf_Si]-[Root_NoSi-Root_Si] to study genes impacted in their transcription by the
treat-ment (Additional file 5: Fig. A). Within the Venn
dia-gram, we can distinguish genes whose expression varies in response to treatment in a specific tissue or in both treatments with a similar or different behaviour depend-ing on the tissue and examples from each class is shown in Additional file 5: Fig. B. This grouping of genes using a Venn diagram is based only on the results of the sin-gle contrast differential analysis. However, by performing a co-expression analysis, we can go further in the inter-pretation by clustering these genes according to their average expression profile in all samples. We applied the Coexpression_coseq function with default param-eters to group the 945 DEGs from the union of the three contrasts. The ICL curve has a clear minimum which is a marker of a good quality clustering analysis
(Addi-tional file 4), and seven clusters of co-expressed genes
are found (Fig. 4). Three genes with low mean
normal-ised counts were assigned in Cluster 0, i.e., coseq could not assign them to a cluster. Clusters 3 and 6 (71 and 106 genes, respectively) contain genes with low expression and no change in the roots, but their expression varies in response to the Si treatment in the mature leaves (over-expression in Cluster 3 and under-(over-expression in Cluster 6). Conversely, Cluster 7 (201 genes) show low expression with no significant change in the mature leaves, but they are strongly expressed in the roots with a slight reduc-tion following the treatment. Cluster 1 and 4 (203 and 146 genes, respectively) include genes more expressed in one tissue compared to the other one (higher expres-sion in mature leaves for cluster 4 and higher expresexpres-sion in roots for cluster 1) but without significant Si treat-ment response. In cluster 2 (85 genes) and cluster 5 (130 genes) are grouped genes showing a small difference in expression levels between the two tissues. For both clus-ters, genes show over-expression following the treatment in leaves (more apparent in cluster 5), but no significant change in roots. The cluster composition based on prob-abilistic modelling of the normalised gene profiles is, as it could be expected, different from the groups of genes
found with the DEG list comparisons (Additional file 6).
Following the co-expression analysis, that finishes the statistical analysis of this dataset used to illustrate the use of DiCoExpress, we performed enrichment analy-ses on these 7 clusters, and also of the 106 DEGs for the
interaction contrast, and they are available in the tutorial
(Additional file 4). Further interpretation and discussion of the biology behind these enrichments are beyond the scope of our presentation of the DiCoExpress usage.
7 4 5 6 1 2 3 0.0 0.2 0.4 0.6 0.8 0.0 0.2 0.4 0.6 0.8 0.0 0.2 0.4 0.6 0.8 Av erage ex pression profiles
conds
MatureLeaf_NoSi MatureLeaf_Si Root_NoSi Root_Si C luster Sizes
Cluster 2
Cluster 3
Cluster 4
85
71
146
Cluster 1
203
Cluster 6
Cluster 7
Cluster 5
106
201
130
Fig. 4 Co‑expression clusters for the Brassica napus analysis. Average expression profiles and size of the c co‑expression clusters found by analysing
of the 945 Differentially expressed genes (DEGs) from the union of three contrasts: [MatureLeaf_NoSi–MatureLeaf_Si], [Root_NoSi–Root_Si] and [MatureLeaf_NoSi–MatureLeaf_Si]‑[Root_NoSi–Root_Si]
Page 9 of 10 Lambert et al. Plant Methods (2020) 16:68
Conclusions
DiCoExpress is an R script-based tool for analysing effi-ciently multifactorial RNAseq transcriptome experiments from quality controls to co-expression analysis through differential expression analysis. We based the develop-ment of DiCoExpress on neutral comparison studies combining the most performant statistical approaches for each step of a standard RNAseq analysis. The choice of a statistics defined framework, limiting the free selec-tion of models and methods, was deliberate to propose to the users the possibility to perform RNAseq analysis in a standardised manner. In DiCoExpress, we used general-ized linear models implemented in the R-package edgeR for differential gene expression analysis and Gaussian mixture models implemented in the R-package coseq to perform the co-expression analysis. DiCoExpress sim-plifies the GLM analysis proposing automated writing of all possible contrasts and optimises the co-expression analysis with the re-estimation of the collection of Gauss-ian models. DiCoExpress produces a collection of files to visualise the results and multiple summary files of the data for further data exploration. The integrated enrich-ment analysis with the hypergeometric test gives the user the first glimpse at potential biological functions under-lying the different gene lists. In conclusion, DiCoExpress allows the user to perform RNAseq data analysis with validated statistical methods with a set of R-scripts in a pre-existing and organised working environment.
Availability and requirements
• Project name: DiCoExpress
• Project home page: https ://forge mia.inra.fr/GNet/
dicoe xpres s
• Operating system(s): Windows, Mac OS, Linux • Programming language: R
• Other requirements: R version 3.5.0 or higher with FactoMineR_2.0
• License: GPL-2 | GPL-3
• Any restrictions to use by non-academics: None
Supplementary information
Supplementary information accompanies this paper at https ://doi. org/10.1186/s1300 7‑020‑00611 ‑7.
Additional file 1. Reference Manual.
Additional file 2. Data quality control Brassica napus results. Data quality control after the filtering and TMM normalisation (A) Library sizes for each sample (B) Boxplot of normalised counts for each sample (C) Heatmap made with the Euclidean distance and the Ward distance to cluster the samples (D) First and second axes of the Principal Component Analysis
on the normalised counts. Samples corresponding to mature leaves are coloured in green and those of roots in brown.
Additional file 3. Differential expression Brassica napus analysis results. Differential expression analysis results with (A) the barplot of Up and Down differentially expressed genes for each contrast, (B) an example of one gene differentially expressed in the interaction contrast. (C) Hierarchi‑ cal clustering of the top 50 DEGs for the interaction contrast.
Additional file 4. Analysis Tutorial.
Additional file 5. Brassica napus GLM contrasts results. Organisation of the genes impacted in their transcription by the silicon treatment issued from the GLM differential analysis. (A) Venn diagram describing the num‑ bers of differentially expressed genes in the three contrasts [MatureLeaf_ NoSi‑MatureLeaf_Si], [Root_NoSi‑Root_Si] and [MatureLeaf_NoSi‑Mature‑ Leaf_Si]‑[Root_NoSi‑Root_Si], and their overlaps: (B) Gene expression of genes representative of each group of the Venn diagram (described with small letters from a to g).
Additional file 6. Comparison of DEG lists and clusters of co‑expression. Abbreviations
CPM: Counts per million; DEGs: Differentially expressed genes; FDR: False discovery rate; GLM: Generalized linear models; ICL: Integrated completed likelihood; LM: Linear model; NB: Negative binomial; NGS: Next generation sequencing; PCA: Principal component analysis; RLE: Relative log expression; RPKM: Reads per kilobase per million mapped reads; TMM: Trimmed mean of the M‑values.
Acknowledgements
This work was mainly supported by the ANR PSYCHE (ANR‑16‑CE20‑0009) and IPS2 benefits from the support of the LabEx Saclay Plant Sciences‑SPS (ANR‑10‑LABX‑0040‑SPS).
Authors’ contributions
IL, SC, and MLMM planned the pipeline. SC provided end‑user biologist sug‑ gestions and tests. MLMM provided statistical expertise. IL and MLMM wrote the software, with contributions of CPLR. IL, CPLR, SC, and MLMM tested the pipeline. IL, SC, and MMLM wrote the paper. All authors read and approved the final manuscript.
Funding
This work was mainly supported by the ANR PSYCHE (ANR‑16‑CE20‑0009) and IPS2 benefits from the support of the LabEx Saclay Plant Sciences‑SPS (ANR‑10‑LABX‑0040‑SPS).
Availability of data and materials https ://forge mia.inra.fr/GNet/dicoe xpres s. Ethics approval and consent to participate Not applicable.
Consent for publication Not applicable. Competing interests
The authors declare that they have no competing interests. Author details
1 LSTM, Laboratoire des Symbioses Tropicales et Méditerranéennes, IRD, CIRAD,
INRAE, SupAgro, Univ Montpellier, Montpellier, France. 2 Institute of Plant
Sciences Paris‑Saclay (IPS2), Université Paris‑Saclay, CNRS, INRAE, Univ Evry, Bat. 630, 91405 Orsay, France. 3 Institute of Plant Sciences Paris Saclay (IPS2), Uni‑
versité de Paris, CNRS, INRAE, Bat. 630, 91405 Orsay, France. 4 UMR MIA‑Paris,
AgroParisTech, INRAE, Université Paris‑Saclay, 75005 Paris, France. Received: 23 December 2019 Accepted: 3 May 2020
References
1. Wang Z, Gerstein M, Snyder M. RNA‑Seq: a revolutionary tool for tran‑ scriptomics. Nat Rev Genet. 2009;10:57–63.
2. Agarwal P, Parida SK, Mahto A, Das S, Mathew IE, Malik N, et al. Expand‑ ing frontiers in plant transcriptomics in aid of functional genomics and molecular breeding. Biotechnol J. 2014;9:1480–92.
3. O’Rourke JA, Bolon Y‑T, Bucciarelli B, Vance CP. Legume genomics: understanding biology through DNA and RNA sequencing. Ann Bot. 2014;113:1107–20.
4. Rutley N, Twell D. A decade of pollen transcriptomics. Plant Reprod. 2015;28:73–89.
5. Bashir K, Matsui A, Rasheed S, Seki M. Recent advances in the charac‑ terization of plant transcriptomes in response to drought, salinity, heat, and cold stress. F1000Res. 2019. https ://doi.org/10.12688 /f1000 resea rch.18424 .1.
6. Mortazavi A, Williams BA, McCue K, Schaeffer L, Wold B. Mapping and quantifying mammalian transcriptomes by RNA‑Seq. Nat Methods. 2008;5:621–8.
7. Bullard JH, Purdom E, Hansen KD, Dudoit S. Evaluation of statistical methods for normalization and differential expression in mRNA‑Seq experiments. BMC Bioinform. 2010;11:94.
8. Anders S, Huber W. Differential expression analysis for sequence count data. Genome Biol. 2010;11:R106.
9. Robinson MD, Oshlack A. A scaling normalization method for differential expression analysis of RNA‑seq data. Genome Biol. 2010;11:R25. 10. Robinson MD, McCarthy DJ, Smyth GK. edgeR: a Bioconductor package
for differential expression analysis of digital gene expression data. Bioin‑ formatics. 2010;26:139–40.
11. Love MI, Huber W, Anders S. Moderated estimation of fold change and dispersion for RNA‑seq data with DESeq2. Genome Biol. 2014;15:550. 12. Ritchie ME, Phipson B, Wu D, Hu Y, Law CW, Shi W, et al. limma powers dif‑
ferential expression analyses for RNA‑sequencing and microarray studies. Nucleic Acids Res. 2015;43:e47.
13. Langfelder P, Horvath S. WGCNA: an R package for weighted correlation network analysis. BMC Bioinform. 2008;9:559.
14. Kumari S, Nie J, Chen H‑S, Ma H, Stewart R, Li X, et al. Evaluation of gene association methods for coexpression network construction and biologi‑ cal knowledge discovery. PLoS ONE. 2012;7:e50411.
15. D’haeseleer P. How does gene expression cluster work. Nat Biotech. 2006;23(12):1499–501.
16. Rau A, Maugis‑Rabusseau C, Martin‑Magniette M‑L, Celeux G. Co‑expres‑ sion analysis of high‑throughput transcriptome sequencing data with poisson mixture models. Bioinformatics. 2015;31:1420–7.
17. Rau A, Maugis‑Rabusseau C. Transformation and model choice for RNA‑ seq co‑expression analysis. Brief Bioinform. 2018;19:425–36.
18. Law CW, Alhamdoosh M, Su S, Dong X, Tian L, Smyth GK, et al. RNA‑seq analysis is easy as 1‑2‑3 with limma, glimma and edgeR. F1000Res. 2016.
https ://doi.org/10.12688 /f1000 resea rch.9005.3.
19. Lohse M, Bolger AM, Nagel A, Fernie AR, Lunn JE, Stitt M, et al. RobiNA: a user‑friendly, integrated software solution for RNA‑Seq‑based transcrip‑ tomics. Nucleic Acids Res. 2012;40:W622–7.
20. Russo F, Angelini C. RNASeqGUI: a GUI for analysing RNA‑Seq data. Bioin‑ formatics. 2014;30:2514–6.
21. Russo F, Righelli D, Angelini C. Advancements in RNASeqGUI towards a reproducible analysis of RNA‑Seq experiments. Biomed Res Int. 2016;2016:7972351.
22. Nelson JW, Sklenar J, Barnes AP, Minnier J. The START App: a web‑ based RNAseq analysis and visualization resource. Bioinformatics. 2017;33:447–9.
23. Varet H, Brillet‑Guéguen L, Coppée J‑Y, Dillies M‑A. SARTools: A DESeq2‑ and EdgeR‑Based R Pipeline for Comprehensive Differential Analysis of RNA‑Seq Data. PLoS ONE. 2016; 11.
24. Su S, Law CW, Ah‑Cann C, Asselin‑Labat M‑L, Blewitt ME, Ritchie ME. Glimma: interactive graphics for gene expression analysis. Bioinformatics. 2017;33:2050–2.
25. Li Y, Andrade J. DEApp: an interactive web interface for differential expres‑ sion analysis of next generation sequence data. Source Code Biol Med. 2017;12:2.
26. Zhu Q, Fisher SA, Dueck H, Middleton S, Khaladkar M, Kim J. PIVOT: platform for interactive analysis and visualization of transcriptomics data. BMC Bioinform. 2018;19:6.
27. Choi K, Ratner N. iGEAK: an interactive gene expression analysis kit for seamless workflow using the R/shiny platform. BMC Genomics. 2019;20:177.
28. Kucukural A, Yukselen O, Ozata DM, Moore MJ, Garber M. DEBrowser: interactive differential expression analysis and visualization tool for count data. BMC Genomics. 2019;20:6.
29. Shiny: web application framework for R version 1.3.2 from CRAN. https :// rdrr.io/cran/shiny / Accessed 11 Jul 2019.
30. Dillies M‑A, Rau A, Aubert J, Hennequet‑Antier C, Jeanmougin M, Serv‑ ant N, et al. A comprehensive evaluation of normalization methods for illumina high‑throughput RNA sequencing data analysis. Brief Bioinform. 2013;14:671–83.
31. Rigaill G, Balzergue S, Brunaud V, Blondet E, Rau A, Rogier O, et al. Synthetic data sets for the identification of key ingredients for RNA‑seq differential analysis. Brief Bioinform. 2018;19:65–76.
32. Reddy R. A comparison of methods: normalizing high‑throughput RNA sequencing data. bioRxiv. 2015;026062.
33. Evans C, Hardin J, Stoebel DM. Selecting between‑sample RNA‑Seq normalization methods from the perspective of their assumptions. Brief Bioinform. 2018;19:776–92.
34. Schurch NJ, Schofield P, Gierliński M, Cole C, Sherstnev A, Singh V, et al. How many biological replicates are needed in an RNA‑seq experi‑ ment and which differential expression tool should you use? RNA. 2016;22:839–51.
35. Zaag R, Tamby JP, Guichard C, Tariq Z, Rigaill G, Delannoy E, et al. GEM2Net: from gene expression modeling to ‑omics networks, a new CATdb module to investigate Arabidopsis thaliana genes involved in stress response. Nucleic Acids Res. 2015;43:D1010–7.
36. Frei dit Frey N, Garcia AV, Bigeard J, Zaag R, Bueso E, Garmier M, et al. Functional analysis of Arabidopsisimmune‑related MAPKs uncovers a role for MPK3 as negative regulator of inducible defences. Genome Biol. 2014;15:R87.
37. R: The R project for statistical computing. https ://www.r‑proje ct.org/
Accessed 28 Nov 2019.
38. Huber W, Carey VJ, Gentleman R, Anders S, Carlson M, Carvalho BS, et al. Orchestrating high‑throughput genomic analysis with Bioconductor. Nat Methods. 2015;12:115–21.
39. Brady SM, Burow M, Busch W, Carlborg Ö, Denby KJ, Glazebrook J, et al. Reassess the t test: interact with all your data via ANOVA. Plant Cell. 2015;27:2088–94.
40. Boussardon C, Martin‑Magniette M‑L, Godin B, Benamar A, Vittrant B, Cit‑ erne S, et al. Novel cytonuclear combinations modify Arabidopsis thaliana seed physiology and vigor. Front Plant Sci. 2019;10:32.
41. Varet H, Shaulov Y, Sismeiro O, Trebicz‑Geffen M, Legendre R, Coppée J‑Y, et al. Enteric bacteria boost defences against oxidative stress in Enta-moeba histolytica. Sci Rep. 2018;8:1–12.
42. Haddad C, Trouverie J, Arkoun M, Yvin J‑C, Caïus J, Brunaud V, et al. Silicon supply affects the root transcriptome of Brassica napus L. Planta. 2019;249:1645–51.
43. Montenegro JD, Golicz AA, Bayer PE, Hurgobin B, Lee H, Chan C‑KK, et al. The pangenome of hexaploid bread wheat. Plant J. 2017;90:1007. 44. The Brassica Genome Database, Genoscope, CEA, France. http://www.
genos cope.cns.fr/brass icana pus/. Publisher’s Note
Springer Nature remains neutral with regard to jurisdictional claims in pub‑ lished maps and institutional affiliations.
![Fig. 3 Histograms of raw p‑values Brassica napus analysis. Histograms of the raw p‑value for the contrasts [MatureLeaf–Root] and [NoSi–Si]](https://thumb-eu.123doks.com/thumbv2/123doknet/13891030.447393/6.892.82.813.420.1048/histograms-values-brassica-napus-analysis-histograms-contrasts-matureleaf.webp)