HAL Id: inserm-02509447
https://www.hal.inserm.fr/inserm-02509447
Submitted on 16 Mar 2020
HAL is a multi-disciplinary open access
archive for the deposit and dissemination of
sci-entific research documents, whether they are
pub-lished or not. The documents may come from
teaching and research institutions in France or
abroad, or from public or private research centers.
L’archive ouverte pluridisciplinaire HAL, est
destinée au dépôt et à la diffusion de documents
scientifiques de niveau recherche, publiés ou non,
émanant des établissements d’enseignement et de
recherche français ou étrangers, des laboratoires
publics ou privés.
Hypsibius exemplaris unveils an anhydrobiotic-specific
architecture
Myriam Richaud, Emilie Le Goff, Chantal Cazevielle, Fumihisa Ono,
Yoshihisa Mori, Naurang Saini, Pierre Cuq, Stephen Baghdiguian, Nelly
Godefroy, Simon Galas
To cite this version:
Myriam Richaud, Emilie Le Goff, Chantal Cazevielle, Fumihisa Ono, Yoshihisa Mori, et al..
Ultra-structural analysis of the dehydrated tardigrade Hypsibius exemplaris unveils an anhydrobiotic-specific
architecture. Scientific Reports, Nature Publishing Group, 2020, 10 (1), pp.4324.
�10.1038/s41598-020-61165-1�. �inserm-02509447�
www.nature.com/scientificreports
Ultrastructural analysis of
the dehydrated tardigrade
Hypsibius exemplaris unveils an
anhydrobiotic-specific architecture
Myriam Richaud
1,6*, Emilie Le Goff
2,6, Chantal cazevielle
3, Fumihisa ono
4, Yoshihisa Mori
4,
naurang L. Saini
5, Pierre cuq
1, Stephen Baghdiguian
2, Nelly Godefroy
2,7& Simon Galas
1,7tardigrades can cope with adverse environmental conditions by turning into anhydrobiotes with a characteristic tun shape. tun formation is an essential morphological adaptation for tardigrade entry into the anhydrobiotic state. the tun cell structure and ultrastructure have rarely been explored in tardigrades in general and never in Hypsibius exemplaris. We used transmission electron microscopy to compare cellular organization and ultrastructures between hydrated and anhydrobiotic H. exemplaris. Despite a globally similar cell organelle structure and a number of cells not significantly different between hydrated and desiccated tardigrades, reductions in the sizes of both cells and mitochondria were detected in dehydrated animals. Moreover, in anhydrobiotes, secretory active cells with a dense endoplasmic reticulum network were observed. Interestingly, these anhydrobiote-specific cells are in a close relationship with a specific extracellular structure surrounding each cell. It is possible that this rampart-like extracellular structure resulted from the accumulation of anhydrobiotic-specific material to protect the cells. Interestingly, after five hours of rehydration, the number of secretory cells decreased, and the specific extracellular structure began to disappear. Twenty-four hours after the beginning of rehydration, the cellular structure and ultrastructure were comparable to those observed in hydrated tardigrades.
Among all adaptative survival strategies that organisms have developed in response to harsh environmental con-ditions, cryptobiosis must be considered one of the most extreme. Tardigrades, which are invertebrates closely related to Arthropoda and Onychophora, are renowned for their remarkable cryptobiosis capabilities. According to Crowe’s1 study in 1975, four types of cryptobiosis are identifiable in tardigrades: (i) anhydrobiosis: induced by
desiccation, (ii) cryobiosis: induced by freezing, (iii) anoxybiosis: induced by lack of oxygen and (iv) osmobiosis: induced by a high salt concentration. Among them, anhydrobiosis is considered the most common1,2.
While most animals have a limited ability to survive dehydration3, a few species in invertebrate taxa are able
to survive complete water loss4. These organisms include bdelloid rotifers, nematodes and tardigrades, which
have the ability to enter anhydrobiosis at any developmental stage1,5–7, and some dipteran larvae, such as those of
the chironomid Polypedilum vanderplanki8. The process of anhydrobiosis is different depending on the animal.
Indeed, when exposed to desiccation, the nematode Ditylenchus dipsaci coils into a tight spiral9, while tardigrades
and rotifers form a tun to reduce their body surface area and rate of evaporation10–12. Nevertheless, little is known
about how tardigrades survive such extreme stresses.
Numerous protein families and classes have been implicated in desiccation tolerance processes in other sys-tems, including heat-shock proteins, antioxidant enzymes and some intrinsically disordered protein families13–15.
For example, late embryogenesis abundant (LEA) proteins, belonging to the intrinsically disordered protein (IDP) family, have been found to stabilize membranes or sensitive enzymes during freezing or drying in a wide
1IBMM, University of Montpellier, CNRS, ENSCM, Montpellier, France. 2ISEM, University of Montpellier, CNRS, EPHE, IRD, Montpellier, France. 3COMET, Platform Montpellier RIO Imaging, INM, University of Montpellier, INSERM, Montpellier, France. 4Department of Applied Science, Okayama University of Science, Okayama, Japan. 5Dipartimento di Fisica, Universita di Roma «La Sapienza», Roma, Italy. 6These authors contributed equally: Myriam Richaud and Emilie Le Goff. 7These authors jointly supervised this work: Nelly Godefroy and Simon Galas. *email: myriam.richaud@umontpellier.fr
variety of organisms ranging from bacteria to plants and animals13. In plants, the LEA protein family vitrifies
sugars to protect seeds and roots from drought15. The disaccharide trehalose has also been proposed to play a
role in mediating desiccation tolerance. Nevertheless, although trehalose is essential for the protection of some organisms, such as Caenorhabditis elegans, Saccharomyces cerevisiae and chironomids, by vitrifying their cellular contents, other desiccation-tolerant animals, such as rotifers, do not require this sugar16–19. In Tardigrada, the
presence and role of trehalose are still unclear. Some studies report low levels of this sugar, while others cannot identify trehalose at all in the same species20–24. It has not yet been studied in Hypsibius exemplaris.
Concerning morphological analyses, there are only a few reports on the ultrastructure of anhydrobiote ani-mals1,25–27. Several studies on the ultrastructure of the hydrated tardigrade body wall have been conducted28–33,
but studies on the ultrastructure of the tun stage are extremely rare. A study by Halberg et al.34 in 2013 described
the tun morphology of the eutardigrade Richtersius coronifer with an emphasis on muscular organization. Studies by Czernekova et al.35,36 in 2017 and 2018 investigated the internal morphology of desiccated organs, tissues and
cells in the same species. No reports have described the tun ultrastructure in Hypsibius exemplaris.
In the present study, we investigated the structure and ultrastructure of cells and organelles of anhydrobi-otic Hypsibius exemplaris specimens by electron microscopy and compared them to the ultrastructure of active hydrated specimens. To characterize the process in greater detail, we enlarged our study to individuals rehydrated for 5 and 24 hours.
Results
Comparison of hydrated and anhydrobiotic Hypsibius exemplaris.
Cell compaction. To comparethe cell shapes and ultrastructures of anhydrobiotic and hydrated tardigrades, we dehydrated Hypsibius
exem-plaris for 6 days. The contraction of the body in the tun was observed by confocal microscopy with differential
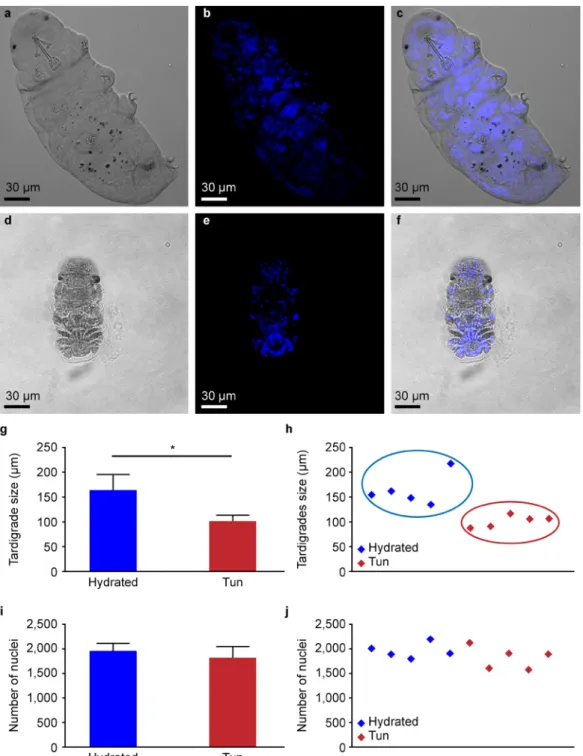
interference contrast (DIC) (Fig. 1a–f), revealing that hydrated tardigrades measured 164 +/− 32 µm, while tuns measured 101 +/− 12 µm (Fig. 1g). To clarify whether the compaction of the whole individual in the tuns group corresponded to cell compaction and not to a decreased global number of cells, we counted the DAPI-stained nuclei in both hydrated and dehydrated tardigrades. Experiments were performed on five individuals for each condition, and the distributions of nuclei numbers and body size are presented in Fig. 1h,j. A clear separation of the two populations of individuals was observed (Fig. 1h). The comparison of nuclei numbers (Fig. 1j) in hydrated individuals and tuns showed that despite a statistically significant decrease in size of approximately 38.4% between hydrated tardigrades and tuns, the number of cells did not significantly change (Fig. 1i,j).
Cell structure and ultrastructure. To compare the tissues of tuns and hydrated tardigrades, we performed a
detailed transmission electron microscopy (TEM) analysis. Comparing the two types of individuals demonstrated that the cell compaction in tuns resulted in the presence of folds in the cuticle (Fig. 2b), which were not present in the hydrated tardigrades (Fig. 2a). Regarding the global structure of specific classically recognized cell types, the epidermal cells were comparable between the two groups, with an elongated morphology and numerous vesicles (Fig. 2a,b). Muscle cells in individuals of both physiological statuses possessed comparably long characteristic muscular fibers (Fig. 2c,d), while digestive cells exhibited the same microvillosity structures surrounding the gut (data not shown). On the other hand, tuns were shown to exhibit numerous secretory active cells, especially near muscle cells, with an abundant rough endoplasmic reticulum (Fig. 2f). These cells were rarely observed in hydrated individuals and contained substantially less abundant endoplasmic reticulum than tuns (Fig. 2e). Interestingly, the presence of these numerous secretory active cells correlated with the presence of a thick specific extracellular structure (SES) surrounding each cell in tun individuals (Fig. 3b,d). This structure was completely absent in hydrated tardigrade cells (Fig. 3a,c). Figure 2g presents an overview of a tun specimen at the same mag-nification as the hydrated individual for a better comparison of the global structure.
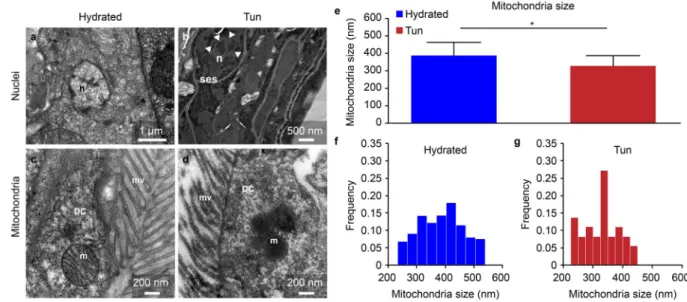
In tardigrades of both statuses, hydrated and tuns, we observed comparable global organelle structures. Nuclei with euchromatin and heterochromatin were present in both hydrated and dehydrated tardigrade groups (Figs. 3a,b, 4a,b), and numerous mitochondria were also observed in both groups. The global mitochondrial structures were comparable regardless of the cell type (Fig. 4c,d and Supplementary Fig. S1), and the mitochon-dria were not degraded. The only difference was that the mitochonmitochon-dria of dehydrated H. exemplaris showed a statistically significant size reduction of 15% (Fig. 4e). Figure 4f,g show the size distributions of the 241 and 46 mitochondria measured in hydrated tardigrades and tuns, respectively. In parallel, the cristae in tuns appeared to be shorter than those in hydrated animals (Supplementary Fig. S1).
Study of Hypsibius exemplaris during rehydration.
To better understand the protection process observed in anhydrobiotic conditions, we studied individuals dehydrated for 6 days and rehydrated for 5 or 24 hours.Tardigrades rehydrated for 5 hours. First, the animals in this condition were intermediate in size compared to
those of hydrated and dehydrated individuals (Fig. 5a,b versus Fig. 1a,d). In correlation with these reduced sizes of cells and individuals, the epidermal cells are detached from the cuticle (Fig. 5c). This space observed between the cuticle and the cells was more important than in dehydrated tardigrades which possess folds in the cuticle that reduce the space (Fig. 2b). The global structure of epidermal cells with numerous vesicles was maintained (Fig. 5c
versus Fig. 2a,b). Digestive cells also exhibited a classical structure comparable to that of both hydrated and dehy-drated individuals (data not shown). Muscular cells exhibited a classical structure with long contractile fibers (Fig. 5e). Autophagic vesicles were observed at this stage (Fig. 5g). Interestingly, the number of secretory cells was decreased by rehydration, which was closely correlated with the disappearance of the SES (Fig. 5i). This dis-appearance was not regular or homogeneous because after 5 hours of rehydration, the thickness of the structure varied according to the cells. For some cells, the structure surrounding the cell was no longer detectable. Among
www.nature.com/scientificreports
www.nature.com/scientificreports/
organelles, the nuclei were comparable to those of hydrated tardigrades and tuns, and the size of the mitochondria was intermediate (Fig. 6). This observation was confirmed by statistical analysis (Table 1).
Tardigrades rehydrated for 24 hours. At 24 hours after rehydration, the size of the tardigrades was already
compa-rable to that of the hydrated tardigrades (Fig. 5b versus Fig. 1a). In agreement with this observation, epidermal cells were once again in close contact with the cuticle (Fig. 5d). Muscle cells exhibit classical long fibers like in other states (Fig. 5f versus 5e, 2c,d). Some autophagic vesicles were still present, but they contained less degraded material (Fig. 5h). We found no secretory cells in the five tested rehydrated individuals, which was in agreement with the total disappearance of the SES (Fig. 5j). Among organelles, the nuclei were comparable to those of hydrated tardigrades and tuns, and the mitochondria were larger than both the hydrated and tuns mitochondria (Fig. 6).
Figure 1. Comparison between hydrated and anhydrobiotic H. exemplaris: (a–f) Confocal microscopy images
with DIC and DAPI staining. (h–j) Distribution of body sizes and nucleus numbers. (g–i) Statistics on body sizes and nucleus numbers. (g) Error bars indicate the standard deviation, and the star indicates a significant difference (Kolmogorov-Smirnov test, p = 0.036; α = 0.05). (i) Error bars indicate the standard deviation.
Discussion
Tardigrades are able to survive a wide variety of stresses, including desiccation. Understanding how they survive such extreme conditions is an important biological issue. Very few studies on this topic have been conducted, especially on Hypsibius exemplaris. Our results show that after six days of desiccation, the global structure and ultrastructure of the tissues are not greatly affected by the massive loss of water. This result is surprising given the importance of water for the structure of biological molecules and the amazing amount of water in normal cells. Not surprisingly, this loss of water results in a decrease of almost 40% in the size of individuals with accumulation
Figure 2. Ultrastructure of epidermal cells, muscle cells and secretory cells of H. exemplaris under both
statuses: hydrated and tun. cut: cuticle, EC: epidermal cell, er: endoplasmic reticulum, MC: muscle cell, SC: secretory cell, v- vesicle.
www.nature.com/scientificreports
www.nature.com/scientificreports/
of folds in the cuticle. This morphology is called tun. This size reduction corresponds to a reduction in the size of each of cell and not to a decrease in the number of cells. The water thus passes from the intracellular medium to the extracellular medium, possibly changing the intracellular salt concentrations. Nonetheless, most cells do not change their structure. Epidermal cells, digestive cells and muscle cells, three easily recognizable cell types, are comparable in the presence or absence of water. Note that the appearance of vesicles in epidermal cells as either electron-dense or electron-transparent was already described by Czernekova et al.35 in 2017. This phenomenon is
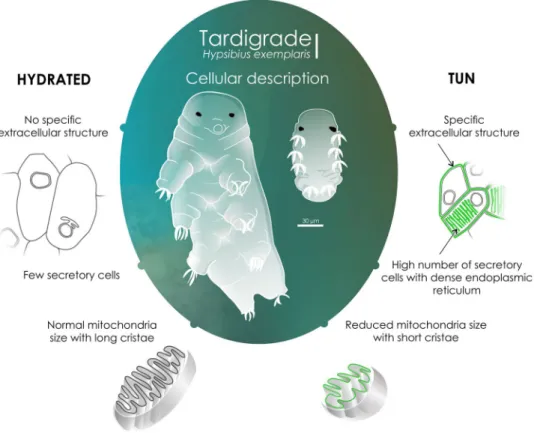
explained by the fact that lipids are partly removed during fixation in some cases (independently to the hydration state). The differences that we observed are at the level of the numerous secretory cells that appear throughout the body in the tun (Fig. 7). These cells contain a very dense rough endoplasmic reticulum network, suggesting the existence of numerous secreted proteins in the tun that are not present in hydrated individuals. Interestingly, it was shown that tardigrades use specific IDPs (TDPs) to survive desiccation37. According to this study, TDP genes
are constitutively expressed at high levels or induced during dehydration in many tardigrade species, including
H. exemplaris. TDP expression levels are correlated directly with preconditioning (slow drying). Indeed, species
requiring substantial preconditioning, such as H. exemplaris and Paramacrobiotus richtersi, exhibit upregulation of many TDPs induced by desiccation, while tardigrades that require little preconditioning, such as M.
tardi-gradum, present constitutively high levels of TDPs. Among these TDPs, some are secreted and therefore produced
by the rough endoplasmic reticulum, which is consistent with our results.
In parallel, we observed a thick SES (100 nm (+/−10)) surrounding all of the anhydrobiotic cells. It is possible that this extracellular structure results from the accumulation of anhydrobiotic-specific material such as TDPs, which are reported to form protective noncrystalline amorphous solids even in heterologous expression systems. Interestingly, the presence of this extracellular structure varied according to the rate of hydration since individu-als rehydrated for 5 hours had an intermediate amount of this specific structure. These correlations were strong, as the number of secretory cells and the amount of rough endoplasmic reticulum they contained also decreased after 5 hours of rehydration. Twenty-four hours after rehydration, we did not observe any secretory cells, and the SES had completely disappeared in parallel to the increased cell and organism size. This result suggests that 24 hours of rehydration is sufficient for H. exemplaris to recover its physiological state. Note that some rare secretory cells might have remained, like in hydrated individuals, but we found none despite examining numerous sections due to the low numbers of occurrence. This return to the initial state upon hydration is in agreement with studies
Figure 3. Comparison of extracellular structure between hydrated and anhydrobiotic H. exemplaris. cm: cell
showing that disordered protein reorganization (formation of hydrogels, aggregation or vitrification) with stress is reversible (for review, see Chavali et al.38).
We have previously shown that the survival rate after dehydration is not 100% but rather close to 40%39. In
agreement with this observation, some of the tuns we studied (not included in the five individuals selected for the study of tuns) lost their classical cellular structure. We think that these individuals corresponded to those who would never have woken up.
The last difference observed between hydrated and tun individuals was their mitochondria. Although their overall structures appeared quite normal, the mitochondria in tuns were smaller than those in hydrated indi-viduals. This difference can be explained by the fact that mitochondria are dynamic and motile organelles that can fuse or split in physiological or toxic conditions40–42. The mitochondrial sizes are intimately linked to their
activity and current surroundings. Moreover, compared to those in hydrated tardigrades, the mitochondria in tuns seemed to have shorter cristae, which were more difficult to discern with TEM. Because oxidative phospho-rylation occurs mostly in the deeply invaginated cristae of the inner mitochondrial membrane43–45, we postulate
that this decreased cristae size reflects the fact that the metabolism in tuns is minimal with limited breathing. In this way, the resumption of respiration with rehydration is accompanied by an increase in the mitochondrial size (visible after 5 hours rehydration). This increase must correspond to a gradual acceleration of metabolism, which
Figure 4. Comparison of nuclei and mitochondria between hydrated and anhydrobiotic H. exemplaris. (a–d)
Transmission electron microscopy images. DC: digestive cell, m: mitochondria, mv: microvilli, n: nucleus, ses: specific extracellular structure. Arrowheads delimit the nuclear envelope. (e) Mean mitochondrial size. Error bars indicate the standard deviation, and the star indicates a significant difference (Student’s t-test, α = 0.05). Table 1 shows the complete statistical results. (f,g) Histogram of the mitochondrial size frequencies for hydrated tardigrades (F) and desiccated tardigrades (G).
Mean +/− SD Code Student’s t-test, α = 0.05 n=
Tun 327.94 +/− 58.72 A p = 0.006 (B) 38
p < 0.0001 (C) p < 0.0001 (D) Rehydrated for 5 h 359.87 +/− 59.71 B p = 0.006 (A) 89
p < 0.0001 (C) p = 0.003 (D) Rehydrated for 24 h 413.67 +/− 77.65 C p < 0.0001 (A) 89
p < 0.0001 (B) p < 0.0001 (D)
Hydrated 387.52 +/− 76.60 D p < 0.0001 (A) 193
p = 0.003 (B) p < 0.0001 (C)
Table 1. Statistical results describing the mitochondrial sizes in the four different types of H. exemplaris: tun
specimens (A), specimens after 5 hours of rehydration (B), specimens after 24 hours of rehydration (C) and hydrated specimens (D).
www.nature.com/scientificreports
www.nature.com/scientificreports/
could be made possible via autophagy. Indeed, we observed many autophagic vesicles in individuals at the begin-ning of the rehydration process. Even if we imagine that tardigrades protect themselves from the negative effects of oxidative phosphorylation by reducing their mitochondrial cristae, the simplest explanation is that autophagy, which is a highly conserved physiological process, allows tardigrades to resist nutritional starvation46,47. Since
tardigrades do not eat when they are dehydrated, this process must provide the energy necessary for awakening and restoration of all biological processes, including muscle contraction. Moreover, autophagy allows the renewal
Figure 5. Description of H. exemplaris after 5 or 24 hours of rehydration. (a,b) Confocal microscopy images
with DIC. (c,d) Ultrastructure of epidermal cells. (e,f) Ultrastructure of muscle cells. (g,h) Autophagic vacuole. (i,j) Specific extracellular structure. av: autophagic vacuole, cut: cuticle, EC: epidermal cell, es: extracellular space, MC: muscle cell, ses: specific extracellular structure. arrow: double membrane.
of proteins and organelles damaged by stress conditions48. Individuals could therefore benefit from the renewal of
molecules damaged by dehydration to recover energy.
We can conclude from our study that we observe the establishment of a rampart-like shaped extracellular structure in the tun that has never previously been described. Better characterizing this structure, which may contain TDPs produced by specific secretory cells, would be interesting to test its efficiency for heterologous expression systems.
Figure 6. Mean mitochondrial sizes for four different types of H. exemplaris: tun specimens, specimens after
5 hours of rehydration, specimens after 24 hours of rehydration and hydrated specimens. Error bars indicate the standard error of the mean. <*> indicates a significant difference with p < 0.01 (Student’s t-test, α = 0.05). <***> indicates a significant difference with p < 0.0001 (Student’s t-test, α = 0.05). See Table 1 for the complete statistical results.
Figure 7. Cellular global description of H. exemplaris in tun and hydrated individuals. We thank Laurence
Meslin from the platform “Communication Scientifique Visuelle” (ISEM, Montpellier, France) for the design of this figure.
www.nature.com/scientificreports
www.nature.com/scientificreports/
Methods
Materials.
In this study, we used H. exemplaris tardigrades (Sciento strain Z151), formerly known as H.dujardini49. This species resists dehydration and was the first to be sequenced50–52. Tardigrades were fed with
the unicellular algae Chlorococcum sp. Both tardigrades and algae were purchased from Sciento Company (Manchester, UK). H. exemplaris were cultured in Petri dishes filled with Chalkley’s medium at 15 °C as previ-ously described53,54.
Desiccation protocol.
To compare cell shape organization and ultrastructures between hydrated and anhy-drobiotic H. exemplaris, tardigrade desiccation was performed. The desiccation protocol for adult tardigrades randomly selected from cultures was adapted from Hengherr et al.22. To facilitate later handling of thetardi-grades, 20 specimens in a drop of water were placed on coverslips, which were then incubated at 25 °C in a sealed preconditioning box with 85% relative hygrometry (RH) for 16 hours with a saturated solution of KCl. The covers-lips were then placed in a sealed box at 33% RH for 48 hours with an MgCl2-saturated solution. RH was controlled
using a hygrometer. Full dehydration of the specimens was monitored by direct observation under a stereomicro-scope. The anhydrobiotes were stored at the RH and temperature of the room for six days before analysis.
Rehydration protocol.
To rehydrate desiccated Hypsibius exemplaris after six days of dehydration, water droplets were added to the coverslips. Tardigrades were maintained in the medium at 15 °C and prepared for TEM after 5 and 24 hours in contact with liquid.transmission electron microscopy.
Samples were fixed in a solution of 2.5% glutaraldehyde in PHEM buffer (1×, pH 7.4) overnight at 4 °C. They were then rinsed in PHEM buffer and postfixed in 0.5% osmic acid for 2 hours in the dark at room temperature. After two rinses in PHEM buffer, the samples were dehydrated in a graded series of ethanol solutions (30–100%) and embedded in EmBed 812 using an automated microwave tissue processor for electronic microscopy (Leica EM AMW). Ultrathin sections (70 nm; Leica-Reichert Ultracut E) were collected at different levels of each block. These sections were counterstained with 1.5% uranyl acetate in 70% ethanol and lead citrate and observed using a Tecnai F20 transmission electron microscope at 200 kV at the CoMET MRI facilities (INM, Montpellier, France). For TEM, five tardigrades were analysed for each condition: tun, rehydrated for 5 hours, rehydrated for 24 hours and hydrated.tardigrade size.
We measured the sizes of hydrated and tun tardigrades. Animals were measured from the tip of the head to the extreme end of the body. Measurements from DIC images obtained using a Leica SPE con-focal microscope at the DBS-Optique MRI facilities (Montpellier, France) were determined with ImageJ software. For each condition, five specimens were measured.number of nuclei.
We counted the number of nuclei in hydrated and tuned animals. Counts from DAPI z-stack stained images obtained using a Leica SPE confocal microscope at the DBS-Optique MRI facilities (Montpellier, France) were performed with ImageJ software. For each condition, the number of nuclei was counted in five tardigrades.Mitochondrial size.
We measured the mitochondrial sizes in four conditions: hydrated animals, dehydrated animals, animals after 5 hours of rehydration and animals after 24 hours of rehydration. Measurements were per-formed with ImageJ software.Between 46 and 241 mitochondrial size measurements were made for each condition as follows:
Statistical analysis.
We used XLSTAT software (Addinsoft, New York, NY, USA) to compare mitochondrial sizes among animals that were hydrated, rehydrated for 5 hours, rehydrated for 24 hours and dehydrated and to compare the body sizes and numbers of nuclei between hydrated and dehydrated animals.Data availability
The datasets generated during the current study are available from the corresponding author upon reasonable request.
Received: 13 August 2019; Accepted: 18 February 2020; Published: xx xx xxxx
References
1. Crowe, J. The physiology of cryptobiosis in Tardigrades. Mem. Ist. Ital. Idrobiol. 32, 37–59 (1975).
2. Jönsson, K. I. The nature of selection on anhydrobiotic capacity in Tardigrades. Zool. Anz. J. Comp. Zool. 240, 409–417 (2001). 3. Watanabe, M. Anhydrobiosis in invertebrates. Appl. Entomol. Zool. 41, 15–31 (2006).
4. Crowe, J. H. Anhydrobiosis: an unsolved problem. Am. Nat. 105, 563–573 (1971). 5. Bertolani, R. et al. Experiences with dormancy in Tardigrades. J. Limnol. 63, 16–25 (2004).
6. Keilin, D. The problem of anabiosis or latent life: history and current concept. Proc. R. Soc. Lond. B Biol. Sci. 150, 149–191 (1959). 7. Rebecchi, L., Altiero, T. & Guidetti, R. Anhydrobiosis: the extreme limit of desiccation tolerance. Invertebr. Surviv. J. 4, 65–81 (2007).
Condition Number of measurements
Tun 46
Rehydrated for 5 hours 109
Rehydrated for 24 hours 109
8. Kikawada, T., Minakawa, N., Watanabe, M. & Okuda, T. Factors inducing successful anhydrobiosis in the African chironomid
Polypedilum vanderplanki: significance of the larval tubular nest. Integr. Comp. Biol. 45, 710–714 (2005).
9. Wharton, D. A. & Lemmon, J. Ultrastructural changes during desiccation of the anhydrobiotic nematode Ditylenchus dipsaci. Tissue
Cell 30, 312–323 (1998).
10. Baumann, H. Die anabiose der tardigraden. Zool. Jahrb. Abt. Syst. 45, 501–556 (1922).
11. Kinchin, I. M. The biology of tardigrades. xi, 186p. London: Portland Press. J. Mar. Biol. Assoc. U. K. 75, 262 (1994).
12. Marotta, R., Leasi, F., Uggetti, A., Ricci, C. & Melone, G. Dry and survive: morphological changes during anhydrobiosis in a bdelloid rotifer. J. Struct. Biol. 171, 11–17 (2010).
13. Hincha, D. K. & Thalhammer, A. LEA proteins: IDPs with versatile functions in cellular dehydration tolerance. Biochem. Soc. Trans.
40, 1000–1003 (2012).
14. Hoekstra, F. A., Golovina, E. A. & Buitink, J. Mechanisms of plant desiccation tolerance. Trends Plant Sci. 6, 431–438 (2001). 15. Sun, X., Rikkerink, E. H., Jones, W. T. & Uversky, V. N. Multifarious roles of intrinsic disorder in proteins illustrate its broad impact
on plant biology. Plant Cell 25, 38–55 (2013).
16. Erkut, C. et al. Trehalose renders the dauer larva of Caenorhabditis elegans resistant to extreme desiccation. Curr. Biol. 21, 1331–1336 (2011).
17. Sakurai, M. et al. Vitrification is essential for anhydrobiosis in an African chironomid, Polypedilum vanderplanki. Proc. Natl. Acad.
Sci. USA 105, 5093–5098 (2008).
18. Tapia, H. & Koshland, D. E. Trehalose is a versatile and long-lived chaperone for desiccation tolerance. Curr. Biol. 24, 2758–2766 (2014).
19. Lapinski, J. & Tunnacliffe, A. Anhydrobiosis without trehalose in bdelloid rotifers. FEBS Lett. 553, 387–390 (2003).
20. Cesari, M., Altiero, T. & Rebecchi, L. Identification of the trehalose-6-phosphate synthase (tps) gene in desiccation tolerant and intolerant tardigrades. Ital. J. Zool. 79, 530–540 (2012).
21. Guidetti, R., Altiero, T. & Rebecchi, L. On dormancy strategies in Tardigrades. J. Insect. Physiol. 57, 567–576 (2011).
22. Hengherr, S., Heyer, A. G., Kohler, H. R. & Schill, R. O. Trehalose and anhydrobiosis in Tardigrades–evidence for divergence in responses to dehydration. FEBS J. 275, 281–288 (2008).
23. Jönsson, K. & Persson, O. Trehalose in three species of desiccation tolerant Tardigrades. Open Zool. J. 3, 1–5 (2010).
24. Westh, P. & Ramløv, H. Trehalose accumulation in the tardigrade Adorybiotus coronifer during anhydrobiosis. J. Exp. Zool. 258, 303–311 (1991).
25. Bird, A. F. & Buttrose, M. S. Ultrastructural changes in the nematode Anguina tritici associated with anhydrobiosis. J. Ultrastruct.
Res. 48, 177–189 (1974).
26. Dickson, M. & Mercer, E. Fine structural changes accompanying desiccation in Philodina roseola (Rotifera). J. Microsc. 6, 331–348 (1967).
27. Morris, J. E. Dehydrated cysts of Artemia salina prepared for electron microscopy by totally anhydrous techniques. J. Ultrastruct.
Res. 25, 64–72 (1968).
28. Baccetti, B. & Rosati, F. Electron microscopy on Tardigrades. I. Connective tissue. J. Submicr. Cytol. 1, 197–205 (1969). 29. Baccetti, B. & Rosati, F. Electron microscopy on Tardigrades. 3. The integument. J. Ultrastruct. Res. 34, 214–243 (1971).
30. Crowe, J., Newell, I. & Thomson, W. Cuticle formation in the tardigrade, Macrobiotus areolatus Murray. J. Microsc. 11, 121–132 (1971).
31. Guidetti, R., Rebecchi, L. & Bertolani, R. Cuticle structure and systematics of the Macrobiotidae (Tardigrada, Eutardigrada). Acta
Zool. 81, 27–36 (2000).
32. Walz, B. The morphology of cells and cell organelles in the anhydrobiotic tardigrade, Macrobiotus hufelandi. Protoplasma 99, 19–30 (1979).
33. Walz, B. Molting in Tardigrada. A review including new results on cuticle formation in Macrobiotus hufelandi in Proceedings of the
third international symposium on the Tardigrada, August 3–6, 1980, Johnson City, Tennessee (ed. Nelson, D. R.) 129–147 (East
Tennessee State University Press, 1982).
34. Halberg, K. A., Jorgensen, A. & Mobjerg, N. Desiccation tolerance in the Tardigrade Richtersius coronifer relies on muscle mediated structural reorganization. PLoS One 8, e85091 (2013).
35. Czernekova, M., Jonsson, K. I., Chajec, L., Student, S. & Poprawa, I. The structure of the desiccated Richtersius coronifer (Richters, 1903). Protoplasma 254, 1367–1377 (2017).
36. Czernekova, M., Janelt, K., Student, S., Jonsson, K. I. & Poprawa, I. A comparative ultrastructure study of storage cells in the eutardigrade Richtersius coronifer in the hydrated state and after desiccation and heating stress. PLoS One 13, e0201430 (2018). 37. Boothby, T. C. et al. Tardigrades use intrinsically disordered proteins to survive desiccation. Mol. Cell 65, 975–984.e975 (2017). 38. Chavali, S., Gunnarsson, A. & Babu, M. M. Intrinsically disordered proteins adaptively reorganize cellular matter during stress.
Trends Biochem. Sci. 42, 410–412 (2017).
39. Kuzmic, M., Richaud, M., Cuq, P., Frelon, S. & Galas, S. Carbonylation accumulation of the Hypsibius exemplaris anhydrobiote reveals age-associated marks. PLoS One 13, e0208617 (2018).
40. Bereiter-Hahn, J. & Voth, M. Dynamics of mitochondria in living cells: shape changes, dislocations, fusion, and fission of mitochondria. Microsc. Res. Tech. 27, 198–219 (1994).
41. Karbowski, M. & Youle, R. J. Dynamics of mitochondrial morphology in healthy cells and during apoptosis. Cell Death Differ. 10, 870–880 (2003).
42. Liesa, M. & Shirihai, O. S. Mitochondrial dynamics in the regulation of nutrient utilization and energy expenditure. Cell Metab. 17, 491–506 (2013).
43. Gilkerson, R. W., Selker, J. M. & Capaldi, R. A. The cristal membrane of mitochondria is the principal site of oxidative phosphorylation. FEBS Lett. 546, 355–358 (2003).
44. Vogel, F., Bornhovd, C., Neupert, W. & Reichert, A. S. Dynamic subcompartmentalization of the mitochondrial inner membrane. J.
Cell Biol. 175, 237–247 (2006).
45. Cogliati, S. et al. Mitochondrial cristae shape determines respiratory chain supercomplexes assembly and respiratory efficiency. Cell
155, 160–171 (2013).
46. Scott, R. C., Schuldiner, O. & Neufeld, T. P. Role and regulation of starvation-induced autophagy in the Drosophila fat body. Dev. Cell
7, 167–178 (2004).
47. Li, L., Chen, Y. & Gibson, S. B. Starvation-induced autophagy is regulated by mitochondrial reactive oxygen species leading to AMPK activation. Cell Signal 25, 50–65 (2013).
48. Ravanan, P., Srikumar, I. F. & Talwar, P. Autophagy: the spotlight for cellular stress responses. Life Sci. 188, 53–67 (2017). 49. Gasiorek, P., Stec, D., Morek, W. & Michalczyk, L. An integrative redescription of Hypsibius dujardini (Doyere, 1840), the nominal
taxon for Hypsibioidea (Tardigrada: Eutardigrada). Zootaxa 4415, 45–75 (2018).
50. Arakawa, K., Yoshida, Y. & Tomita, M. Genome sequencing of a single Tardigrade Hypsibius dujardini individual. Sci. Data 3, 160063 (2016).
51. Boothby, T. C. et al. Evidence for extensive horizontal gene transfer from the draft genome of a tardigrade. Proc. Natl. Acad. Sci. USA
112, 15976–15981 (2015).
52. Koutsovoulos, G. et al. No evidence for extensive horizontal gene transfer in the genome of the Tardigrade Hypsibius dujardini. Proc.
www.nature.com/scientificreports
www.nature.com/scientificreports/
53. Gabriel, W. N. et al. The tardigrade Hypsibius dujardini, a new model for studying the evolution of development. Dev. Biol. 312, 545–559 (2007).
54. McNuff, R. Laboratory culture of Hypsibius exemplaris. Cold Spring Harb. Protoc. 2018, pdb.prot102319 (2018).
Acknowledgements
The present study was supported by the CNRS “Défi Origines 2018” – Project GigaTardi (grant no. 265880 – Giga18). We thank the Montpellier RIO Imaging platform (confocal microscopy) (Montpellier, France). We are grateful to Pr. Emma Perry from Unity College (Unity, Maine, USA) for their help in the Hypsibius exemplaris specie identification confirmation used in this work.
Author contributions
Acquisition of data: M.R., E.L.G., C.C., S.B., N.G. and S.G., Analysis of data: M.R., E.L.G., S.B., N.G. and S.G., Interpretation of data: M.R., E.L.G., S.B., N.G. and S.G., S.G. set research strategy. M.R., E.L.G. and N.G. wrote the main manuscript text, and M.R., E.L.G., S.B., N.G. and S.G. prepared the figures and table. M.R., E.L.G., C.C., F.O., Y.M., N.L.S., P.C., S.B., N.G. and S.G. reviewed the manuscript.
competing interests
The authors declare no competing interests.
Additional information
Supplementary information is available for this paper at https://doi.org/10.1038/s41598-020-61165-1.
Correspondence and requests for materials should be addressed to M.R. Reprints and permissions information is available at www.nature.com/reprints.
Publisher’s note Springer Nature remains neutral with regard to jurisdictional claims in published maps and
institutional affiliations.
Open Access This article is licensed under a Creative Commons Attribution 4.0 International
License, which permits use, sharing, adaptation, distribution and reproduction in any medium or format, as long as you give appropriate credit to the original author(s) and the source, provide a link to the Cre-ative Commons license, and indicate if changes were made. The images or other third party material in this article are included in the article’s Creative Commons license, unless indicated otherwise in a credit line to the material. If material is not included in the article’s Creative Commons license and your intended use is not per-mitted by statutory regulation or exceeds the perper-mitted use, you will need to obtain permission directly from the copyright holder. To view a copy of this license, visit http://creativecommons.org/licenses/by/4.0/.