DENSITY AND RECHARGE EFFECTS DURING THE CAPE COD NATURAL-GRADIENT TRACER TEST
by
Denis R. LeBlanc B.S., Hydrology
University of New Hampshire
Submitted to the Department of Civil and Environmental Engineering in Partial Fulfillment of the Requirements for the Degree of Master of Science in Civil and Environmental Engineering
at the MASSACHUSETTS OF TECHNOLOGYINSTITUTE Massachusetts Institute of Technology
JUN
04 2001
June 2001 LIBRARIES
@ 2001 Denis R. LeBlanc All rights reserved BARKER The author hereby grants to MIT permission to reproduce and to distribute publicly
paper and electronic copies of this thesis document in whole or in part.
Signature of the Author:
Certified by:
Certified by:
Department of Civil and Environmental Engineering
A - May 11, 2001
V1
Michael A. CeliaProfessor of Civil and Environmental Engineering, Princeton University
Thesis Co-Supervisor
Charles F. Harvey Assistant Professor o Civil and Environmental Engineering Thesis Supervisor
DENSITY AND RECHARGE EFFECTS DURING THE CAPE COD NATURAL-GRADIENT TRACER TEST
by
Denis R. LeBlanc
Submitted to the Department of Civil and Environmental Engineering on May 11, 2001
in Partial Fulfillment of the Requirements for the Degree of Master of Science
in Civil and Environmental Engineering
ABSTRACT
Analytical and numerical modeling was used to show that a density difference of 0.1 percent between the ambient ground water and the tracer solution caused part of the downward movement of the tracer cloud during the 1985-88 Cape Cod natural-gradient tracer test. The modeling also showed that recharge from precipitation caused part of the downward movement.
The center of mass of the observed bromide tracer cloud moved downward about 3.2 m and laterally about 100 m during the first 237 days of the test. Analytical models over-predicted the amount of downward movement as compared to the observed movement because the models do not consider the dilution and spreading of the tracer cloud caused by dispersion. A numerical simulation of the field-scale experiment predicted only 2.2 m of downward movement during the 237-day period. Density-induced sinking caused about 1 m of the simulated downward
movement, most of which took place during the first 38 days, when the density difference was greatest. The remainder of the downward movement was caused by the accretion of recharge water above the sinking tracer cloud. The under-prediction by the numerical model may be due partly to the use of a two-dimensional model to simulate the three-dimensional flow around the sinking tracer cloud. The under-prediction may also be due partly to the representation of the water table as a no-flow boundary in the numerical simulations and to an underestimate of the amount of recharge during the test period.
Analytical and numerical modeling was used to show that the amount of downward movement caused by density differences is particularly sensitive to the shape and orientation of the initial tracer cloud. Density-induced sinking is also significantly reduced as the dispersivity and the anisotropy of the permeability increase. Accurate simulation of the Cape Cod tracer test required the used of an increasing dispersivity with travel distance, as was observed during the
ACKNOWLEDGMENTS
This thesis would not have been possible without the unfailing support of Mike Celia. I will forever be grateful to him for his patience, advice, and extraordinary instruction. The support of Lynn Gelhar, who was the inspiration for the Cape Cod tracer test, was also invaluable.
The generous assistance of a Parsons Graduate Fellowship and the U.S. Geological Survey Graduate School Program made it possible for me to attend MIT and pursue this degree.
The support of the Toxic Substances Hydrology Program of the U.S. Geological Survey is also gratefully acknowledged. The program gave us the funding and intellectual freedom to pursue our ideas and take the risks that underlie many successful scientific endeavors.
A particular thanks is due to my exceptional colleagues at the U.S. Geological Survey. Steve Garabedian, Kathy Hess, and Chip Quadri were true partners and friends as we worked as a team to carry out the field experiment. Without their help, this world-renowned tracer test never could have happened.
Finally, none of this would have been possible without the support of Denise, Jeff, Jocelyn, and Sarah. They encouraged me during those first weeks of despair when the coursework seemed impossible, and they never complained about the dozens of ovemights I spent on the Cape during the field test. This achievement is truly theirs as much as it is mine.
Denis LeBlanc May 2001
Density and Recharge during the Cape Cod Tracer Test LeBlanc
TABLE OF CONTENTS
CHAPTER 1 INTRODUCTION ... 21
Field and Laboratory Studies of Vertical M ovem ent...22
Analytical and Num erical M odels ... 30
Purpose and Scope ... 36
CHAPTER 2 CAPE COD NATURAL-GRADIENT TRACER TEST ... 39
Site Description and Aquifer Characteristics... 39
Hydrogeologic Characteristics... 41
Hydrologic Characteristics... 41
Tracer-Test Design...44
Tracer Characteristics ... 45
Injection of the Tracers ... 45
M onitoring of the Tracer Cloud... 46
Observed Tracer M ovem ent... 47
Horizontal M ovem ent ... 47
Vertical M ovem ent ... 47
Spatial M om ents of the Brom ide Distribution... 51
Total M ass and Position of the Center of M ass... 51
Variance and Dispersivity... 52
Hydraulic Conductivity and Estim ated M acrodispersivity...53
CHAPTER 3 ANALYTICAL MODELS OF DENSITY-INDUCED DOWNWARD M OVEM ENT ... 55
Density and Recharge during the Cape Cod Tracer Test LeBlanc
Direction of M ovem ent of Tracer Cloud ... 60
Application of Hubbert M odel to Cape Cod Tracer Test... 61
Yih (1963) M odels...64
Description of Yih Analytical M odels... 64
Three-Dim ensional Sphere ... 66
Three-Dim ensional Infinitely Long Circular Cylinder... 67
Three-Dim ensional Infinitely Long Elliptical Cylinder ... 69
Factors Affecting Rate of Downward M ovement... 71
Dim ensionality...71
Shape and Orientation of the Fluid Body ... 72
V isco sity ... 74
Application of Yih M odel to the Cape Cod Tracer Test... 76
D isp ersio n ... 7 9 Yih (1963) M odels W ith Estim ated Density Decrease... 80
Gelhar (1983) M odel... 84
D iscu ssio n ... 9 1 CHAPTER 4 NUMERICAL SIMULATION TO DETERMINE FACTORS AFFECTING DOW NW ARD M OVEM ENT OF TRACER CLOUD ... 97
Description of the Num erical M odel... 97
Spatial M om ents of Solute M ass Fraction...103
Design of Simulations...105
Grid Design...105
Density and Recharge during the Cape Cod Tracer Test LeBlanc
Aquifer and Fluid Properties...110
Source Configuration...114
Sim ulation Approach ... 116
Sim ulation Procedure...116
Tem poral Discretization...117
Num erical Oscillations...118
Pattern of Flow around Sinking Tracer Cloud...125
Factors Affecting Density-Induced Downward M ovem ent...128
Hydrologic Factors...130
Density ... 130
Longitudinal Dispersivity ... 131
Anisotropy of Perm eability...133
Areal Recharge...135
Source Size...139
Source Aspect Ratio ... 141
Source Length...142
M odel-Design Factors...145
Distance to Top Boundary ... 145
Type of Top Boundary ... 147
Distance to Left Boundary ... 150
Type of Left Boundary ... 151
Distance to Bottom Boundary ... 152
Density and Recharge during the Cape Cod Tracer Test LeBlanc
CHAPTER 5 NUMERICAL SIMULATION OF THE CAPE COD TRACER TEST...161
Design of the Sim ulations...161
M odeled Area ... 162
Height of the M odeled Area...163
Length of M odeled Area...165
Boundary Conditions ... 166
Source Configuration...168
A quifer Properties...169
Anisotropy of Perm eability...169
Longitudinal Dispersivity ... 169
Spatial and Tem poral Discretization...172
Vertical Discretization...173
Horizontal and Tem poral D iscretization...173
Areal Recharge...183
Daily Potential Evapotranspiration...184
Daily Precipitation and Recharge ... 185
Sim ulated Recharge ... 188
Sim ulation Approach ... 189
Sim ulation Procedure...189
Iterative Solution...192
Principal Com ponents of the Variance Tensor...194
Density Calculation...195
Density and Recharge during the Cape Cod Tracer Test LeBlanc
Shape and Path of the Sim ulated Tracer Cloud ... 196
Solute M ass ... 199
H orizontal M ovem ent ... 200
V ertical M ovem ent ... 201
V ariance and D ispersivity...204
D iscussion...209
CH A PTER 6 D ISCU SSION ... 217
H eterogeneity and A nisotropy ... 218
D ispersion ... 221
Recharge ... 223
The W ater Table...225
Internal Flow w ithin the Tracer Cloud...226
Injection of the Tracer Cloud...226
Reactive Tracers...228
CH A PTER 7 SU M M A RY ... 231
REFEREN CES ... 241
FIGURES Figure 2-1. Location of the study area, showing the sewage plume and the tracer-test site...40
Figure 2-2. Tracer-test site, showing area of abandoned gravel pit, the water table, and the predicted and observed path of the brom ide tracer cloud... 42
Density and Recharge during the Cape Cod Tracer Test
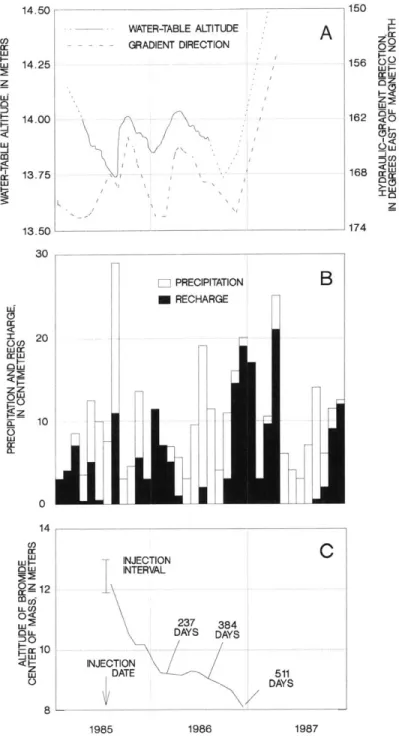
Figure 2-3. Graphs showing (A) altitude of the water table and direction of the hydraulic gradient, (B) monthly estimated recharge and precipitation, and (C) vertical position of the center of mass of the bromide cloud during 1985-1987 ... 43 Figure 2-4. Areal distribution of maximum concentrations of bromide, lithium, and
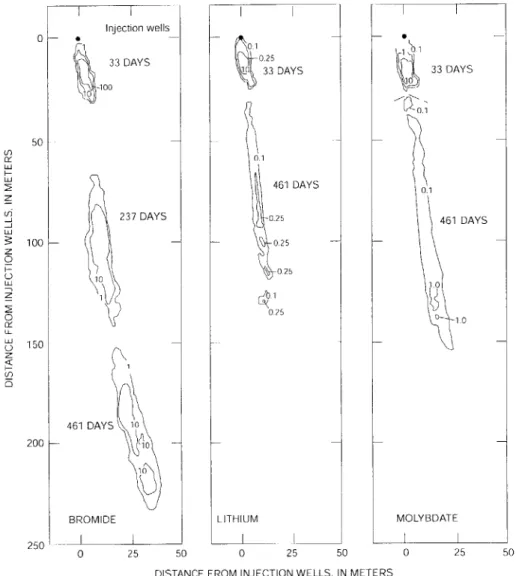
molybdate at 33, 237, and 461 days after injection ... 48 Figure 2-5. Vertical location of the bromide tracer cloud at 33, 237, and 461 days after
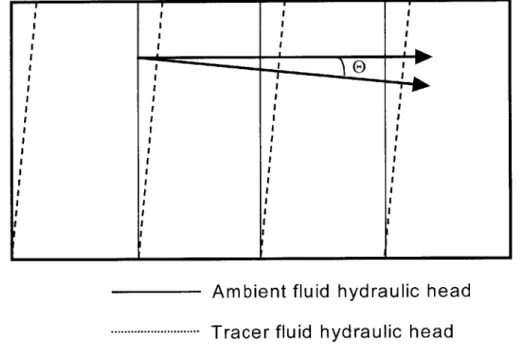
injectio n ... 4 9 Figure 3-1. Hydraulic-head distribution for the ambient fluid and a denser tracer solution in
the simple case where the ambient flow is horizontal... 57 Figure 3-2. Vector diagram with energy force vectors for the ambient fluid and the denser
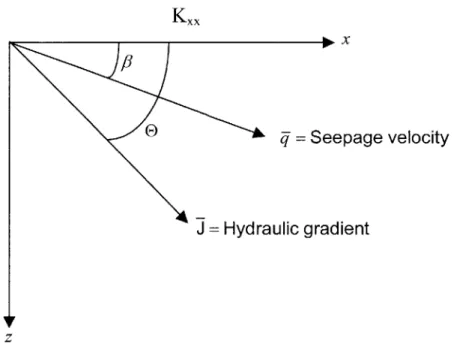
tracer so lu tion ... 59 Figure 3-3. Relationship of the direction of the negative hydraulic gradient to the direction of
flow for an anisotropic porous m edium ... 61 Figure 3-4. Predicted angle of downward movement of tracer solution from the Hubbert
(1953) model as a function of density difference and anisotropy of hydraulic
con du ctiv ity ... 6 3 Figure 3-5. Spherical fluid body, coordinate system, and orientations of the ambient flow
direction and the gravitational force ... 67 Figure 3-6. Cylindrical fluid body with circular cross section, coordinate system, and
orientations of the ambient flow direction and the gravitational force...68 Figure 3-7. Cylindrical fluid body with elliptical cross section, coordinate system, and
orientations of the ambient flow direction and the gravitational force...70
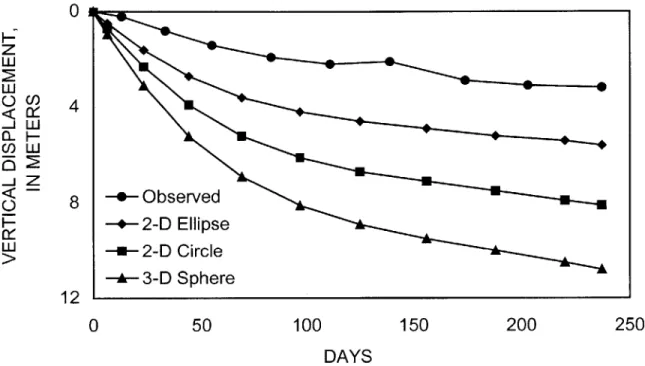
Figure 3-8. Comparison of the observed trajectory of the Cape Cod tracer cloud to
trajectories for a three-dimensional sphere and two-dimensional circular and elliptical tracer bodies calculated using the Yih (1963) models and an estimated decrease in
density difference with travel time because of dispersion... 83 Figure 3-9. Predicted vertical displacement for two sizes of the initial tracer cloud using the
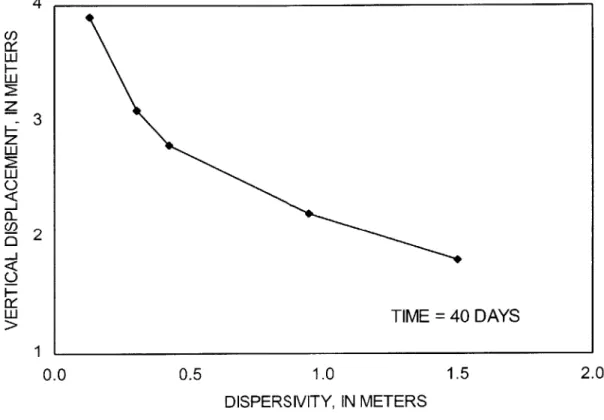
G elh ar m o d el...9 0 Figure 3-10. Predicted vertical displacement at 40 days as a function of dispersivity using
the Gelhar model for an initial tracer cloud of radius a = 1.7 m...91 Figure 3-11. Predicted vertical displacement at 40 days as a function of initial cloud radius
using the Gelhar model with a dispersivity a = 0.13 m...92 Figure 4-1. Modeled area, boundary conditions, and initial position of the tracer cloud for
the b aseline run, S3R 19 ... 105 Figure 4-2. Source configuration for the baseline run, S3R19...115 Figure 4-3. Longitudinal profiles of solute mass fraction through the center of the tracer
cloud at 1.25 days for runs S3R23B (aL = 0.0m), S3R42B (aL = 0.10 m), and S3R24B
(aL = 1.0 m )...12 0 Figure 4-4. Simulated tracer cloud at 1.25 days for run S3R23B...121 Figure 4-5. Second moment, or longitudinal variance, of the simulated tracer cloud with
travel time for runs S3R23B, S3R42B, and S3R24B ... 124 Figure 4-6. Simulated tracer cloud at 0, 5, and 10 days for run S2R4G...126 Figure 4-7. Vector plot of the ground-water velocity field at 5 days for run S2R4G...127
LeBlanc Density and Recharge during the CapCoTrcres
Density and Recharze during the Cape Cod Tracer Test
Figure 4-8. Vertical position of the center of mass of the simulated tracer cloud during a 5-day-long period for initial density differences of 0.5, 1.0, and 2.0 times the density difference of the baseline run...131 Figure 4-9. Vertical position of the center of mass of the simulated tracer cloud during a
5-day-long period for input longitudinal dispersivity values of 0.0, 0.05, 0.10, and 1.00 m....133 Figure 4-10. Vertical position of the center of mass of the simulated tracer cloud during a
5-day-long period for ratios of horizontal to vertical permeability of 1.0, 1.2, and 5.0...134 Figure 4-11. Vertical position of the center of mass of the simulated tracer cloud during a
5-day-long period with recharge to the top boundary of the model at rates of 0.0, 0.14,
3.55, and 14 .19 cm /d ... 138 Figure 4-12. Vertical position of the center of mass of the simulated tracer cloud during a
5-day-long period for initial clouds with total masses of about half and twice the mass of
the baseline run, but with sim ilar relative shapes ... 140 Figure 4-13. Vertical position of the center of mass of the simulated tracer cloud during a
5-day-long period for initial clouds with a total mass of about 2.25 solute mass fraction
units and aspect ratios (x-dimension divided by y-dimension) of 1.02, 1.78, and 4.00...142 Figure 4-14. Vertical position of the center of mass of the simulated tracer cloud during a
5-day-long period for initial clouds with a thickness (y-dimension) of 2.5 m and lengths (x-dim ension) of 2.4, 3.4, and 4.4 m ... 144 Figure 4-15. Vertical position of the center of mass of the simulated tracer cloud during a
5-day-long period for distances of 0.3, 0.6, 1.0, and 1.4 m from the top edge of the initial tracer cloud to the upper no-flow boundary of the model...146
Figure 4-16. Vertical position of the center of mass of the simulated tracer cloud during a 5-day-long period for no-flow and specified-pressure boundaries at the upper boundary of th e m o d eled area ... 14 8 Figure 4-17. Calculated fluid flux across the specified-pressure boundary along the upper
boundary of the modeled area at 0.25, 1.25, and 5 days after introduction of the tracer
c lo u d ... 14 9 Figure 4-18. Vertical position of the center of mass of the simulated tracer cloud during a
5-day-long period for distances of 1.4, 3.4, and 5.4 m from the left edge of the initial tracer cloud to the upstream (left) specified-pressure boundary...150 Figure 4-19. Vertical position of the center of mass of the simulated tracer cloud during a
5-day-long period for specified-flux and specified-pressure boundaries at the upstream (left) boundary of the m odeled area...152 Figure 4-20. Vertical position of the center of mass of the simulated tracer cloud during a 5-day-long period for distances of 4.7, 6.2, and 9.2 m from the bottom edge of the initial tracer cloud to the bottom, no-flow boundary of the modeled area...154 Figure 5-1. Modeled area for the field-scale simulation of the Cape Cod tracer test, including
boundary conditions and expected position of the tracer cloud at 0 and 237 days...165 Figure 5-2. Linear increase in longitudinal dispersivity with travel time and stepwise
approximation for the first 80 days of the Cape Cod tracer test...172 Figure 5-3. Schematic diagram of the tracer cloud at 25 and 35 days, and the factors that
were used in design of the horizontal and temporal discretization...175 Figure 5-4. Location of the observed trailing and leading edges and center of mass of the
tracer cloud during the first 237 days of the Cape Cod tracer test...176
LeBlanc Density and Recharge during the CapCoTrcres
Figure 5-5. Estimated monthly potential evapotranspiration (PET) for June 1985 through
M arch 19 8 6 ... 18 5 Figure 5-6. Estimated daily recharge and measured daily precipitation for the period from
July 1985 to M arch 1986 ... 187 Figure 5-7. Location of the simulated tracer cloud at 0.6, 64.4, and 237.1 days since the start
of the sim ulation period ... 197 Figure 5-8. Distributions of the simulated solute mass fraction at 0.6 and 64.4 days since the
start of the sim ulation period ... 198 Figure 5-9. Total mass of the simulated tracer cloud during the 237-day-long simulation of
the C ape C od tracer test...199 Figure 5-10. Horizontal location of the center of mass of the simulated tracer cloud during
the 237-day-long simulation of the Cape Cod tracer test...200 Figure 5-11. Vertical location of the center of mass of the simulated and observed tracer
clouds, and estimated daily recharge, during the 237-day-long simulation of the Cape
C od tracer test ... 2 02 Figure 5-12. Longitudinal variance of the simulated tracer concentrations during the 237-day
simulation of the Cape Cod tracer test...204 Figure 5-13. Estimated effective longitudinal dispersivity during the 237-day simulation of
the C ape C od tracer test...206 Figure 5-14. Transverse variance of the simulated tracer concentrations during the 237-day
simulation of the Cape Cod tracer test...207 Figure 5-15. Estimated effective transverse dispersivity during the 237-day simulation of the
C ape C od tracer test...208
LeBlanc
Density and Recharze durinz the Cape Cod Tracer Test
TABLES
Table 2-1. Characteristics of the tracers injected on July 18-19, 1985, at the Cape Cod site...45 Table 2-2. Selected statistics and spatial moments for the bromide tracer cloud during the
first 237 days of the Cape Cod tracer test... 50
Table 3-1. Predicted angles of downward movement of a tracer solution for various values of tracer-solution density using the Hubbert (1953) model ... 62 Table 3-2. Downward seepage velocity and relative rate of downward movement for a
horizontal cylinder with cylindrical and elliptical cross sections...73 Table 3-3. Change in coefficients for the horizontal and vertical seepage velocity shown in
Equation (3.27) for selected ratios of the viscosity of the tracer fluid to the viscosity of
the am bient ground w ater... 76 Table 3-4. Parameters used to calculate the downward angles of movement for various tracer
clouds using the analytical models of Yih (1963)... 77 Table 3-5. Predicted angles of downward movement of a tracer cloud for various values of
tracer-solution density using the Yih (1963) models... 78 Table 3-6. Observed maximum bromide concentration and estimated tracer-cloud density for
the first 237 days of the Cape Cod tracer test... 81 Table 3-7. Calculated downward movement of the tracer fluid body for a three-dimensional
sphere, a two-dimensional circular body, and a two-dimensional elliptical body using the analytical models of Yih (1963) and an estimated decrease in density difference with
travel tim e because of dispersion... 85 Table 3-8. Calculated vertical displacement of a circular tracer body using the Gelhar model
for various values of dispersivity and initial radius of the tracer cloud...89
Table 3-9. Predicted total amount of downward movement after 237 days for conditions similar to those during the Cape Cod test using the Hubbert (1953), Yih (1963), and
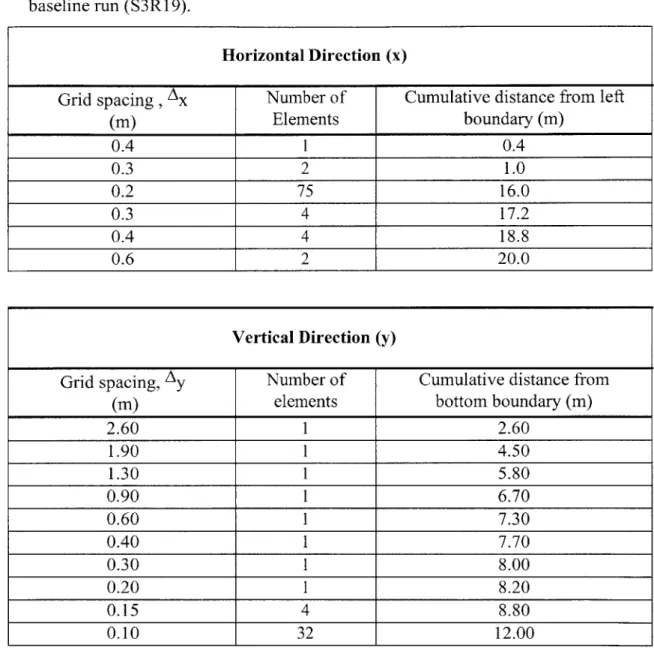
G elh ar m odels ... 9 5 Table 4-1. Spacing in the horizontal and vertical directions in the finite-element grid of the
baseline run (S3R 19)...107 Table 4-2. Aquifer and fluid properties for the baseline run (S3Rl 9)...111 Table 4-3. Model parameters for the baseline run, S3R19...118 Table 4-4. Comparison of longitudinal dispersivity from the model input value, the
estimated effective value with numerical dispersion, and the moments of the simulated tracer cloud for runs S3R23B, S3R42B, and S3R24B...123 Table 4-5. Model runs and factors examined for effect on density-induced downward
m ov em en t...12 9 Table 4-6. Comparison of the relative downward movement of the center of mass of the
simulated tracer cloud to the initial relative density contrast of the tracer solution after a 5-d ay -lon g p eriod ... 132 Table 4-7. Recharge rates applied uniformly in time and space along the top row of model
cells in runs S3R39B, S3R40B, and S3R41B...136 Table 4-8. Comparison of estimated vertical thickness occupied by cumulative recharge in
the aquifer to simulated additional downward movement of the tracer cloud for four
recharge rates at 1.25 and 5 days ... 139 Table 4-9. Downward movement of the tracer cloud and maximum solute mass fraction after
a 5-day-long period for initial tracer clouds with a total mass of 2.25 mass fraction units and aspect ratios (x-dimension divided by y dimension) of 1.02, 1.78, and 4.00...143
LeBlanc
Table 4-10. Downward movement of the tracer cloud after a 5-day-long period for a larger, but more elongated, initial cloud (S3R26B) and a smaller, but less elongated, tracer
clou d (S 3R 2 8B ) ... 14 3 Table 4-11. Grid spacing in the vertical direction for three simulations used to examine the
effect of the bottom boundary on downward movement...153 Table 5-1 Observed spatial moments and estimated size of the tracer cloud for first 237 days
of the C ape C od tracer test...164 Table 5-2. Selected aquifer and fluid properties for the field-scale simulation of the Cape
C o d tracer test ... 17 0 Table 5-3. Spacing in the horizontal and vertical directions for the finite-element grid of the
field-scale simulation of the Cape Cod tracer test ... 174 Table 5-4. Longitudinal dispersivity values at selected travel times during the first 237 days
of the C ape C od tracer test...177 Table 5-5. Temporal discretization for the 237-day-long field-scale simulation of the Cape
C o d tracer test ... 17 9 Table 5-6. Cloud size and grid-design criteria and final horizontal grid spacing and time
steps used to simulate the field-scale Cape Cod tracer test...180 Table 5-7. Characteristics of the 15 sequential model runs used to simulate the 237-day-long
C ap e C od tracer test...19 1 Table 5-8. Total mass of the solute cloud from the zeroeth moment for the non-iterative (run
S3R1 5B) and iterative (run S3R16B) solutions of the time period from 37.9 to 38.8 days.. 193
LeBlanc Density and Recharge during the Cape Cod Tracer Test
Table 5-9. Principal components of the longitudinal and transverse vertical variances obtained from a spatial-moments analysis of the observed and simulated concentration d istrib u tio n s ... 2 10
LeBlanc Density and Recharge during the Cape Cod Tracer Test
Density and Recharge during the Cape Cod Tracer Test
CHAPTER 1
INTRODUCTION
Many ground-water contamination problems involve dilute plumes of dissolved contaminants in shallow, granular aquifers. In these aquifers, ground water flows at rates of several feet per day, and the flow is mostly in the horizontal direction. The contaminated ground water is carried along by the flowing ground water and, therefore, the plumes extend for
significant distances from their sources in the direction of ground-water flow. Although the plumes are diluted gradually by dispersion, the movement of the dissolved substances is
dominated by advective transport with the regional, or ambient, flow. These systems, sometimes referred to as forced-convection flow systems, are characterized by a lack of feedback between solute concentrations and flow velocities. In other words, the density of the ground water is, for all practical purposes, a constant value in space and time.
Hydrologists commonly infer plume movement in advection-dominated, shallow ground-water systems from a map of hydraulic head, in many cases a ground-water-table map. They assume that vertical movement is small and that the direction of flow and, therefore, plume movement, is in the same direction as the water-table gradient. This assumption is useful in many field situations, particularly when a reasonable estimate of the plume's path from water-level measurements is one of the few predictions that can be made easily with commonly available field data. The literature contains many examples of the application of this approach to plume analysis.
Field and Laboratory Studies of Vertical Movement
Even in aquifers with mostly horizontal flow, dilute plumes are observed to sink below the water table with travel distance from the source. This downward movement often reflects the
influence of areal recharge from precipitation. The recharge causes a component of vertical flow that may be transient and small compared to lateral flow in the aquifer. The result is downward movement of the plume relative to the water table, and the formation of a zone of "clean" ground
water above the plume. This phenomenon has been observed in many detailed studies of contaminant plumes in shallow aquifers that receive areally distributed recharge (Kimmel and Braids, 1980; MacFarlane and others, 1983; LeBlanc, 1984; Ryan and Kipp, 1997). LeBlanc (1984) reported that the zone of clean ground water above a 3-kilometer-long sewage plume in the Cape Cod aquifer is 6 to 15 m thick. The aquifer receives about 50 cm/year of recharge.
In all of the cases cited above, the plume trajectories were the primary field evidence for the downward displacement caused by recharge; vertical hydraulic-head gradients were transient or too small to measure using standard water-level measurement methods. However, the effect of areal recharge has been demonstrated in ground-water modeling studies that simulate flow paths in the aquifer. The vertical trajectory of the Cape Cod sewage plume, for example, is simulated accurately in a three-dimensional ground-water flow model that includes areally distributed recharge from precipitation (Masterson and others, 1997b).
There is also evidence from the detailed study of contaminant plumes in shallow aquifers that density may play a role in the downward movement of plumes. Kimmel and Braids (1980), in their classic report on the Babylon and Islip landfills on Long Island, New York, observed that
LeBlanc Density and Recharge during the Cape Cod Tracer Test
the highest concentrations of dissolved contaminants were near the base of the upper glacial sand and gravel aquifer. They hypothesized that dense packets of leachate generated by precipitation passing through the landfill were sinking down through the ambient ground-water flow because of density effects. Landfill leachate can have solute concentrations as high as 50,000 mg/L (Freeze and Cherry, 1979). MacFarlane and others (1979) made similar observations at the Base Borden landfill in Ontario, where the plume has moved about 20 m downward below the water table to the base of the sandy aquifer. They noted that the density-induced vertical head gradients were on the same order as the ambient vertical gradients during all but periods of recharge during the late spring and early summer. Van der Mollen and van Ommen (1988) concluded that density effects might have contributed to the downward movement of a number of landfill plumes in the Netherlands. LeBlanc (1984) suggested that density may have affected the downward movement of the sewage plume on Cape Cod, although the hydraulic loading at the
sewage-disposal site and the significant areal recharge probably account for most of the observed downward movement of this dilute plume.
Bear (1972, p. 653-655) explained that, when the fluid density in a layer of stationary water in a porous medium is greater than the density of an underlying layer, even a small
disturbance may result in convective flow, sometimes referred to as free convection, in which the less dense fluid tends to rise and the more dense fluid tends to sink. The forcing function is directly related to the density difference between the two fluids, Ap/p, , where Ap is the density difference between the two fluids and po is the density of the ambient fluid. Darcy's Law for a fluid of density, po, can be written as (Bear, 1972, Equation 10.7.34):
k ij p +Pgaz
S=pg
np~
ax
ax
,(1.1)LeBlanc Density and Recharge durinz the Cape Cod Tracer Test
Density and Recharge during the Cape Cod Tracer Test
where:
V* = ground-water velocity (L/T),
k.. = permeability tensor (L2),
n = effective porosity (dimensionless),
p = dynamic viscosity (M/(L-T),
p = fluid pressure (M/(L-T2), po = ambient fluid density (M/L3),
g = gravitational acceleration (L/T2), and
x, z = horizontal and vertical coordinate directions.
Darcy's Law can be rewritten in the form (Bear, 1972, Equation 10.7.45):
, k,pga
S =9 +p k,g(p,-p
0)
O(1.2)az ,' np c8xi pog, np axi
where p, is density of the tracer fluid.
Bear (1972, p. 654) noted that the motion can be interpreted as being caused by two driving forces shown by the two terms on the right side of Equation (1.2). One results from the piezometric head differences, where the head (z + p/p0g) is defined with respect to the
reference fluid. The other results from the buoyancy force, directed vertically upward or downward, acting on the fluid of density p, imbedded in a fluid of density po. The relative importance of the forced convection and the buoyancy force can be related to the ratio of the hydraulic-head gradient (Ah/L) and the density-related gradient (Ap/po ). When
Ap/p >> Ah/L, the flow is determined mainly by the buoyancy force. Therefore, the larger the LeBlanc
density difference between the ambient ground water and the contaminant solution, the greater the likelihood of density-induced sinking.
Most shallow ground-water systems in granular aquifers are advection dominated. Therefore, the effects of density-induced downward movement are difficult to distinguish because of the large component of lateral movement and the significant areal recharge. Field evidence for density-induced downward movement has come mostly from landfill studies
because of the high concentrations of dissolved substances and, therefore, the elevated density of landfill leachate. Field tracer tests, however, have provided additional evidence of density-induced downward movement for tracer solutions that are considerably less dense than leachate.
In one of the first detailed natural-gradient tracer experiments reported in the literature, Sudicky and others (1983) observed a downward trajectory of a chloride tracer cloud injected into the Borden aquifer. The tracer solution was added as a 700-liter pulse injected just below the water table. They attributed part of the downward movement to a density contrast (Ap/p ) of
about 10-3g/cm3 (0.1 percent) between the tracer solution and the ambient ground water. Mackay
and others (1986) and Freyberg (1986) reported a similar downward trajectory in the now famous large-scale tracer test at the Borden site. The tracer cloud was injected as a 12,000-liter pulse with chloride and bromide concentrations of 892 and 324 mg/L, respectively, and the cloud was tracked through an array of multilevel samplers as it moved more than 80 m laterally during a
1,038-day period. The center of mass of the tracer cloud moved downward about 2.7 m during this period. The downward movement was most rapid, however, in the early part of the test, when the cloud moved downward 1.0 m in only 111 days. The vertical trajectory of the cloud was concave upward, which may have been an indication of the diminishing influence of density
Density and Recharge during the Cape Cod Tracer Test
because of dilution of the tracer cloud with time. Freyberg (1986, p. 2040) attributed the observed downward movement to a small vertical component of the regional velocity field, the density contrast between the tracer cloud and the native ground water, and to local infiltration and recharge above the sinking cloud.
The large-scale natural-gradient tracer test at the Cape Cod site in 1985-88 (LeBlanc and others, 1991; Garabedian and others, 1988, 1991) provides additional evidence for downward movement because of density and recharge. This test is described in detail in the next chapter. The bromide tracer cloud moved downward about 3.2 m during the first 237 days of the field experiment, and a distinct zone of tracer-free ground water formed above the cloud. The trajectory was concave upward, which is similar to the trajectory reported by Freyberg (1986). LeBlanc and others (1991, p. 905) attributed about 1.5 m of the downward movement to areal recharge during this period. Based on a preliminary application of the analytical models of Hubbert (1953) and Yih (1965), they attributed the remainder of the downward movement to the density difference (about 0.1 percent) between the tracer solution and the ambient ground water.
Davis and others (2000) conducted a second large-scale tracer test at the Cape Cod site in 1993-95. About 10,000 liters of tracer solution, including bromide and various reactive metals, were injected into the aquifer about 50 m downgradient from the injection location of the 1985-88 test. The center of mass of the bromide cloud moved downward about 1.9 m and laterally about 52 m during the first 111 days of the experiment. The water-level hydrograph suggests that there was little recharge to the aquifer during this period. The vertical trajectory had the same concave-upward shape reported by LeBlanc and others (1991) and Freyberg (1986). Davis
and others (2000) attributed part of the downward movement to density-induced sinking, although they did not estimate the amount of recharge that occurred during the test.
The Cape Cod and Borden natural-gradient tracer tests were run in relatively
homogeneous glacial outwash aquifers. Boggs and others (1992) and Adams and Gelhar (1992) reported on a natural-gradient test that was run in a heterogeneous alluvial aquifer at Columbus Air Force Base in Mississippi. The test involved the injection of 10,000 liters of ground water containing several tracers, including bromide at a concentration of 2,500 mg/L. The density contrast between the tracer solution and the ambient ground water was estimated to be about 0.4 percent. Because of significant upward hydraulic gradients near the injection site, the center of mass of the tracer cloud rose in elevation during the test. Boggs and others (1992, p. 3287) noted, however, that a downward spreading of the plume near the source, in spite of the upward gradient, was probably evidence of density-induced sinking of the tracer cloud.
Jensen and others (1993) reported on two natural-gradient tracer tests that were conducted in glacial outwash in Denmark. One tracer cloud included tritium and had an estimated density that was similar to that of the ambient ground water; the second tracer cloud included chloride and was estimated to have a density contrast of about 0.7 percent. The tritium cloud showed no downward movement relative to the water table, but the chloride cloud moved rapidly downward to the base of the aquifer. Jensen and others (1993) attributed the downward movement to the density difference between the tracer solution and the ambient ground water.
In all of the tracer tests described above, the tracer solution was injected as a pulse into the aquifer, and the cloud was observed by collection of water samples as it passed through an array of multilevel wells. Rivett and others (1994) conducted a tracer test with organic solvents
at the Borden site by creating a plume that emanated continuously from an emplaced semi-permanent source. The total concentration of the three organic compounds exceeded 2,000 mg/L in ground water collected near the source volume. Rivett and others (1994, p. 35) observed high
levels of contamination in the aquifer layers immediately below the base elevation of the source. They ascribed the downward expansion of the plume near the source to the density difference between the tracer solution and the ambient ground water.
A number of researchers have investigated the factors that affect density-induced
downward movement of dense solutions by use of laboratory "sand tank" experiments. Most of the experiments reported in the literature involved the creation of a contaminant plume from a continuous source rather than the pulsed injections used in most field-scale tracer tests. Paschke and Hoopes (1984) conducted a set of 11 experiments in which the tracer solutions had relative densities (Ap/p, ) of 0.03 to 0.20. They observed that the amount of downward movement increased as the density difference increased and as the rate of ambient lateral flow across the model decreased.
A focus of most other laboratory experiments reported in the literature was the
development of instabilities during density-induced sinking. These instabilities develop as the unstable density stratification leads to free convection in the porous medium, in which fingers develop in the flow that result in the rapid and erratic redistribution of solutes. The rapid flow causes the fluids to mix to achieve a stable density gradient (Shincariol and Schwartz, 1990). Although Pashchke and Hoopes (1984) used a density contrast that should have led to intense instability and strong free convection, they do not report on the nature of the flow system during their experiments.
LeBlanc Density and Recharge during the CapCoTrcres
Shincariol and Schwartz (1990) ran several sets of experiments in which tracer solutions were introduced along the upstream side of a sand tank that had a steady ambient horizontal flow and various configurations of homogeneous, uniformly layered, and lenticular media. They varied the relative density and ambient flow rate during the experiments. In the homogeneous medium, density effects were apparent with small ambient flows even at modest density
contrasts. The instabilities in the flow became noticeable for the particular configuration of the tests at concentrations as low as 1,000 mg/L. In the layered media, the denser tracer solution tended to accumulate at the boundaries between high-permeability and low-permeability layers, much like dense nonaqueous liquids (DNAPLs) are reported to accumulate on low-permeability lenses and layers beneath spill sites. Shincariol and Schwartz (1990) noted that the accumulation occurred because the downward-moving dense fluid arrived at the interface at a greater flux rate than the rate at which it could move into the lower permeability unit below. A similar
phenomenon was observed in the lenticular media, in which complex flow patterns occurred at large density contrasts. The heterogeneity tended to increase the stability of the flow system and reduce the amount of downward movement for a given density contrast. In the lenticular media, flow tended to remain stable even at concentrations as high as 2,000 mg/L. Schincariol and Schwartz (1990) concluded that the "realization that dense plumes should sink to some extent in a homogeneous and isotropic medium is inherent in the physical laws of groundwater flow." Once a density difference exists, there is a component of downward velocity. Whether it is significant or not depends on other factors, such as the scale of the problem, the initial density difference, and the rate of ambient lateral flow.
Oostrom and others (1992) also conducted sand-tank experiments, but with a line source at the top of the tank to represent the input of dense leachate from a landfill. The porous media
LeBlanc Density and Recharge during the Cape Cod Tracer Test
were all homogeneous and isotropic, and they varied the ambient flow, leachate inflow rate, and density contrast for the various experiments. The results they obtained were similar to those reported by Shincariol and Schwartz (1990) for a homogeneous medium. They showed that large values of permeability and relative density favored the development of instabilities, and high values for the ambient horizontal flow, effective porosity, and dispersion coefficient favored the maintenance of stable flow. Oostrom and others (1992) noted that no single criterion was
found to predict the flow stability, but that density-induced sinking was observed even with modest density differences.
Istok and Humphrey (1993) conducted sand-tank experiments at relatively low solute concentrations (40 to 1,000 mg/L). Few details are provided in the short abstract. They reported that buoyancy-induced vertical flow occurred at all tracer concentrations investigated, and the amount of vertical movement could be predicted from the ratio of the relative density to the lateral hydraulic gradient. They concluded that buoyancy-induced flow might be a more widespread phenomenon than had been previously recognized.
Analytical and Numerical Models
Analytical models can provide insight into the factors that affect the rate of downward movement of a dense plume within an ambient flow field at low relative densities, when the flow field remains stable. Hubbert (1953) developed analytical expressions for the relative movement of two fluids of different densities when one of the fluids dominates the ambient flow field. Hubbert's method, developed to explain the migration and entrapment of petroleum in reservoir rocks, assumes that both fluids can occupy any point in the aquifer and that the fluids do not mix.
The analytical expressions relate the potential field of the tracer fluid to the potential field of the ambient fluid by the relative density (Ap/p, ) described by Bear (1972). The amount of
downward movement predicted by the Hubbert method is dependent on this vertically oriented density driving force.
Analytical models developed by Yih (1963, 1965) predict the downward movement of fluid bodies of various shapes in an arbitrarily oriented, unidirectional ambient flow field. The Yih method computes the components of velocity of a three-dimensional body by solving the Laplace equation with appropriate pressure and continuity conditions at the boundary between the two fluids. The method assumes that the aquifer is homogeneous, isotropic, and infinite in extent; and that the fluid body, although it displaces the ambient fluid as it sinks, does not deform or become diluted by dispersion. The relative density determines the rate of downward movement of the fluid body. Yih (1963) showed that the shape of the fluid body and its
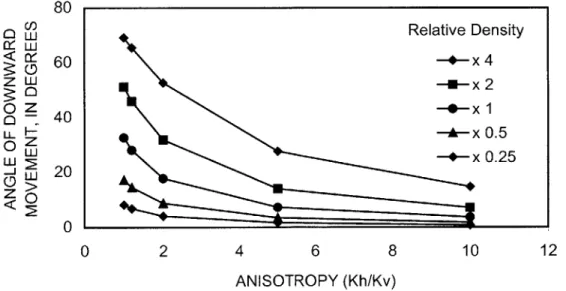
orientation relative to the ambient flow direction and the direction of the gravitational force all affect the computed rate of downward movement. For example, for a given density difference, an elliptical body sinks more rapidly with its major axis oriented vertically than with its major axis oriented horizontally. A comparison of predicted rates of downward movement of a spherical body and an infinitely long circular cylinder suggests that the predicted sinking rate of similarly shaped bodies is smaller for two-dimensional models than for three-dimensional models. The Hubbert (1953) and Yih (1963) models are discussed further in Chapter 3 of this report.
The analytical analysis of Paschke and Hoopes (1984) addressed the downward
movement of a dense plume from a source at the top of a horizontal ambient flow system. Their
LeBlanc Density and Recharge during the Cape Cod Tracer Test
model predicts the trajectory, concentration, and boundary of a density-influenced ground-water plume, similar to a leachate plume from a landfill. The model includes two regions, one near the source, where vertical flow caused by density dominates, and one far from the source, where the plume is influenced primarily by the ambient flow. The models assume that the pressure
distribution is hydrostatic within the plume and that the viscosity is constant in the flow domain. In the region near the source, the rate of downward displacement is proportional to the relative density and inversely proportional to the cumulative downward displacement, the latter because of the diluting effect of dispersion with vertical travel distance. Perhaps most interestingly, the cumulative downward displacement (i.e., the vertical position relative to the initial position) is proportional to the square root of the horizontal displacement. This relationship is consistent with the concave-upward shape of the trajectories observed during the Cape Cod and Borden tracer tests. In the region far from the source, the cumulative downward displacement is proportional to the cube root of the horizontal displacement. This relationship indicates that, although the effects of density diminish as the plume moves far from the source, a component of vertical movement persists as long as there is a density contrast between the two fluids. Paschke and Hoopes (1984, p. 1185) presented a characteristic length scale for the plume, which indicates that the relative importance of the buoyancy-induced flow increases with increasing
permeability, source flux, and density contrast, and decreases with increasing porosity, ambient flow rate, and dispersion coefficients.
Jalbert and others (2000) used an analytical analysis to demonstrate that density effects should be considered when using tracer-test breakthrough curves to estimate aquifer properties, such as dispersivity and hydraulic conductivity. They developed equations describing the change in a sloping front between two fluids with different densities as the front advances along a layer
of the aquifer. The smearing of the arrival of the denser tracer fluid at a given observation point can provide inaccurate values for the apparent hydraulic conductivity and dispersivity from fitting of the advection-dispersion model to the average breakthrough data. Jalbert and others (2000) concluded that density-induced flow must be considered in the interpretation of tracer-test data, even at relatively low concentrations where no feedback between concentrations and flow is typically assumed.
Numerical models provide increased flexibility in the simulation of density-induced sinking by allowing incorporation of variable aquifer properties, irregular aquifer boundaries, and various configurations of the source of the dense fluid. A number of computer codes have been developed to simulate density-dependent ground-water flow and solute transport with
conservative and non-conservative, reactive chemical species. These codes include those
described by Frind (1982), Voss (1984), Sanford and Konikow (1985), Kipp (1987), van Walsun (1987), Mendoza and Frind (1990a,b), Zhang and others (1994), and Zhang (1995). It is beyond the scope of this report to evaluate and compare these models.
Frind (1982) used a two-dimensional finite-element model to simulate a hypothetical landfill plume. Little density-induced downward movement was simulated because a large value of transverse dispersivity (aT = 1 m) rapidly diluted the simulated plume. Frind (1982)
concluded that the vertical dispersivity would have to be decreased by at least an order of magnitude in order for the effect of density to become noticeable.
The vertical trajectory of the tracer cloud during the large-scale natural-gradient tracer test at the Borden site (Mackay and others, 1986) was simulated by van Walsun (1987) using a two-dimensional alternating-direction Galerkin finite-element model. The model assumed an
isotropic hydraulic conductivity and a small constant regional vertical gradient across the model domain. A lateral ambient flow was imposed by use of a specified-flux upgradient boundary condition and specified-pressure downgradient boundary condition. The source was assumed to appear instantaneously in the aquifer at the start of the simulation; it was not injected into place. Initial simulations with a relative density difference of 0.1 percent and a longitudinal dispersivity of 0.45 m significantly under-predicted the observed downward movement during the
experiment. Better agreement was obtained by increasing the regional vertical gradient to represent a greater rate of recharge from precipitation. An increase in the initial density of the tracer cloud also increased the simulated rate of downward movement. Van Walsun (1987) also simulated an increasing dispersivity with travel distance to represent the scale-dependence of the dispersion process. In several simulations, the value was increased nonlinearly to an asymptotic value of 0.45 m over various time intervals since the start of the tracer test. The results
demonstrated that a constant value of dispersivity at its asymptotic, late-time value generated too much spreading and dilution at early times and decreased the influence of the density-dependent forces too rapidly.
Koch and Zhang (1992) used the computer code MOCDENSE (Sanford and Konikow, 1985) to simulate two-dimensional density-dependent transport of a conservative solute
representing a typical landfill plume. Their simulation setup was similar to that of van Walsun (1987), except that there was no ambient vertical gradient and the source area was a patch along the top boundary of the model. The aquifer was assumed to be homogeneous, and a value of 5 m was used for longitudinal dispersivity. An anisotropic hydraulic conductivity and a uniform rate of recharge along the top boundary of the model were used for some simulations. The various simulations showed that a relative density of about 0.3 percent caused discernable downward
Density and Recharge during the Cape Cod Tracer Test
movement of the plume. The downward movement was small, however, compared to the lateral movement. Koch and Zhang (1992) noted that considerable travel distance might be needed for the downward movement to become discernable in a field situation. The rate of sinking was proportional to the horizontal hydraulic conductivity and the relative density difference. Additional simulations indicated that increases in dispersivity and the anisotropy of hydraulic
conductivity decreased the amount of simulated downward movement.
Most contaminant plumes consist of many chemical species that may interact chemically with one another and with the aquifer matrix. Zhang and Schwartz (1995) used an optimized and modified version of the computer code VapourT (Mendoza and Frind, 1990a, b) to simulate
two-dimensional density-dependent flow and transport of two species in a typical landfill plume based loosely on the Babylon landfill (Kimmel and Braids, 1980). The conservative species was
assumed to incorporate all the density-determining properties, while transport of the second species could be retarded relative to transport of the first species. Both intermittent and
continuous input of the leachate was simulated. For the particular set of simulation parameters, density effects were important when the leachate concentration exceeded about 2,000 mg/L. Important factors that influenced the development of the plumes included the temporal pattern of loading, the initial concentration of the density-determining species, and the extent of retardation of the sorbing species. Zhang and Schwartz (1995) noted that the ambient flow field encountered by a sinking plume also affects the plume development. They suggested that the relative change
in the horizontal and vertical positions of the concentration distributions of various species in a plume is a good indicator of whether density effects or ambient flow dominate transport.
Density and Recharge during the Cape Cod Tracer Test
Purpose and Scope
The purpose of this report is to examine the hypothesis of LeBlanc and others (1991) that density effects and recharge from precipitation caused the observed downward movement of the bromide tracer cloud during the first 237 days of the 1985-88 Cape Cod tracer experiment. Analytical and numerical modeling is used to examine the hydraulic factors and model-design considerations that affect the simulated rate of downward movement. The models are then applied to the specific parameters for the Cape Cod test to test the hypothesis.
Preliminary results of this work have been reported in several proceedings papers and a journal article. LeBlanc and Celia (1991) used the analytical models of Hubbert (1953) and Yih (1965) to examine the factors that affect the rate of downward movement. They also used
SUTRA (Voss, 1984) to simulate density-dependent flow and transport for a simplified
representation of the first several days of a tracer test. LeBlanc and Celia (1996) reported on the field-scale simulation of the Cape Cod tracer test. This thesis presents the details of the work described in these two reports.
Zhang and others (1998) used the results reported by LeBlanc and Celia (1991, 1996), and additional concepts described by Zhang and Schwartz (1995), to simulate the variable-density flow and transport of bromide and lithium during the Cape Cod experiment. They simulated bromide as a conservative species and lithium as a sorbing, slightly retarded species, based on the results of Garabedian and others (1988) and Wood and others (1990). They
modified a vectorized finite-element model (Mendoza and Frind, 1990a,b; Zhang and others, 1994) to simulate two-dimensional coupled ground-water flow and mass transport with a kinetic adsorption model in a variable-density system. A finite-volume code (Zhang, 1995) was used to
Density and Recharge during the Cape Cod Tracer Test
simulate flow and transport in three-dimensions for a small subsection of the aquifer for
comparison to the two-dimensional results. The boundaries for the models are the same as those used in LeBlanc and Celia (1996), and the test parameters were taken from the various Cape Cod tracer-test papers described in Chapter 2 of this thesis. A major difference from the earlier modeling is that aquifer heterogeneity was incorporated explicitly in the model and, therefore,
only a small value of local longitudinal dispersivity (aL = 0.1 m) was used in the simulations. Zhang and others (1998) confirmed the results of LeBlanc and Celia (1996), which demonstrated that the amount of downward movement was dependent on the initial density difference between the tracer cloud and the ambient ground water, and that recharge from
precipitation contributed significantly to the vertical displacement of the tracer cloud. The three-dimensional simulations confirmed the findings of LeBlanc and Celia (1991, 1996) that the size of the initial cloud affected the rate of downward movement. The three-dimensional simulations also demonstrated that the amount of downward movement was less in a two-dimensional
simulation than in a three-dimensional simulation. LeBlanc and Celia (1991) had inferred this relationship by comparing the Yih (1963) analytical solutions for a sphere and an infinitely long circular cylinder.
Zhang and others (1998) extended the work of LeBlanc and Celia (1991, 1996) by
incorporating a deterministic trend in hydraulic conductivity in the two-dimensional simulations. LeBlanc and others (1991) had hypothesized that the asymmetrical shape of the bromide cloud was caused by a zone of high hydraulic conductivity near the water table. By incorporating this trend into the heterogeneous conductivity field, Zhang and others (1998) were able to better simulate the observed asymmetrical shape of the tracer cloud. They also were able to simulate the general trajectory, shape, and retarded velocity of the lithium tracer cloud.
Density and Recharge during the Cape Cod Tracer Test
As mentioned above, this report documents the detailed analysis that is summarized in the preliminary reports by LeBlanc and Celia (1991, 1996). Chapter 2 is a brief description of the 1985-88 Cape Cod tracer test. In Chapter 3, analytical models are used to examine the factors that affect density-induced sinking, and the models are applied to the Cape Cod tracer test. The numerical model SUTRA (Voss, 1984) is used in Chapter 4 to further examine the factors that affect downward movement, including various issues related to model design. Chapter 5 describes the application of SUTRA to simulate the first 237 days of the Cape Cod test, when density was most responsible for the observed downward movement. The results of the analysis are discussed in Chapter 6.
The work presented in this thesis began in about 1990 and was completed only recently. During this time, there have been many advances in computing technology and analytical methods. Some of the methods that were used to circumvent computing limitations would no longer be necessary. However, the principles of flow and transport remain the same, and this work focused on an examination of those principles for density-induced flow and solute transport.
Density and Recharge durin,~ the Cape Cod Tracer Test LeBlane
CHAPTER 2
CAPE COD NATURAL-GRADIENT TRACER TEST
The purpose of this chapter is to present a brief summary of the 1985-88 natural-gradient tracer test at the Cape Cod site. This experiment was conducted to measure the field-scale dispersion of solutes and to obtain data with sufficient detail to test various stochastic theories that relate aquifer heterogeneity to the dispersive process (Gelhar and Axness, 1983; Dagan, 1982, 1984; Neuman and others, 1987). Detailed descriptions of the tracer test and hydrology of the test area have been reported by LeBlanc and others (1991), Garabedian and others (1988, 1991), Hess and others (1992), Wood and others (1990), and Stollenwerk (1995). The
information given below, which is drawn from these sources, describes the features of the test that are relevant to the problem of density-induced downward movement of the tracer cloud.
Site Description and Aquifer Characteristics
The tracer test was conducted in an abandoned gravel pit on western Cape Cod near the Massachusetts Military Reservation (Figure 2-1). The test site is located above a plume of sewage-contaminated ground water that was formed by more than 60 years of land disposal of treated sewage at the base (LeBlanc, 1984; LeBlanc and others, 1999).
Density and Recharge during the Cape Cod Tracer Test LeBlanc 71 00 73"00' 72 "00' 42 30' -MASSACHUSETTS BOSTON 70"00' _42_0__ Cape O 20 40 60 MILES Cod 0 20 40 60 KILOMETERS 70" 34' 33' 70"32
OTIS AIR BASE -50 SEWAGE DISPOSAL SAND BEDS 45 Tracer-test site a , /\shumot _ 41 38' Pond 40 Pond Round Po d nd11 AREA OE CONTAMINATED GROUND WATER 41" 36' 0 2000 EET CRANBERRY 0 500 METERS BOOS EXPLANATION
- 30 ---- WATER TABLE CONTOUR - Shows altitude of water table above
sa level, in feet. Arrows show direction of ground-water flow.
Figure 2-1. Location of the study area, showing the sewage plume and the tracer-test site [adapted from LeBlanc and others, 1991, Figure 1].
Density and Recharge during the Cape Cod Tracer Test
Hydrogeologic Characteristics
The aquifer at the test site is composed of about 100 m of unconsolidated sediments that overlie crystalline bedrock. The upper 30 m of the aquifer consists of stratified sand and gravel glacial outwash. The estimated average hydraulic conductivity of the sand and gravel is 110 m/d. Hydraulic tests made with a borehole flowmeter and permeameter tests made on cores (Hess and others, 1992; Wolf and others, 1991) indicate that the hydraulic conductivity varies about one order of magnitude. This results from the interbedded lenses and layers of the sand and gravel. Hess and others (1992) used a variogram analysis to estimate an anisotropy of 1.2:1 for horizontal to vertical hydraulic conductivity. The effective porosity of the sand and gravel was estimated from the results of the tracer test to be about 0.39 (Garabedian and others, 1991).
There is some evidence that the average hydraulic conductivity decreases with depth at the test site. Borehole flowmeter measurements and permeameter analysis of cores at a site about 15 m west of the tracer-test array (Wolf, 1988; Hess, 1989) detected a zone near the water table in which hydraulic conductivity is as great as 260 m/d. It is not known if a similar zone of high hydraulic conductivity is present in the path of the tracer cloud. But a trend of decreasing grain size with depth is a common characteristic of glacial outwash, sand and gravel deposits on western Cape Cod (Masterson and others, 1997a).
Hydrologic Characteristics
The water table at the test site is generally between 3 and 7 m below land surface and slopes to the south at about 0.15 m per 100 m (Figure 2-2). The water-table altitude typically fluctuates about 1 m annually because of seasonal variations in precipitation and recharge (LeBlanc and others, 1986) and the direction of the hydraulic gradient can vary by as much as 15
degrees (Walter and others, 1996). However, during the first 17 months of the tracer test (July 1985 to December 1986), the water table fluctuated only about 0.3 m and the direction of the hydraulic gradient varied by about 8 degrees (Figure 2-3).
13.45
INJECTION WELLS MAGNETIC
DAYS A3.15 13.70 GRAVEL AY37.6 461 DAYS\ 0 100 FEET 0 30 METERS EXPLANATION
AREA OF TRACER CLOUD IN WHICH BROMIDE CONCENTRATIONS EXCEEDED 1 MILLIGRAM PER LITER
WATER-TABLE CONTOUR, AUGUST 2, 1985 --Shows altitude of water table. Contour interval 0.05 meters. Datum is sea level.
- -- - PATH OF TRACER CLOUD
Figure 2-2. Tracer-test site, showing area of abandoned gravel pit, the water table, and the predicted and observed path of the bromide tracer cloud [adapted from LeBlanc and
LeBlanc Density and Recharge during the Cape Cod Tracer Test
Density and Recharge during the Cape Cod Tracer Test [-- PRECIPITAT M RECHARGE 20 10 0 INJ ION
IINJECTION
INTERVAL 237 384 DAYS DAYS ECTION DATE 1985 1986Figure 2-3. Graphs showing (A) altitude of the water table and direction of the hydraulic gradient, (B) monthly estimated recharge and precipitation, and (C) vertical position of the center of mass of the bromide cloud during 1985-1987 [from
LeBlanc 14.50 14.25 14.00 13.75 13.50 30 WATER-TABLE ALTITUDE
![Figure 2-1. Location of the study area, showing the sewage plume and the tracer-test site [adapted from LeBlanc and others, 1991, Figure 1].](https://thumb-eu.123doks.com/thumbv2/123doknet/14675565.557872/40.918.283.690.199.938/figure-location-showing-sewage-tracer-adapted-leblanc-figure.webp)