Controlled Molecular Crystallization
by
Ying Diao
B.S. Tsinghua University, 2006
Submitted to the Department of Chemical Engineering in partial fulfillment of the
requirements for the degree of
Doctor of Philosophy
at the
MASSACHUSETTS INSTITUTE OF TECHNOLOGY
February 2012
C Massachusetts Institute of Technology 2012. All rights reserved.
A u th o r...
Department of Chemical Engineering
September 23, 2011
C ertified by ...
Bernhardt L. Trout
T. Alan Hatton
Professors of Chemical Engineering
Thesis Supervisors
A ccepted by ...
William M. Deen
Professor of Chemical Engineering
Chairman, Committee for Graduate Students
Crystallization
by
Ying Diao
Submitted to the Department of Chemical Engineering on September 23, 2011, in partial fulfillment of the requirements for the degree of
Doctor of Philosophy
Abstract
It is essential to control crystallization in many areas of science and technology, such as the production of pharmaceuticals, pigments, concrete, semiconductors, as well as the formation of biominerals. In most practical circumstances, crystallization starts with heterogeneous nucleation at a foreign surface. Despite its widespread occurrence, mechanistic understanding of the role of a surface in heterogeneous nucleation is limited, especially in a solution environment.
My thesis aims at elucidating the roles of surface chemistry and nanostructure on nucleation to enable rational design of surfaces for controlling crystallization from solution. To this end, I systematically investigated the role of surface chemistry, morphology, in particular porous structures of various polymeric materials on heterogeneous nucleation using small organic molecules as model compounds.
I have demonstrated quantitatively the significance of surface chemistry to nucleation kinetics using a variety of polymer surfaces. By tuning the surface composition of the polymers, aspirin nucleation was promoted by up to an order of magnitude compared to the bulk. Further mechanistic investigations revealed that, macroscopically, it is through interfacial free energies that the surfaces influence the surface nucleation activity.
Equipped with nucleation induction time statistics as a powerful tool, I found that nanoscopic pores of 50-100 nm accelerated nucleation by up to two orders of magnitude compared with surfaces without pores. Moreover, I demonstrated for the first time that the shape of surface nanopores is essential in determining the nucleation behavior, using lithographic methods for nanopatterning the polymer films. A molecular mechanism was further proposed based on additional mechanistic investigations.
Furthermore, the nanoconfinement effect on nucleation was studied using polymeric microgels with tunable nanostructures and chemistry, whose mesh sizes range from 0.7-2 nm. We presented the first experimental evidence for the existence of an optimum confinement size at which the rate of nucleation was dramatically enhanced by up to four orders of magnitude. The
degree of nucleation enhancement depends on the extent of polymer-solute interactions, whose role was elucidated from the perspective of adsorptive partitioning and nucleation-templating
effect. In addition, the microgel nanostructure was also shown to play an important role in determining the crystal polymorphism of pharmaceutical compounds.
Thesis Supervisors: Bernhardt L. Trout
Title: Professor of Chemical Engineering T. Alan Hatton
I am deeply grateful for my graduate school experience at MIT Chemical Engineering Department. My five years spent here have been filled with memorable moments and intellectual enjoyment. I have received numerous advice and guidance, which supported me through difficult times and helped shaping me into an independent researcher.
First and foremost, I would like to acknowledge my thesis advisors, Prof. Bernhardt Trout, Prof. T. Alan Hatton. Over the five years of my Ph.D., Bernhardt has given me ample freedom to explore, even the little-known territories while keeping me in the right direction. By setting the standard high, he instilled in me scientific rigor and challenged me to innovate and improve continuously. I have also learnt from him to always keep the big picture in mind and to be willing to take risks, which I believe will equally benefit other aspects of my life. Alan was the first MIT professor I met back in the spring of 2006 at Beijing, when he deeply impressed me with his personable and humorous manner as an inspiring scientist. Alan has always been very encouraging and supportive. When I was upset over the research problems encountered, he went beyond his way to help me out of negative emotions. Alan has been a great source of creative ideas and novel concepts. Without his invaluable input, some research directions I have taken could have been unimaginable.
Having Allan in my thesis committee in the third year into my Ph.D has proven to be the turning point of my research. His wealth of knowledge has guided me through the depressing phase of scientific research when the input was close to infinity and the output was almost zero. He also set a great example as a caring mentor for me to look up to. I am genuinely indebted to Allan for his advice and concern over my future career development. I am also indebted to Prof. Rutledge and Prof. Cima for devoting time to serve on my thesis committee and for their insightful comments on my research.
I would like to acknowledge my collaborators, Dr. Matthew Helgeson, Dr. Takuya Harada, Surasak Chunsrivirot, Dr. Manju Sharma. Without the contributions from Matt Helgeson, several projects with polymer microgels would not have been possible. Takuya Harada supplied me with his well-facted magnetic nanoparticles, which greatly facilitated the investigation on the nanopore shape effect. Surasak Chunsrivirot and Manju Sharma help provided molecular level insight using their computational techniques.
I greatly enjoyed company and enlightening discussions with Trout, Hatton and Myerson group members, particularly Dr. Lev Bromberg, Ying Yang, Diwakar Shukla, Liang Chen, Gregg Beckham, Jie Chen, Keith Chadwick, Erik Santiso, Manas Shah, Fei Chen, Vilmali Lopez-Mejias. I am grateful to Prof. Karen Gleason and Jingjing Xu for use of their surface treatment instrumentation. I received a lot of help from Dr. Scott Speakman and Dr. Libby Shaw at the MIT CMSE for X-ray diffraction and Atomic Force Microscopy studies, and from Tim
Savas and Mark Mondol at MIT MTL for their assistance with lithographic techniques.
Last but not the least, I am truly blessed with my wonderful parents. They reserved nothing to support me through the 'grill' of MIT from the other side of the planet. Although they have never attended college due to historical reasons, they have been very keen on learning about my research. With their wisdom, they help me to look at a problem from a fresh perspective and to
face a difficult situation with the right attitude. They give me all their love when I stumble and fall, and they share their deepest joy with me to celebrate my success.
A bstract ... 3
A cknow ledgm ents . ... ... ... 5
List of Figures ...
19
List of Tables... 17
1. Introduction
... 19
1.1. M otivation and Objectives ...
19
1.2. Nucleation Theories ...
23
1.3. Nucleation on Substrates...
25
2. Role of Surface Chemistry in Surface-Induced Nucleation...29
2.1. Introduction ...
29
2.2. Experimental M ethods ...
30
2.2.1. Initial Screening of Polymer Surfaces ... 30
2.2.2. Nucleation Induction Time Measurement ... 31
2.2.3. Crystal Orientation Study ... 32
2.2.4. Characterization... 33
2.3. Results and Discussion ...
34
2.3.1. API Nucleation Activity of Surfaces via Nucleation Density ... 35
2.3.2. Nucleation Induction Time Statistics ... 39
2.3.3. Effect of Surface Chemistry on Nucleation... 46
2.3.4. Preferred Crystal Orientation... 50
2.3.5. Interfacial Free Energy Approach ... 54
2.4. Conclusions...
57
3. Role of Nanopore Shape in Surface-Induced Nucleation...59
3.1. Introduction ...
59
3.2. Experimental M ethods ...
60
3.2.1. Fabrication of Polymer Films with Spherical Nanopores ... 60
3.2.2. Fabrication of Polymer Films with Angular Nanopores ... 61
3.2.3. Nucleation Induction Time Measurement ... 62
3.2.4. Polymer Chemistry Screening ... 63
3.2.5. Characterization... 64
3.3. Results and Discussion ...
64
3.3.1. Polymer Films with Spherical and Angular Nanopores ... 64
3.3.2. Effect of Nanopore Shape on Nucleation Kinetics... 68
3.3.3. Angle-Directed Nucleation... 70
3.4. M olecular M echanism ...
77
3.5. Conclusions...
79
4. Role of Polymer Microstructures in Gel-Induced Nucleation...81
4.2. Experimental M ethods ...
82
4.2 .1. M aterials ... 82
4.2.2. Microgel Synthesis and Purification... 82
4.2.3. Characterization of Microgel Microstructures ... 84
4.2.4. Nucleation Induction Time Measurement ... 85
4.2.5. Partition Coefficient Determination ... 87
4.3. Results and Discussion...
88
4.3.1. Microgels with Tunable Microstructures ... 88
4.3.2. Effect of Gel Microstructure on Nucleation Kinetics... 90
4.3.3. Role of Polymer-Solute Interactions ... 94
4.3.4. Mesh Size Effect... 96
4.4. Conclusions...
98
5.
Role of Molecular Interactions in Gel-Induced Nucleation
...
101
5.1. Introduction ...
101
5.2. Experimental M ethods ...
103
5.2.1. Microgel Synthesis and Structural Characterization ... 103
5.2.2. Quantification of Polymer-Solute Interactions...104
5.2.3. Preferred Crystal Orientation via XRD ... 106
5.3. Results and Discussion ...
107
5.3.1. Structural Analysis on Polymer Microgels...107
5.3.2. Strength of Polymer-Solute Interactions ... 114
5.3.3. Effect of Gel Chemical Modification on Nucleation Kinetics ... 118
5.3.4. Nucleation-Templating Effect of the Polymer Gel...123
5.4. Conclusions...128
6. Crystallization of Polymorphs at Confined Interfaces... 129
6.1. Introduction ...
129
6.2. Experimental M ethods ...
131
6.3. Results and Discussion...139
6.3.1. System s...139
6.3.2. Crystallization of CBZ Polymorphs Induced by Microgels ... 140
6.3.3. Mechanistic Investigations into CBZ Polymorph Selectivity ... 144
6.3.4. Crystallization of ROY Polymorphs Induced by Microgels ... 148
6.3.5. Mechanistic Investigations into ROY Polymorph Selectivity...154
6.4. Conclusions...161
7. Conclusions and Future W ork... 163
7.1. Conclusions...163
7.2. Technical Implications...165
7.2.1. Application in Pharmaceutical Manufacturing...166
7.2.2. Application in Drug Delivery ... 167
7.3. Future Work ...
167
Cited References . .. . ... 99eoo~oooooooooooooooo171Figure 1-1 Current (top) vs. envisioned (bottom) pharmaceutical manufacturing chain ... 21 Figure 1-2 Schematic of heterogeneous nucleation from solution ... 24
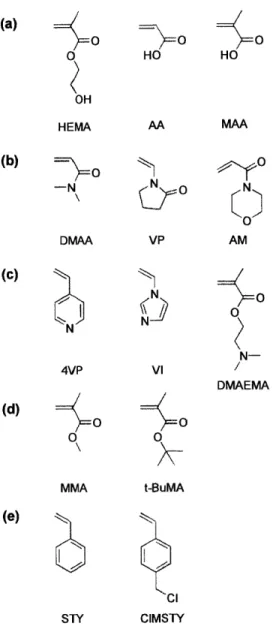
Figure 2-1. Chemical structures of monomers investigated in the initial screening. Monomers containing (a) carboxyl or hydroxyl groups, (b) tertiary amide functionality, (c) tertiary amine functionality, (d) carboxylic acid ester group, and (e) phenyl ring. ... 37 Figure 2-2. Nucleation density of aspirin on polymer films. Columns representing polymers from
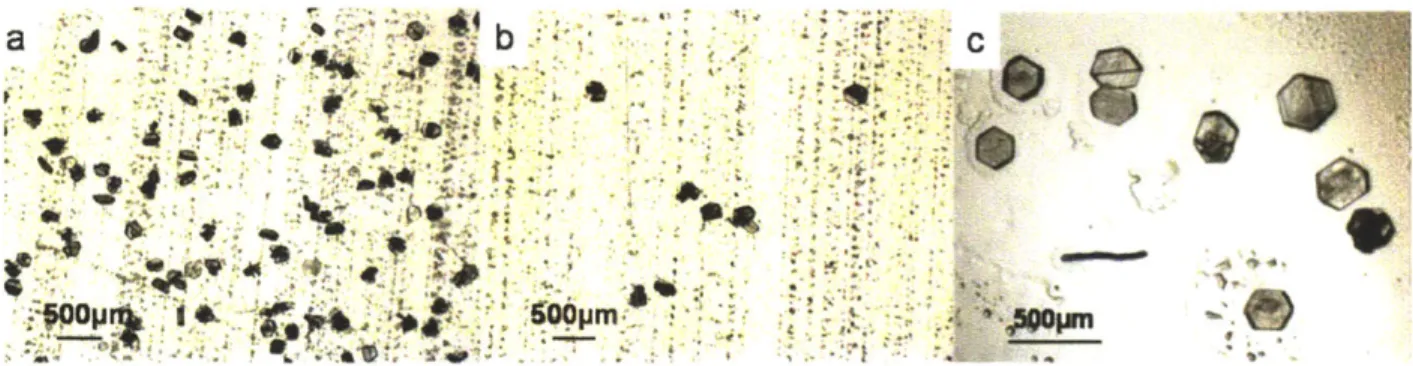
groups (a), (b), (c), (d), (e) are colored blue, yellow, green, pink, and red, respectively. Error bars were derived from three repeats... 38 Figure 2-3 (a) and (b) depict aspirin crystals on polymer films AM and DMAEMA, respectively.
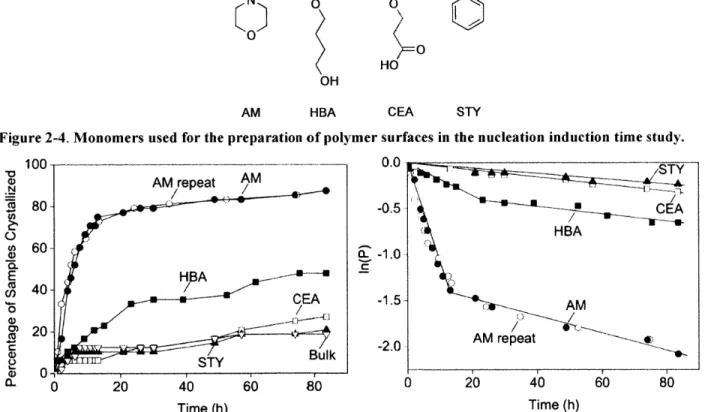
(c) shows aspirin crystals crystallized from the bulk of 3mg/ml aspirin/toluene solution....38 Figure 2-4. Monomers used for the preparation of polymer surfaces in the nucleation induction
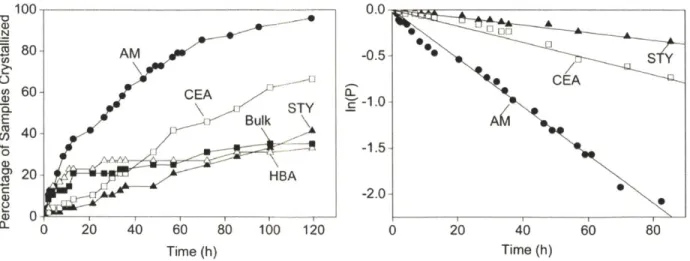
tim e stu dy . ... 4 1 Figure 2-5. Cumulative probability distribution of nucleation induction time (left) and statistical
analysis on the same data sets (right). The experiments were performed with polymers synthesized via UV polymerization with solvent ethanol. Crystallization was conducted at supersaturation S=4.2. The linear regression follows the formula ln(P)=-t/r to obtain the average induction time r. P is the probability for no crystallization event to occur within tim e t...4 1 Figure 2-6. Comparison of aspirin crystals from (a) the surface of AM, and (b) the bulk with
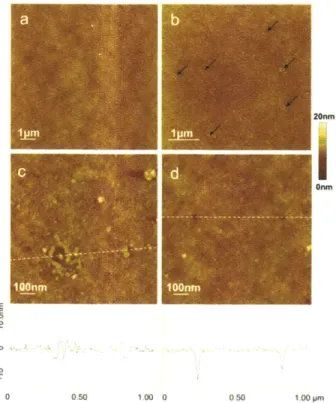
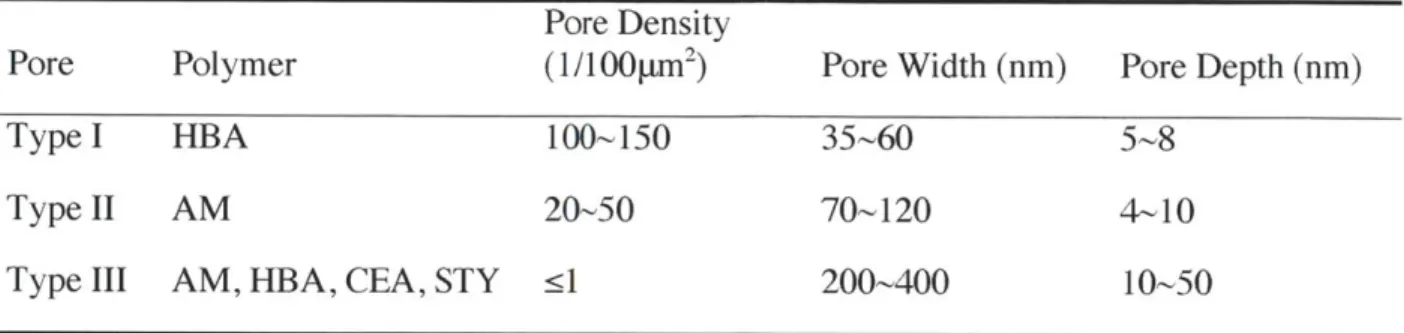
T eflon only . ... 42 Figure 2-7. AFM images of type I pores on AM and type II pores (Table 2-1) on HBA
synthesized with solvent ethanol and used in the induction time study. (a) The smooth surface of polymer sample AM less effective in nucleating aspirin. (b) Polymer sample AM more effective in nucleating aspirin. The pores, around 1 00nm in width, are indicated by arrows. (c) Higher resolution image of a pore found on effective AM. The pore is around 100nm in width and 4nm in depth. (d) Polymer sample HBA, with two pores of around 50nm in width and 5-8nm in depth. The cross-sectional depth profiles along the dotted lines on Figure 7c and 7d are shown below the respective AFM images...44 Figure 2-8. AFM images of type III pores (Table 2-1) on polymer samples prepared with solvent
ethanol and used in the induction time study. (a) CEA (b) STY (c) AM (d) HBA. The bright dots are impurities adhering to the surface during sample preparation. The dark dots signify pores on the polym er surface... 45 Figure 2-9. Cumulative probability distribution of nucleation induction time (left) and statistical
analysis on the same data sets (right) obtained with polymers synthesized via bulk polymerization. Crystallization was performed at supersaturation S=4.75. The linear regression in 10(b) follows the formula ln(P)=-t/r to obtain the average induction time r. P
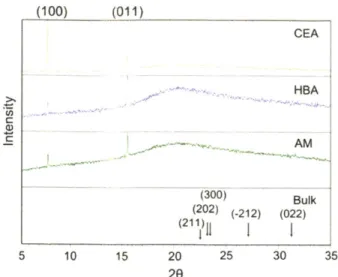
is the probability for no crystallization event to occur within time t. Since the STY, HBA and bulk samples produced comparable overall nucleation rates judged from the regressed average induction time (Table 2), thus only the STY data were displayed in 10(b)...48 Figure 2-10. X-ray diffraction patterns of aspirin crystals nucleated from polymer surfaces and in
the bulk. The (hkl) indices of the crystallographic planes are labeled over their
corresponding peaks. The broad peak around 200 seen in the top three diffraction patterns is attributed to the amorphous polymer film. Two primary peaks were observed in all four patterns, one around 7.70, and the other around 15.60. Since the (011) peak is separated from the (002) peak by a 20 angle of only 0.17 degree (Primary reference: Calculated from CSD using POWD-12++; Structural reference: Harrison, et al., Faraday Discussions. 2003.74), the 20 angle differences between the two primary peaks were carefully measured to determine that the peak around 15.6' matched with the (011) plane...52 Figure 2-11. Representative optical microscope images of the aspirin crystal grown from
polymer surfaces. (a) Aspirin crystals lying on the (100) face on polymer plate CEA. (b, c) Aspirin crystals standing on polymers AM and HBA. The tilt angle a of the (100) face with respect to the face in contact with the polymer is approximately 60*, which is very close to the dihedral angle between the (002) face and the (011) face. (d) Schematic of the crystal habits of aspirin . ... 53 Figure 2-12. Molecular structures of (011), (100) and (002) facets of aspirin crystal. The blue
line indicates the facet is polar, and red non-polar ... 54 Figure 2-13. Contact angle 0 in the classical nucleation theory (CNT). yni, Ysi, and ysn refer to the
interfacial free energies between the nucleus and the liquid, the substrate and the liquid, and the substrate and the nucleus, respectively... 55 Figure 2-14. Polymer surface energy components. The advancing contact angle between a
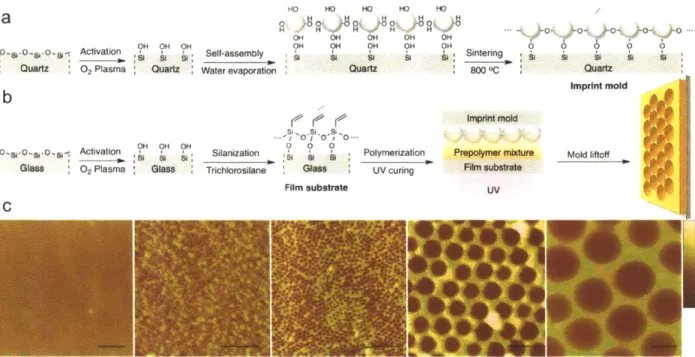
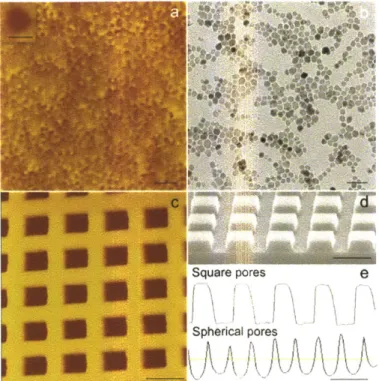
polymer and a probing liquid was measured at least six times for each of the five probing liquids applied on each polym er... 56 Figure 3-1. Fabrication of polymer films with spherical nanopores by NpIL. (a) Template
preparation via colloidal silica self-assembly and its anchoring to the quartz substrate. (b) Film substrate preparation and polymer film synthesis by UV polymerization. (c) AFM height images of polyacrylic acid films crosslinked with divinylbenzene (AA-co-DVB) with and without spherical nanopores templated with colloidal silica of various sizes. The
average pore size is (from left to right) none, 15 nm, 40 nm, 120 nm, and 300 nm. The scale bar is 200 nm. The data scale in height is (from left to right) 50 nm, 50 nm, 50 nm, 100 nm, and 400 nm . ... 66 Figure 3-2. Angular nanopores on AA-co-DVB polymer films and their templates. (a) AFM
height image of hexagonal nanopores on the polymer surface templated with iron oxide magnetic nanocrystals via NpIL. The scale bar is 50nm. (Inset) Higher resolution image of a hexagonal nanopore. The scale bar is I Onm. (b) TEM image of iron oxide magnetic
nanocrystals as synthesized. The scale bar is 50nm. (c) AFM height image of square nanopores on the polymer surface templated with Si square posts. The scale bar is 200nm. (d) High resolution SEM image of Si square posts on Si wafer fabricated by AIL for
48nm in depth, and the spherical pores are 120nm wide, 45nm deep on average. ... 67 Figure 3-3. Radius of curvature at the angle of square pores characterized via AFM. (a) AFM
height image of AA-co-DVB polymer surface. (b, c) High-resolution AFM height image and its corresponding depth profile. High-resolution solid carbon cone tip AFM probe was utilized for the high-resolution imaging, with a tip spike > 300 nm, and tip radius < 3 nm. 67 Figure 3-4. Effect of the nanopore shape in AA-co-DVB polymer films on the nucleation
kinetics of aspirin: spherical pores vs. hexagonal pores and square pores of the same size. Nanopatterned surfaces are compared against flat and smooth surfaces without pores, labeled as 'no pore'. r is the average nucleation induction time. The standard errors of r were calculated from the regression on the induction time probability distribution following the Poisson distribution. ... 69 Figure 3-5. Angle-directed nucleation of aspirin crystals induced by angular nanopores. (a)
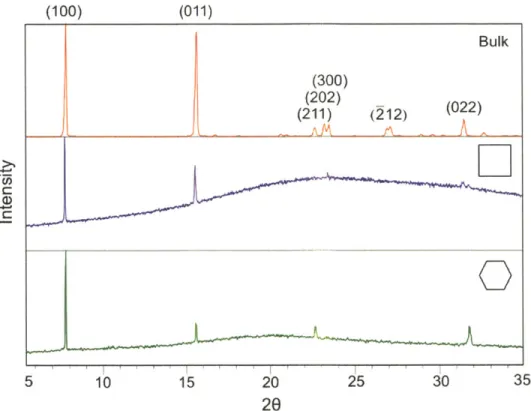
AFM phase image of aspirin crystals grown out from the square pores. (b) AFM phase image showing (100) layers of aspirin crystals nucleated at ledges in the square pores, indicated with white lines for all pores containing crystals. The scale bar is 1 00nm. (c, d) Possible configurations of aspirin crystal facets in the square pore,...71 Figure 3-6. X-ray diffraction pattern of aspirin crystals grown from the butyl acetate bulk
solution (top), on co-DVB films with 125nm square nanopores (middle), and on AA-co-DVB films with 15nm hexagonal nanopores (bottom). ... 73 Figure 3-7. Alignment of ASA crystals in square nanopores. a) AFM phase image of ASA
crystals inside the square pores and those grown out from the pores (upper right corner). All ASA crystals nucleated from the pores are delineated with while lines at least partially, and those pores without labels are empty confirmed with the corresponding height image. b) Optical micrograph of ASA bulk crystals. The blue dotted line denotes the (010) axis, which represents the orientation of a crystal. c) Schematic illustrating the orientation of an ASA single crystal inside a square nanopore. a is the acute angle between the blue dotted line and sidewalls of the nanopore indicated by the red dotted line...75 Figure 3-8. Histogram of ASA crystal orientation (quantified by a) distribution in square
nanopores. a is defined in Figure S4. The mean of a is 59.20 and its standard deviation is 4'. ... 7 5 Figure 3-9. Alignment of ASA crystallites nucleated from hexagonal nanopores. AFM height
image of the surface of an aspirin crystal grown on and detached from the AA-co-DVB polymer film with hexagonal pores. The contours of the crystallites are traced at a small distance from the crystal edges so as not to obscure them. Crystallites exhibiting the 'same' orientation are delineated with the same color. The orientation is considered the same when the contours of the two crystallites can overlay with each other just by scaling without
re-orienting ... ... -... -77 Figure 3-10. Effect of polymer surface chemistry on kinetics of angular nanopore-induced
time. AM denotes 4-acryloylmorpholine. AA denotes acrylic acid. AM-co-DVB refers to poly 4-acryloylmorpholine crosslinked with divinylbenzene. ... 78 Figure 4-1. Synthesis and characterization of PEGMDA microgel particles. (a) Schematic
diagram of the SFL process. (b) DIC microscopy image of purified PEG400DA microgel cubes suspended in 62/38 water/ethanol. Scale bar is 200 pm. (c) Apparent microgel mesh size versus PEGMDA molecular weight used in the hydrogel pre-cursor. All measurements are performed in 62/38 water/ethanol at 25 'C. Inset: representative images of swollen particles prepared from respective PEGMDA molecular weights. Scale bars are 30 gim. (d) Molecular structures of PEGMDA, ASA, ACM. Image courtesy: Matthew E. Helgeson...89 Figure 4-2. ASA crystals on PEG70oDA particles as crystallized from 38mg/ml ASA solution in
38/62 (v/v) ethanol/water with 15tg/mL PEG70oDA particles at 15'C, solution stirred at
70 0rpm ... 92 Figure 4-3. The nucleation kinetics of ASA and ACM with PEGMDA particles of various M. (a)
& (b) Statistical analysis of nucleation induction time for ASA (a) and ACM (b) at supersaturations (S) of 2.1(a) and 3.7(b). (c) & (d) Nucleation rates of ASA (c) and ACM (d). Nucleation rate J was calculated from the average induction time by J= 1/rV, where r is the average induction time, and V is the volume of solution. Inset: Schematics illustrating the relative position of the bulk solution in the metastable zone under the crystallization conditions. C and T represent the solute concentration and the temperature, respectively.. 92 Figure 4-4. Composition of ASA solution in the PEGDA gel phase compared with the bulk
phase. Particles of various mesh sizes are denoted by corresponding M. The compositions were given in w eight percentage. ... 94 Figure 4-5. Partition coefficient, K, of ASA and ACM in the PEGMDA gel, defined as the ratio of
solute concentration in the PEGMDA gel to that in the bulk. ... 95 Figure 5-1. Mesh size of PEGDA (blue) and PEGDA-co-AM (red) hydrogels measured in 3 8/62
(v/v) ethanol/water at 23 'C using estimated by equilibrium swelling measurements (closed symbols) and SANS analysis (open symbols). Image courtesy: Matthew E. Helgeson. ....109 Figure 5-2. Absolute SANS intensity spectra for the polymer hydrogels indicated. Solid lines
give best fits to the Debye-Bueche model, Equation 5-3. Image courtesy: Matthew E. H elgeson. ... 110 Figure 5-3. Schematics of microgel structures inferred from SANS measurements. Blue, red and
green chains denote the PEG subchain, acrylate and AM segments, respectively. Image courtesy: M atthew E. H elgeson...112 Figure 5-4. Comparison of partition coefficient, K, in the PEGDA gels vs. PEGDA-co-AM gels
for ASA (top) and ACM (bottom) systems. K is defined as the ratio of solute mass fraction in solution confined in the gel to that in the bulk. The error bars are calculated from three to four independent repeats...117 Figure 5-5. Enthalpy isotherms for adsorption of ASA onto PEG4ooDA (open symbols) and
enthalpy of adsorption was calculated...117 Figure 5-6. Effect of PEGDA-co-AM microgels on nucleation induction time statistics of ASA.
P is the probability for no nucleation event to occur within time t. a) Effect of polymer mesh sizes on nucleation kinetics. Fitted parameters following the two-exponential model are listed in Table 5-2. Data for Mn= 575 and 700 g/nol are shown separately for clarity. b) and c) Comparison of two exponential vs. stretched exponential models using PEGs75
DA-co-AM (b) and PEG7ooDA-co-AM (c) as representative examples...121
Figure 5-7. Preferred orientation of ASA crystals on polymer films. (a) Comparison of XRD patterns of ASA crystals grew from PEGDA and PEGDA-co-AM polymer films to that of bulk crystals. The results are not ... 125 Figure 5-8. Preferred orientation of ACM crystals on polymer films. (a) Comparison of XRD
patterns of ACM crystals grew from PEGDA and PEGDA-co-AM polymer films to that of bulk crystals. All ACM crystals are form I, the monoclinic form. The miller indexes (hkl) of facets preferentially oriented parallel to the polymer surface were colored blue and red, corresponding to PEGDA and PEGDA-co-AM polymer films, respectively. (b-d) Optical images of ACM crystals nucleated from bulk (b), the PEGDA surface (c), and the ... 127 Figure 6-1. Optical micrographs of PEG40oDA microgels as synthesized (left) and CBZ form II
needles grown on PEG4ooDA (right), in which three microgels covered with CBZ needles
are indicated with red arrows, and the contour of the middle one is traced with red lines to delineate the cubic gel. ... 14 1 Figure 6-2. X-ray Diffraction patterns of CBZ from bulk solution (top) and in the presence of
PEGMDA microgels, for which representative patterns are shown with M=200 (middle) and 575 (bottom) g/mol. CBZ forms I and II peaks are labeled with miller indexes (hkl) in the top and bottom panels respectively. The regions where major characteristic peaks of form I reside are outlined with black dotted lines. The hump between 12 to 200 is from the filter paper, since the crystals, harvested as soon as the crystallization ensued, are too few to be scraped off form the filter paper. A peak at 9.00' appears in some patterns, corresponding to CBZ dihydrate which forms during filtration, especially when the ambient humidity is high. This explanation is corroborated with control experiments where clear CBZ solution was passed through the filter paper, the XRD scan on which revealed only the dihydrate peak.
... 14 2 Figure 6-3. Nucleation induction time statistics of CBZ with or without the presence of PEGDA
microgels. P is the probability for observing no crystallization event within time t. Stretched exponential model was employed to fit the data (see Table 6-1), and the fitted curve is displayed as solid lines. Data obtained with PEG200DA and PEG575DA are omitted for
clarity ... 14 3 Figure 6-4. Partition coefficients (K) of CBZ in PEGMDA microgels from ethanol solutions. K is
defined as the ratio of solute mass fraction in solution confined in the gel to that in the bulk. The error bars are calculated from three to four independent repeats...145
Figure 6-5. Effect of solute concentration on the polymorphic composition of CBZ crystals. For samples with PEGMDA microgels, X-axis corresponds to the effective solute concentration of solution inside the gel, calculated by multiplying the solute partition coefficient (Figure 6-4) with the bulk concentration, 34mg/ml for all samples with microgels. The X error bars are from partition coefficient measurements, and the Y error bars calculated from XRD measurements on three independent samples. The mass fraction of Form I, rq, was calculated following I(1) , where Idenotes relative peak intensity. 01 and 01 are the
I(61)+ I(Br)
characteristic peak positions (20 in Figure 6-2) for Forms I and II, respectively. In this case,
O1= 12.3450 and 0r = 5.0460. Coefficient k, experimentally determined, converts the peak intensity fraction to the polymorph mass fraction...146 Figure 6-6. Specific CBZ-polymer interactions inferred from preferred crystal orientations. (a)
XRD pattern of CBZ crystals grown on PEGMDA films. Relative peak intensities were found to be independent of M. A representative pattern is shown. (b, c) Surface structures of Form II facets preferentially nucleated on...148 Figure 6-7. Optical micrographs of ROY crystallized from (a-c) bulk and on (d-i) microgels,
specifically, with M=400, 575, 700, 400, 400, 400 g/mol in images d, e, f, g, h, i
respectively. Y, R and ON denote yellow prism, red prism and orange needle forms. Scale bars for images (d-i) are the same as shown in (f). In images (d, e, g, h, i), the cubic
microgels are buried with tiny ROY crystals grown from their surfaces, whereas in image (f), only one large single crystal nucleated on the gel, leaving the red-colored microgel clearly visible. The originally transparent microgel became red in solution due to high preferential partitioning of ROY into the gel (Figure 6-10) or polymer-solute interaction
induced conform ation change...149 Figure 6-8. Nucleation induction time statistics of ROY with or without the presence of PEGDA
microgels. Each data point corresponds to one individual crystallization experiment. A data point is colored blue, red or green if form Y, R or ON is obtained from this experiment. For each type of samples, 50-100 experiments were performed to obtain the induction time statistics. P, the probability for observing no crystallization event within time t is estimated from the fraction of samples haven't crystallized at this time point. Either stretched
exponential model or multi-exponential models were employed to fit the data (see Tables 2 and 3), and the fitted curve is displayed as a black solid line. Each exponential decay
process was labeled with its characteristic time scale obtained from the model fitting...153 Figure 6-9. Polymorph frequency of occurrence in 12 mg/ml ROY-ethanol solution with or
without microgels of various mesh sizes (left) and at higher solution concentrations, Co (right). Frequency of occurrence is...153 Figure 6-10. Partition coefficients of ROY in PEGMDA microgels from ethanol solution. ... 155 Figure 6-11. XRD patterns of ROY crystallized from bulk solution (top) and on PEGDA films
(middle and bottom) under the same conditions. Additional peaks observed from crystals templated by polymer films but not from bulk crystals are marked with vertical grey dotted line. Reference patterns are calculated from CSD using POWD-12++. ... 156
surface. The solid line indicates the top surface of the corresponding facet. R and Y denote red and yellow ROY polymorphs. Prominent intermolecular interactions in ROY crystals are denoted with green dotted lines if the interaction is between the two in-plane molecules as depicted, and with red dotted lines if it is between one in-plane molecule and another molecule in the next layer in through-plane direction. (d) Molecular structures of monomers of ROY and PEGDA. ROY functional groups colored blue are inferred to preferentially interact with PEG subchain, and those colored red with the acrylate group...158 Figure 6-13. Molecular recognition motifs in ROY crystals of forms Y (a-b) and R (c-d). Green
dotted line denotes intermolecular interactions, and cyan dotted line intramolecular
interactions. Other supermolecular rings can form by different combinations of the same set of intermolecular interactions, however, this figure is not meant to exhaust all the molecular combinations in the ROY crystal, but to illustrate essential intermolecular interactions, which are all depicted here. n-n stacking is also present in both Y and R forms, exhibiting sim ilar m otifs (not show n here)...159 Figure 6-14. Schematic illustrating the mesh size effect on nucleation. Blue lines denote the
polymer mesh with crosslinking points colored black. The polymer mesh drawn here not necessarily represents the actual physical model, but is sufficient to illustrate the role of varying confinement size. Solute molecules are signified with ellipsoids, whose one end is
colored blue and preferentially interacts with the polymer chain, and the other end color colored red responsible for self-interactions. One example of such molecules is CBZ, with the blue end corresponding to the vinyl group on the azepine ring that interacts with the PEG subchain, and the red end corresponding to the carboxamide group, which dimerizes in CBZ crystals. The molar ratios of solute to monomer units constituting the polymer are drawn to scale, which are calculated from CBZ partitioning experiments. The relative size of the solute to the mesh size is also drawn to scale approximately for CBZ system. The relative fraction of solute molecules adsorbed to the polymer chain is estimated by assuming that the number of solute binding sites scales linearly with the PEG subchain length. The optimum mesh size for CBZ nucleation was found to be 1.1 nm (Table 6-1). Therefore the nucleus formation is illustrated in (b) as highlighted with yellow background.
Table 2-1. Summary of porous structure on polymer samples prepared with solvent ethanol. ....45 Table 2-2. Average nucleation induction times of aspirin with the presence of polymers with and
w ithout pores. ... 46 Table 2-3. Percentages of aspirin crystals in different orientations (hkl) on polymer films,
estimated from the XRD data by normalizing the measured peak intensities with the
reference peak intensities from the bulk sample. ... 52 Table 2-4. Qualitative correlations of the average nucleation induction time with the CNT
contact angle (0), polar component of polymer surface energy (yp) and percentage
hydrophilic surface area (%HSA) of the monomer used in synthesizing polymers...57 Table 3-1. Molecular level surface roughness of nanopatterned polymer films characterized by
A F M ... 6 7 Table 4-1. Properties of PEGMDA hydrogel microcuboids...84 Table 4-2. Average nucleation induction times of ASA with the presence of PEGDA microgels.
... 9 2 Table 4-3. Average nucleation induction times of ACM with the presence of PEGDA microgels.
... 9 3 Table 4-4. ASA average nucleation induction times (x) with PEGMDA microparticles of various
mesh sizes at higher supersaturation level...98 Table 5-1. Structural properties of PEGDA and PEGDA-co-AM hydrogels from SANS analysis.
... 1 10 Table 5-2. Average nucleation induction times of ASA with the presence of PEGDA-co-AM
m icrog els. ... 120 Table 5-3. Average nucleation induction times of ACM with the presence of PEGDA-co-AM
m icrog els. ... 120 Table 6-1. Effect of PEGMDA microgels on the average nucleation induction times and
polym orphic outcom es of CBZ. ... 141 Table 6-2. Average nucleation induction times of ROY in bulk and with PEG3oDA microgels.
... 15 3 Table 6-3. Average nucleation induction times of ROY with PEGMDA microgels, (M = 200-700
g/m o l)...153
Table 6-4. Percentages of ROY crystals in various orientations (hkl) on PEGmDA polymer films. ... 156
1. Introduction
1.1. Motivation and Objectives
It is essential to control crystallization in many areas of science and technology, such as the production of pharmaceuticals, pigments, concrete, semiconductors, optics, as well as the formation of biominerals. Everyday, there are more than 200,000 materials being crystallized all over the world. These materials can be divided into several categories, i.e., ionic crystals (e.g. salt), metallic crystals (e.g. iron), covalent crystals (e.g. diamond) and molecular crystals (e.g. aspirin). We are particularly interested in molecular crystals of pharmaceutical compounds, the crystallization process of which is very challenging to control compared with other types of crystals due to relatively weak intermolecular interactions and flexible molecular conformations.'
Crystallization starts with nucleation, the birth of a new phase, followed by crystal growth.2 Nucleation is the crucial step in controlling the crystallization process. Current industrial practice for the control of primary nucleation (nucleation from a system without pre-existing crystalline matter) during crystallization from solution involves control of supersaturation generation, impurity levels, solvent composition, agitation methods, etc. Nucleation behavior remains largely unpredictable, however, due to the presence of container surfaces, dust, dirt and other impurities. This is because, in most practical circumstances, crystallization starts with heterogeneous nucleation, which occurs at a foreign surface.24 -The presence of random impurities provides
heterogeneous nucleation sites, as such making the control and scale-up of crystallization processes difficult. Despite widespread occurrences of heterogeneous nucleation, mechanistic understanding is limited as for the role of a surface in the nucleation process, especially in a
Chapter 1 - Introduction
solution environment. My thesis aims to elucidate how various interfacial properties contribute to the nucleation activity of a substrate, for enabling rational design of substrates to control crystallization from solution. This knowledge is of broad technical implications. In particular, we intend to apply our learning to achieve reliable, efficient and economical pharmaceutical manufacturing process by engineering polymeric excipients to control the crystallization of pharmaceuticals.
Current pharmaceutical manufacturing process remains as a series of batch operations since late 19th and early 20th centuries, even though other industries have moved on to continuous manufacturing. A typical manufacturing chain can be divided into the upstream API (Active Pharmaceutical Ingredient) synthesis and the downstream pharmaceutical formulation, as shown in Figure 1-1. The downstream processes, comprised of solid-state operations, are particularly problematic. Specifically, the process operations are very sensitive to drug substance properties, which are constantly varying due to the upstream batch production mode. Consequently, the downstream processes are often plagued by poor controllability and final product uniformity. Moreover, process scaling-up, which is based on trial and error, is very costly and time-consuming. Motivated by this pressing need, Novartis-MIT Continuous Manufacturing Center aspires to transform the entire drug manufacturing chain into one seamlessly integrated continuous process (Figure 1-1). At the conjunction of the upstream API synthesis and the downstream continuous separation, my project seeks to heterogeneously crystallize API from solution on the surface of excipient, so that the subsequent API compaction, granulation, and blending with excipients can be ultimately eliminated. Furthermore, API nucleation kinetics and final crystal form, especially API polymorphs, can be tuned by controlling the excipient surface properties. Particularly, acceleration of API nucleation kinetics using designed excipients is
desired for the following reasons. First, it enables crystallization of API directly on or inside excipients to make API-excipient composite particles and helps minimize precipitation of API crystals from the bulk. Second, it facilitates the conversion of batch crystallization to the continuous mode. Crystallization from the bulk has been extensively used as a high yield and high purity separation step, but it is currently not amenable to continuous processing. This is because crystallization consists of several events with distinct time scales: sudden burst of nucleation following a long induction time, subsequent crystal growth and ripening. Besides, nucleation is extremely sensitive to experimental parameters, some of which are uncontrollable, such as the aforementioned impurity concentration, which has a huge impact on the induction time. Nucleation and crystallization on designed substrates has the promise to resolve these issues. The long induction time can be dramatically reduced using designed substrates to facilitate nucleation process. In addition, effective nucleation sites on the designed substrates render the impurities inactive, as such enhance the controllability of the process and make continuous processing possible.
Excipient
Chemical/ API Batch API Tableting/
Biological Solution Crystallization Crystals Granulation + Blending ' Encapsulation
Synthesis
Excipient
PI
Contiouis Continuous API-Excipient Tableting/
Solution CGrystUftatio 'Purification Composite Particles Encapsulation
Figure 1-1 Current (top) vs. envisioned (bottom) pharmaceutical manufacturing chain
Chapter 1 - Introduction
1. To elucidate the effects of key interfacial properties on nucleation for the purpose of rationally designing substrates for controlling crystallization from solution. The key surface properties include surface chemistry or interfacial interactions; surface
morphology, particularly nanoscopic features (>1 Onm); microstructures of the interface (<Onm).
2. To promote nucleation kinetics via design of substrates
3. To control API polymorphism by tuning interfacial properties 4. To shed light on the mechanism of heterogeneous nucleation
Bio-benign polymers are chosen as nucleation templating substrates, given the wealth of polymers among pharmaceutical excipients, with a wide range of functionality, and freely adjustable morphologies and microstructures. The API model compounds selected for nucleation kinetics study are aspirin and acetaminophen, both containing functional groups characteristic of many drug molecules. Aspirin predominantly crystallizes into monoclinic form (From I), and From II, the metastable form remains elusive.' Acetaminophen crystallization from solution also primarily yields the monoclinic Form I, the stable form, and special procedure was needed to obtain the orthorhombic Form 11.6 Therefore, both the systems are ideal for nucleation kinetics
study and the complexity of polymorphism can be avoided. For investigating polymorphism, carbamazepine and 5-methyl-2-[(2-nitrophenyl)amino]-3-thiophenecarbonitrile (ROY) were chosen as model compounds to represent both packing polymorphism (CBZ) and conformational polymorphism (ROY). CBZ possesses 4 known anhydrous forms, and ROY has 10 known forms with 7 structurally characterized.
1.2. Nucleation Theories
Nucleation is the birth of a new phase within a metastable medium. It is a first order phase transition involving an activation barrier. The kinetic theory of homogeneous nucleation from solution was originally developed by Volmer7 in 1939 by assuming a series of sequential 'reactions' between molecular clusters of size N and N+1. The theory thus developed conceptually resembles the Transition State Theory for describing chemical reactions, except that the complex at the 'transition state' is not a covalently bonded compound, but a supermolecular assembly associated via much weaker forces for molecular crystals. Therefore, the transition pathways for nucleation could be poorly defined," unlike those for chemical reactions, which result in one of the intrinsic deficiencies in the Classical Nucleation Theory. Nonetheless, it has been extensively applied till today, due to the lack of quantitative and generally applicable nucleation theories that better describe the physical phenomenon. Here, I briefly summarize the Classical Nucleation Theory below.
The Gibbs free energy change of the nucleation process incorporates contributions from the volume of the nucleus generated from the old phase, and from the new interface generated between the nucleus and the parent phase and other foreign surfaces, as described by
AG = AGVV, + yAni 1-1
Where V, is the volume of the nucleus, AG, the volume free energy change associated with the formation of the aggregate (negative) and AM is the area of the interface between the nucleus and the solvent or foreign surfaces, y, the corresponding interfacial free energy (positive). When its
size is small, the nucleus tends to diminish, because the interface term dominates due to a large surface area to volume ratio. When the nucleus reaches a certain critical size due to large density fluctuations in the metastable liquid, it has 50% of chance to continue its growth into a crystal,
Chapter 1 - Introduction
and this radius is referred to as the critical radius R*, corresponding to the critical Gibbs free energy change AG*.
The Gibbs free energy change of heterogeneous nucleation differs from the homogenous case as there is an additional interface between the nucleus and the substrate (Figure 1-2).
AGomo =-AGV +
yAN'-Yi
I = iquid
s - substrate
Figure 1-2 Schematic of heterogeneous nucleation from solution
AGe,r=AGn V + ynjA n + (y, - ys)As"
Yni cos6 = y,, - yn
AG* =AGm of(cos, r* /R)
The extra term (y,, - y )A, in equation 1-3 tells us that when there is stronger affinity between
the nucleus and the substrate as compared to the solvent and the substrate, heterogeneous nucleation is favored. The extent to which the energy barrier is lowered can be gauged using the f factor, which is the ratio of the critical Gibbs free energy changes in hetero-case and in homo-case (Equation 1-5). The f factor is a function of interfacial free energies, the shape and the curvature of the nucleus versus the substrate.
One of the limitations of the classical nucleation theory is its reliance on the concept of interfacial free energies, which assume sharply delineated nucleus interfaces. Because these interfaces become diffusive and ill-defined when the nucleus consists of only a few molecules, such as when the supersaturation is very high. In addition, the size of the nucleus is not necessarily the key and the only reaction coordinate to describe nucleation, according to recent publications by our group and other researchers.8 2 Particularly, the orientational order of molecules within the nucleus has not been accounted in the theory, which is another key factor dictating the crystal nucleation process. To overcome these limitations, other theories have been proposed, such as the phase field theory13, density functional theory, 15 and two-step nucleation
1-3
1-4 1-5
theory. 12,"i Especially, recent years have witnessed increasing volume of evidence supporting the two-step nucleation theory,17-19 which hypothesizes that the moleculer cluster formation via density fluctuations precedes the molecular re-orientation via structural flucturations, or more specifically, 'crystalline nucleus appears inside pre-existing metastable clusters of size several hundred nanometers, which consist of dense liquid and are suspended in the solution' .2' Besides, Molecular Dynamics and Kinetic Monte Carlo are also powerful tools to gain a molecular level understanding of the physical picture.8212 2
One of the main challenges preventing the quantitative formulation of a more physical nucleation model is that crucial questions, such as the actual shape and the interfacial features of the nucleus, or even whether the nucleus is more liquid like or resembles the final crystalline state, have not been hitherto fully addressed.17,23 24 The difficulty lies, at least partially, in the lack of powerful techniques for detecting and imaging nucleus formation at molecular level. Although direct observation of nucleation event has been reported recently for colloidal systems,1 8
,2 3 calcium carbonate,1 9,25 globular proteins,'7 there still exists a substantial hurdle to
observe nucleation events in small molecular systems.
1.3. Nucleation on Substrates
Nucleation on substrates has been studied in a wide range of systems, including inorganic, small organic molecules, protein and polymer systems. The substrates applied cover self-assembled monolayers or SAM,26-28 highly ordered pyrolytic graphite or HOPG 29 metal surfaces such as Ag, Pt,30 molecular single crystal substrates '.3s and crystalline or crosslinked polymer
surfaces.6,36
-39 Fine control over nucleation density, spatial pattern, crystal orientation etc has
been achieved for inorganic crystals,26 but when it comes to small organic molecules, which are
Chapter 1 - Introduction
difficult to achieve the same level of control as with inorganic crystals,40 and therefore the focus has been primarily on polymorph screening and selective crystallization.'4' It is one of my thesis objectives to take the level of control for organic molecules to a higher level, such as directing nucleation kinetics, by surface design.
Generally speaking, for crystalline or molecularly structured substrates, epitaxy relationship or lattice match between the nucleating phase and the substrate has been shown to play an important role, esp. when dispersive interactions dominate." Surfaces may also affect nucleation via polarization matching with the crystallizing molecule when both the surface and the crystal exhibit net dipole across the surface/crystal interface.4'43 For amorphous substrates in organic systems, there has been some effort to selectively crystallize polymorphs by tuning the polarity or hydrophobicity of side chains,,3639 but even the qualitative correlation was not clear, let alone
quantitative descriptions. This can be partially attributed to the fact that the crystallization condition and surface properties were not strictly controlled, such as uncontrolled evaporation rate of solvent, and the microscopic details of the surface morphology. In fact, the role of surface morphology is much less explored, owing to the technical challenges in tuning and controlling the surface features in a systematic manner on the length scale relevant to nucleation. Although there have been a few experimental studies on the surface morphology effect on nucleation,31,4,45
the level of control over the surface topology, particularly on nanometer scale, is far from sufficient to draw firm conclusions. Overall, there has been a lack of microscopic understanding on how the surfaces interact with the solute molecules and the role of other contributing surface properties to the nucleation process.
Recent advances in computational studies and high resolution imaging techniques have begun to shed light on the possible mechanism of surface-induced nucleation. One of the hypotheses is
that the surface enrichment effect of nucleating species contributes to nucleation promotion. A recent work from the Frenkel group46 has shown via Monte Carlo simulations that at a disordered
flat wall, a thin layer of protein is adsorbed that facilitated its nucleation near the wall, although the diameter of a critical crystal nucleus exceeds the width of the liquid layer. A similar conclusion was drawn from a previous computational study by Sear.4 7 Correspondingly, there have been experimental studies reporting, for instance, the presence of an organic film facilitated the densification of calcium phosphate pre-nucleation clusters on the film, which resulted in surface-induced nucleation.'9 Interestingly, the solute layer adsorbed to the surface was observed to nucleate in a planar fashion given the anisotropic nature of the solute molecule.17"18 When it
comes to the role of surface morphology, Page and Sear found by Monte Carlo simulation of Lennard-Jones molecules that nucleation in grooves formed by two intersecting planes is many orders of magnitude faster than on a flat surface," which provided an explanation to the popular practice of surface scratching for enhancing nucleation. Cacciuto and coworkers*9 used Monte Carlo simulations to show that freezing of hard sphere colloids is frustrated on curved surfaces, on which crystals cannot grow free of strain, and that the resulting defects increased the barrier to nucleation. The predicted surface curvature effect has been verified experimentally using spherical colloids as the crystallization system.50
Another area of increasing interest is nucleation in nanoscopic porous substrates .5'- Ha et al" showed that different polymorphs were obtained just by tuning the pore size. Frenkel53 reviewed that protein crystallization can be speed up by using seeds with disordered pores. Porous substrates are beneficial to us because the large surface to area ratio may make heterogeneous nucleation much more favorable, thus reducing the interference from bulk crystallization. Besides, dwelling inside the pore, API properties will hardly influence the downstream
Chapter 1 - Introduction
processing, which can greatly simplify the manufacturing process. In recent studies reported, the role of inner wall properties have largely been neglected. It is expected that by adjusting the pore size, pore shape and surface chemistry, a high level of nucleation control could be achieved.
2.
Role of Surface Chemistry in
Surface-Induced Nucleation
2.1. Introduction
The presence of interfaces can modify the nucleation process through various means, such as via favorable molecular interactions with the crystallizing molecule, and a lattice match between the substrate and the compound to be crystallized. In addition, surface morphology, especially porous structures, is also shown to play an important role in controlling nucleation kinetics"'s3
and polymorphism.5 2,s The epitaxy mechanism is well developed for nucleation on crystalline surfaces, such as self-assembled monolayers or SAMs,26.ss-s7 molecular single-crystal surfaces,3s crystalline polymer surfaces,58 etc. Relative to crystalline surfaces, amorphous surfaces such as crosslinked polymers, functionalized glass, and plastics are easier to fabricate. Furthermore, there is greater flexibility to achieve complex morphologies with various surface chemistries. Thus, amorphous surfaces have been explored extensively for the control of crystallization, especially polymorphism.'65 9'60 These studies have clearly demonstrated the important role of surface chemistry in heterogeneous nucleation, but there is little mechanistic understanding of how various surface chemistries lead to different nucleation outcomes. In addition, surface chemistry and morphology of amorphous surfaces often jointly determine the crystallization behavior. However, the contributions of these two factors are seldom quantified separately in molecular systems, and one of the two factors is often neglected when its contribution is not necessarily trivial. It is also worth noting that the role of surfaces in crystallization is rarely
Chapter 2 - Role of Surface Chemistry in Surface-Induced Nucleation
investigated from the perspective of nucleation kinetics, despite the fact that nucleation is inherently a kinetic process.
In this part of my thesis, I have successfully quantified the effect of surface chemistry on nucleation kinetics and investigated the underlying molecular interactions via crystal orientation study. I also established nucleation induction time statistics as a powerful tool to gain insight into the mechanism of nucleation on controlled surfaces. With the help of this tool, I distinguished quantitatively the effects of the surface chemistry and morphology on the activity of an amorphous surface in inducing nucleation. Furthermore, I found that nanoscopic pores with the right surface chemistry facilitated nucleation significantly.
Polymers synthesized with commercially available monomers were employed to provide a wide range of surface chemistries. The polymers were crosslinked to make rigid and amorphous surfaces, Crosslinking helps to stabilize the surface chemistry in a solution environment, to minimize solvent uptake and to avoid crystallinity so that the epitaxial mechanism is negligible. Aspirin was selected as the model compound to crystallize, since it contains the carboxyl group and the benzyl ring characteristic of many organic compounds, especially drug molecules.
2.2.
Experimental Methods
2.2.1. Initial Screening of Polymer Surfaces
The polymer films were synthesized by UV curing 1OO mixture of the monomer, the crosslinker ethylene glycol dimethacrylate (EGDMA) and the initiator IRGACURE 2022 sandwiched between a glass slide and a Teflon plate, with the glass slide facing the UV lamp. This configuration was adopted to avoid oxygen inhibition and surface oxidation. The molar ratio of monomer to EGDMA was 2:1. The concentration of IRGACURE 2022 was 3 v% with respect to EGDMA. UV irradiation was provided by 5000-EC UV Curing Flood Lamp
purchased from Dymax Corporation. The glass slide was silanized with vinyl trichlorosilane to yield a homogenous polymer film adhered to the glass substrate. After 4-8 min of UV irradiation depending on the polymers, the Teflon plate was removed to expose the polymer surfaces. The polymer films were then vertically immersed in 3mg/ml Aspirin-Toluene solutions and quenched from room temperature to 3C. After 18 hours, the polymer films were taken out of the solution and washed with toluene for three times and air dried to remove the loosely attached aspirin crystals.
2.2.2.
Nucleation Induction Time Measurement
The polymer synthesis procedure was modified from the one described in 'Initial Screening of Polymer Surfaces' catering to the specific requirement imposed by the nucleation induction time measurement. For initial screening, a large polymer surface area is necessary to achieve better statistics of nucleation area density, hence a large polymer film were synthesized (50 x 25mm2). For nucleation induction time measurement, much smaller polymer surface (5 x 5mm2) was needed in a large quantity, because 50-100 independent samples were required to obtain the probability distribution of induction time, and small solution volume was chosen to better control the impurity level in each sample so as to minimize crystallization from the bulk. Specifically, polymer plates were prepared by UV polymerizing a mixture of monomer, crosslinker divinylbenzene (DVB), initiator IRGACURE 2022, all dissolved in ethanol. The molar ratio of monomer to DVB was 2:1. The concentration of IRGACURE 2022 was 4 v% with respect to DVB. The volumetric ratio of ethanol to DVB was 2:1. 15 1 monomer solution was irradiated for 20min inside each Teflon holder under N2 protection. UV irradiation was provided by
5000-EC UV Curing Flood Lamp purchased from Dymax Corporation. After irradiation, the polymer plates were annealed at 700C in a vacuum oven for 4h to remove the residual solvent and
Chapter 2 - Role of Surface Chemistry in Surface-Induced Nucleation
unreacted monomer. For non-porous polymer synthesis, all conditions were kept the same, except for the absence of ethanol in the monomer mixture formulation. Once synthesized, each polymer plate was inserted together with the Teflon holder vertically into a iml Shell Vial containing 2001 38mg/ml Aspirin solution, 38v% Ethanol-Water mixture being the solvent. For each polymer sample, 48 vials were assembled and immersed in a thermostat stabilized at 2±0.1.*C, and the solution was quenched from 25*C to 2*C to achieve a supersaturation level of 4.2, where supersaturation is defined as the ratio of the initial solution concentration to the solubility at the crystallization temperature, and the solubility was expressed in mass of solute per volume of solution. The number of vials crystallized within time ti was counted and recorded at half-hour interval at the beginning of experiment and increased to two-hour intervals at later stage when the number vials crystallized significantly reduced. All the operations involving exposing polymer surfaces, Teflon holders, aspirin solutions and shell vials to the atmosphere were conducted inside the Bio Safety Cabinet, so that the possibility of impurity contamination was reduced to the lowest level. Other efforts to reduce impurity concentration were, cleaning of Teflon holders and Shell Vials before usage and filtration of aspirin solution with Acrodisc 0.2gm PTFE syringe filter.
2.2.3. Crystal Orientation Study
Polymer films were prepared following the same procedure as described before in the initial surface screening, and the formulation of monomer mixtures was the same as that used for making nonporous polymer plates in nucleation induction time study. After preparation, the polymer films were then immersed in 20mg/ml Aspirin solution in 38v% EtOH/Water mixture, and kept at 2*C for 7h. Numerous small crystals formed on the polymer films within this time. The sample was then rinsed with deionized water for three times to remove the loosely attached
crystals, then air blew to dry. Bulk crystals were prepared under the same condition and used as a reference. The experiment was repeated three times and all the samples were analyzed with XRD.
It is necessary to remove the loosely attached crystals because a small amount of plate-like aspirin crystals tend to adhere to both sides of the substrate via the largest (100) plane identified by the optical microscope. Hence, the (100) peak intensity in Figure 10 would be slightly higher without appropriate cleaning procedure. Since the crystals attached to both sides, front being the polymer film and back the bare glass, the backside was used as the control surface during the removal of loosely attached crystals from the polymer film, so as to make sure the washing procedure was repeated just enough times to remove crystals from the backside. We also characterized both sides of the samples with XRD before and after washing and confirmed the reduction of (100) peak intensity after washing was comparable for both sides, and that other peak intensities were not significantly affected.
2.2.4. Characterization
Polymer films were analyzed with Atomic Force Microscopy (AFM), X-ray Photoelectron Spectroscopy (XPS) and contact angles with five probing liquids to obtain information on surface morphology, surface chemistry and surface energy components, respectively. AFM images were obtained with a Dimension 3100's XY closed loop scanner (Nanoscope IV, VEECO) equipped with NanoMan software. Height and phase images were obtained in tapping mode in ambient air with silicon tips (VEECO). Only height images were shown in this paper. XPS spectra were collected with Kratos AXIS Ultra Imaging X-ray Photoelectron Spectrometer with a charge neutralizer and Al X-ray source. The polymer samples were surveyed for elemental analysis followed by high resolution spectra of C Is, 0 Is, and N Is peaks, the