HAL Id: hal-01939139
https://hal.archives-ouvertes.fr/hal-01939139
Submitted on 18 Jul 2019
HAL is a multi-disciplinary open access
archive for the deposit and dissemination of
sci-entific research documents, whether they are
pub-lished or not. The documents may come from
teaching and research institutions in France or
abroad, or from public or private research centers.
L’archive ouverte pluridisciplinaire HAL, est
destinée au dépôt et à la diffusion de documents
scientifiques de niveau recherche, publiés ou non,
émanant des établissements d’enseignement et de
recherche français ou étrangers, des laboratoires
publics ou privés.
centriole amplification and chromosome missegregation
Gaëlle Marteil, Adan Guerrero, André Vieira, Bernardo de Almeida, Pedro
Machado, Susana Mendonça, Marta Mesquita, Beth Villarreal, Irina Fonseca,
Maria Francia, et al.
To cite this version:
Gaëlle Marteil, Adan Guerrero, André Vieira, Bernardo de Almeida, Pedro Machado, et al..
Over-elongation of centrioles in cancer promotes centriole amplification and chromosome missegregation.
Nature Communications, Nature Publishing Group, 2018, 9 (1), pp.1258.
�10.1038/s41467-018-03641-x�. �hal-01939139�
Over-elongation of centrioles in cancer promotes
centriole ampli
fication and chromosome
missegregation
Gaëlle Marteil
1
, Adan Guerrero
1,11
, André F. Vieira
2,3
, Bernardo P. de Almeida
4,5
, Pedro Machado
1,12
,
Susana Mendonça
1,2,3
, Marta Mesquita
6
, Beth Villarreal
7
, Irina Fonseca
1
, Maria E. Francia
1,13
,
Katharina Dores
1
, Nuno P. Martins
8
, Swadhin C. Jana
1
, Erin M. Tran
field
9
, Nuno L. Barbosa-Morais
4
,
Joana Paredes
2,3
, David Pellman
10
, Susana A. Godinho
10,14
& Mónica Bettencourt-Dias
1
Centrosomes are the major microtubule organising centres of animal cells. Deregulation in
their number occurs in cancer and was shown to trigger tumorigenesis in mice. However, the
incidence, consequence and origins of this abnormality are poorly understood. Here, we
screened the NCI-60 panel of human cancer cell lines to systematically analyse centriole
number and structure. Our screen shows that centriole ampli
fication is widespread in cancer
cell lines and highly prevalent in aggressive breast carcinomas. Moreover, we identify another
recurrent feature of cancer cells: centriole size deregulation. Further experiments
demon-strate that severe centriole over-elongation can promote ampli
fication through both centriole
fragmentation and ectopic procentriole formation. Furthermore, we show that overly long
centrioles form over-active centrosomes that nucleate more microtubules, a known cause of
invasiveness, and perturb chromosome segregation. Our screen establishes centriole
amplification and size deregulation as recurrent features of cancer cells and identifies novel
causes and consequences of those abnormalities.
DOI: 10.1038/s41467-018-03641-x
OPEN
1Instituto Gulbenkian de Ciência, Oeiras 2780-156, Portugal.2I3S - Instituto de Investigação e Inovação em Saúde, Universidade do Porto, Porto 4200-135,
Portugal.3IPATIMUP - Instituto de Patologia e Imunologia Molecular, Universidade do Porto, Porto 4200-135, Portugal.4Instituto de Medicina Molecular,
Faculdade de Medicina, Universidade de Lisboa, Lisbon 1649-028, Portugal.5Departamento de Ciências Biomédicas e Medicina, Universidade do Algarve,
Faro 8005-139, Portugal.6Instituto Português de Oncologia de Lisboa, Lisbon 1099-023, Portugal.7Novartis Institutes for BioMedical Research, Boston, MA
02139, USA.8Advanced Imaging Facility, Instituto Gulbenkian de Ciência, Oeiras 2780-156, Portugal.9Electron Microscopy Facility, Instituto Gulbenkian de
Ciência, Oeiras 2780-156, Portugal.10Dana-Faber Cancer Institute, Boston, MA 02215-5450, USA.11Present address: Laboratorio Nacional de Microscopía
Avanzada, Instituto de Biotecnología, Universidad Nacional Autónoma de México (UNAM), Cuernavaca, Morelos 62210, Mexico.12Present address:
European Molecular Biology Laboratory, Heidelberg 69117, Germany.13Present address: Institut Pasteur de Montevideo, Montevideo 11400, Uruguay.
14Present address: Molecular Oncology, Barts Cancer Institute, Queen Mary University of London, London EC1M 6BQ, United Kingdom. Correspondence and
requests for materials should be addressed to G.M. (email:gaelle.marteil@gmail.com) or to M.B.-D. (email:mdias@igc.gulbenkian.pt)
123456789
C
entrosomes are the major microtubule organising centres
(MTOCs) of animal cells participating in signalling, cell
division, polarity and migration
1–3. Each centrosome
comprises two centrioles surrounded by a proteinaceous matrix,
the pericentriolar material (PCM), which confers the microtubule
(MT) nucleation capacity
4. Centrioles are microtubule-based
cylinders and their structure, length (≈450 nm) and number (4 in
mitosis) are tightly controlled in non-transformed cycling cells,
the latter being deregulated in cancer
5. Centrioles duplicate in S
phase, with the formation of a new centriole next to each
pre-existing one, that subsequently elongates until mitosis
6–8. The two
newly formed centrosomes migrate to opposite poles during
mitosis, contributing to bipolar spindle formation and
appro-priate chromosome segregation.
Centrosomes were identified more than one century ago by
Van Beneden
9and Boveri
10who
first proposed a key role for
centrosome amplification (>2 centrosomes per cell) in promoting
aneuploidy and tumorigenesis
11. Accordingly, abnormalities in
centrosome structure and number have been detected in various
tumours since the nineties and associated with genomic
instability and poor prognosis
5,12–15. However, these small
structures remained understudied until the advent of sensitive
proteomics and RNAi screens, which identified their components.
Manipulation of their expression uncovered novel functions for
centrosome amplification in promoting features of tumorigenesis,
namely chromosomal instability and invasiveness
16,17. Moreover,
centrosome amplification was recently shown to trigger
tumor-igenesis in vivo
18. Finally, while non-transformed cells normally
die or stop proliferating after abnormal mitosis due to
centro-some amplification, cancer cells use mechanisms to cope with this
abnormality
19. With these
findings, centrosome amplification and
associated survival mechanisms became appealing targets in
cancer therapy. Presently, drugs that either prevent centrosome
duplication (i.e. a PLK4 inhibitor
20) or target centrosome
amplification survival mechanisms (i.e. HSET inhibitors
21,22) are
in clinical trials or under development, respectively.
However, the identification of centrosome amplification origins
and frequency among and within different tumours is critical for
its clinical exploitation. Until now, cell division failure and
deregulation of the centrosome duplication machinery are the
two main mechanisms known to experimentally induce
centro-some amplification
23. However, their relative contributions are
not known in cancer, mostly due to technical challenges of
studying such small structures. In addition, the research
Primary screening Secondary screening
Validation on selected cell lines
DAPI α-Tub Cent CP110 Cent CP110
“Z” stacks
1 2 3
5
6 7
Validate and curate DATA Automatically count centriole
number and measure length in 3D
Split centrioles
4 - Segmentation of the centrioles in 3D from the “Z” stacks
Identify centrioles in 2D using centriolar markers Identify mitotic
cells
DAPI Centrin α-Tub Centrin
“Z” maximum intensity projection
Centrin CP110
a
b
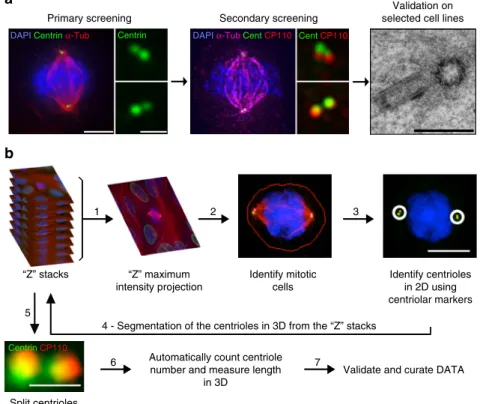
Fig. 1 Quantifying centriole number and length in cancer cells. a Screen overview. Step 1 and 2: primary and secondary immunofluorescence screenings of
centrioles in the NCI-60 cancer cell lines using centrin (green) and centrin/CP110 (red) as centriolar markers, respectively. For each screening, we visually selected 50 mitotic cells per each of the cell lines and programmed the microscope to automatically acquire images as Z-stack using a ×100 objective. Cells
were also stained with DAPI (blue) andα-tubulin antibody (red-primary screening, magenta-secondary screening). Scale bar 5 µm, insets 1 µm. Since
centriole dimensions (250 nm width and 400 nm length) are close to the resolution limit of light microscopy, we selected some cell lines with extreme phenotypes for validation and further investigation, using transmission electron microscopy (TEM), scale bar 500 nm. Please note that all the pictures
presented are from a non-cancerous cell line, RPE-1, used as a negative control in this study.b Overview of the semi-automatised quantitation of centriole
alterations. Briefly, maximum intensity projections, obtained from all the stacks collected per field of view, were created (step 1) and mitotic cells were
automatically segmented from a background of interphasic cells using a spatial correlation coefficient based on both DAPI and α-tubulin signals, both of
which are brighter in mitotic cells (step 2). Subsequently, centrioles were individually segmented using the centrin staining of each mitotic cell (step 3). In
the secondary screening, centrioles were independently identified using both centrin and CP110 staining, and only the structures where these two different
markers co-localised were kept for further analysis. Once identified in the 2D projections, all centrioles were segmented in three-dimensions (3D),
automatically split into individual centrioles and measured in 3D (steps 4, 5 and 6). The number of centrioles per mitotic cell and their individual lengths
were stored, together with a gallery of annotated images (see outputs of steps 2 and 3 for examples). These galleries were verified and manually curated
performed in this area is hindered by: (i) the heterogeneity of
methods to study centrosomes, precluding comparisons between
studies, (ii) the quantification of centrosome alterations is biased
by the limited thickness of paraffin-embedded tissue samples
12.
In view of these limitations, a systematic survey of centriole
abnormalities is imperative.
To assess the frequencies of centrosome abnormalities at the
single cell level amongst different cancer types, we chose the
NCI-60 panel of human cancer cell lines, derived from nine distinct
tissues, as a repository of cancer diversity
24,25. Importantly,
sev-eral parameters, critical for a cohesive understanding of the origin
and consequences of centrosome abnormalities in cancer, have
been characterised in this panel, including: p53, ploidy status and
RNA expression
25–30. Here, we develop a pipeline to
semi-automatically measure centriole number and length in mitotic
cells. We
find that, in addition to centriole amplification,
dereg-ulation of centriole length is a recurrent feature of cancer,
pro-moting centriole amplification via both centriole fragmentation
No amplification
Amplification
DAPI Centrin Tubulin
Control HT29 SN12C
COLO205 MDA-MB-435 HOP-92
1 2 1 2 2 2
MDA-MB-435 ss1 MDA-MB-435 ss2 MDA-MB-435 ss3
MDA-MB-435 ss4 MDA-MB-435 ss5 MDA-MB-435 ss6 SN12C Control 1 2 2 2 3 4 4 5 5 6 7 6 8 6 8 1 2 1 2 1 2 1 2 3 1 2 3 4 1 2 1 3 1 2 1 3 4 1 2 Cent CP110
Percentage of cells with centriole amplification
( 5–8 and >8 centrioles per cell)
BR:HB2 RPE-1 SK:HaCat CO:LT97 LU:SAEC KI:UO-31 CNS:SF-268 LU:NCI-H522 LU:A549 BR:MCF7 SK:M14 OV:NCI-ADR-RES CNS:SF-295 KI:TK-10 CO:HT29 CO:HCT-116 SK:UACC-62 PR:PC-3 OV:IGROV1 KI:786-0 LC:EKVX BR:T47D CNS:SNB-19 SK:SK-MEL-2 OV:OVCAR-8 LU:NCI-H460 CO:SW-620 KI:SN12C KI:ACHN CNS:SNB-75 SK:SK-MEL-28 BL:SR BR:MDA-MB-231 OV:OVCAR-3 SK:UACC-257 PR:DU-145 OV:SK-OV-3 KI:CAKI-1 BL:K-562 OV:OVCAR-4 CNS:U251 BL:MOLT-4 CNS:SF-539 BR:MDA-MB-468 CO:HCC-2998 BR:BT-549 LU:HOP-92 BL:RPMI-8226 BL:CCRF-CEM SK:MDA-MB-435 KI:RXF-393 BR:HS578T LU:NCI-H322M LU:NCI-H23 SK:MALME-3M BL:HL-60 CO:COLO205 LU:HOP-62 1310 0 20 30 40 50 60 70 Centriole amplification Non-cancerous
a
b
c
and ectopic procentriole formation. Centriole over-elongation
also induces the formation of enlarged centrosomes, with
increased MT nucleation capacities, enhancing chromosome
missegregation. Altogether, our work establishes centriole
amplification and over-elongation as important features of cancer
biology, the latter enhancing MT nucleation and chromosomal
instability (CIN), two known tumorigenic features. Moreover, our
extensive overview of centriole defects in the NCI-60 panel,
combined with the publicly available information on its gene
expression and drug resistance, will allow further insights on
centriole regulation and the development of clinical applications
based on centriole aberrations.
Results
A semi-automated survey of centriole abnormalities. To assess
the frequencies of centrosome defects in different cancers, we
designed a semi-automated and systematic survey to quantify
both centriole number and length in the NCI-60 panel of cancer
cell lines (Fig.
1a). Given their small size, we developed an
algorithm to quantify and measure centrioles in 3D (Fig.
1b and
Methods). As both centriole number and length vary throughout
the cell cycle, we analysed only mitotic cells, which have a
fixed
number (4) of fully elongated centrioles.
We performed a primary screening to rapidly estimate the
penetrance of centriole amplification and over-elongation. We
used centrin to count and measure centrioles as it localises early
to the distal end of centrioles, maximising their detection.
Furthermore, centrin has been successfully used (i) in
centriole-related screens
31, (ii) to track centrioles by live imaging
32, (iii) to
score centrosomal defects in cancer
12and (iv) as a readout for
centriole size
33. Our results show that, while non-transformed
cells (human retinal pigmented cells, RPE-1) display no centriole
amplification, cancer cell lines have variable degrees of this
abnormality (from 5.6 to 90.7% of cells with >4 centrioles,
Supplementary Table
2). A total of 14 cell lines exhibit less than
15% of cells with amplification, 17 display between 15 and 30%
and 29 have more than 30% of amplification. Centriole size is also
controlled and rather homogeneous in non-transformed cells
(ref.
34, RPE-1 show no over-elongation), but surprisingly variable
in the NCI-60 panel (from 0 to 51.7% of cells with overly long
centrioles, i.e. longer than 500 nm-twice the length of a
normal-length centriole measured using centrin staining, Supplementary
Table
2). A total of 49 cell lines exhibit less than 15% of cells with
over-elongation, 7 display between 15 and 30% and 4 have more
than 30% of over-elongation.
Although centrin is a widely used marker of all centrioles, false
positives may arise as centrin can be present in centriolar
satellites, small electron-dense granules
35,36, justifying the need of
a validation screening. For this, we selected the top 50% of cell
lines of amplification and over-elongation (35 cell lines) and a
subset (18) of the less-defective ones to investigate the presence of
false negatives (Supplementary Table
2). We used centrin in
combination with a second centriolar marker, CP110, to reliably
label centrioles (Supplementary Fig.
1a) and only accounted
structures positive for both markers. With this strategy, we
identified cells with and without centriole amplification or
over-elongation (Figs
2a and
3a). Finally, to define the cut-off and
estimate the variability of centriole amplification and
over-elongation in non-cancerous cells, we quantified centriole
number and length in 5 non-cancerous cell lines from different
tissues: RPE-1, HB2, HaCat, LT97 and SAEC (Figs
2b and
3b).
On average, 7% ± 3 and 1% ± 2 of cells display centriole
amplification and over-elongation, respectively, in these cell lines.
Therefore, we set the cut-off for centriole amplification and
over-elongation to 13% and 5%, respectively (average
+ 2 s.d.). The
outputs of the secondary screening are depicted in Figs
2b and
3b.
Several cell lines included in the top 50% of amplification or
over-elongation in the primary screening did not significantly display
these anomalies in the secondary screening (Supplementary
Table
2). This inconsistency might be due to: (i) lack of sample
and/or counts reproducibility, (ii) centrin labelling satellites
besides centrioles or (iii) the presence of CP110-negative
centrioles. To address this, we compared the automated centrin
counts between both screenings in four cell lines displaying high
discrepancies between screenings and observed their similarity
(Supplementary Fig.
1b). CP110-negative and centrin-positive
structures are negative for other centriolar/centrosomal markers
in SN12C cell line, which displays the highest discrepancy
between screenings (Fig.
2a and Supplementary Fig.
1a). Finally,
while validating our screening by TEM (Fig.
3c, d), we observed
cells displaying supernumerary centrioles in MDA-MB-435 cell
line (positive control for amplification) but never in SN12C
(Fig.
2c). These data suggest that centrin labels other structures
than centrioles in SN12C cell line, and likely in the other cell lines
displaying high discrepancies between the two screenings.
Altogether, our observations demonstrate that centrin-positive
structures, which are negative for a second centriolar/centrosomal
marker, are unlikely bona
fide centrioles, validating the results of
the secondary screening.
Centriole number and size are often increased in cancer. Our
secondary screening confirms that non-transformed cells display
low levels of centriole amplification (≈7%; Fig.
2b). Our data also
shows that approximately half of the cancer cell lines (28) display
more than 13% of amplification, threshold established based on
our controls, suggesting this abnormality is widespread. The
Fig. 2 Centriole amplification is widespread in cancer cells. a Immunofluorescence images of cell lines without (upper panel) and with (lower panel)
centriole amplification. Cells were stained with DAPI (blue), centrin (green), α-tubulin (red) and CP110 antibodies (red-insets). Scale bar 5 µm, insets 1 µm.
Note the presence of centrin dots lacking CP110 staining in the SN12C cell line (upper panel-inset 1).b Output of the secondary immunofluorescence
screenings for centriole number in the NCI-60 panel. To validate the primary screening, the top 50% of amplification and a subset of less-defective ones
from the primary screening were incorporated in the secondary screening (see text). The results of the secondary screening are depicted in the bar graph
in which cell lines were ranked according to their percentage of mitotic cells with more than four centrioles. To define the cut-off for centriole amplification
and the variability of centriole number in non-cancerous cell lines, we quantified centriole number in five non-cancerous cell lines (depicted in green): RPE-1
(retinal pigmented epithelial cells), HB2 (mammary luminal epithelial cells), HaCat (keratinocytes), LT97 (colon adenoma cells) and SAEC (small airway
epithelial cells). The average percentage of cells with centriole amplification in the non-cancerous cell lines is 7 ± 3%, therefore we set the cut-off for
centriole amplification to 13% (average + 2 standard deviations). 28 cell lines from the NCI-60 panel displayed significant centriole amplification. Note that
for most of the cell lines, the majority of cells with amplification showed 5 to 8 centrioles per cell (grey). Cells with more than eight centrioles per cell (red) were less commonly observed. A total of 50 to 60 mitotic cells were analysed per cell line. BR breast, CNS central nervous system, CO colon, BL blood, LU
lung, PR prostate, KI kidney, OV ovaries and SK skin.c TEM images of control (RPE-1) and SN12C cells with normal number of centrioles (2), and a
MDA-MB-435 cell with supernumerary centrioles (8). Each TEM picture represents an individual cell for the control and SN12C cell lines, whereas the remaining pictures are serial sections of the same MDA-MB-435 cell. Scale bar 500 nm
remaining cell lines display lower levels of centriole amplification,
similarly to non-cancerous cells (Fig.
2b). Centriole amplification
is always present in at least one but never in all cell lines
origi-nating from the same tissue, suggesting this feature is
tumour-specific rather than tissue-tumour-specific (Supplementary Table
2
and
Supplementary Fig.
2).
In addition, we observed that 22 cell lines display
significant centriole over-elongation compared to
non-cancerous cell lines (Fig.
3b and Supplementary Table
2).
Cell lines with higher levels of centriole over-elongation
belong to breast, skin and lung cancer (Supplementary
Fig.
3).
Normal length Overly longa
b
Variance-to-mean ratio (nm) Mean centriole length (nm)
RPE-1
BR:HB2 CO:LT97 SK:HaCaT LU:SAEC CO:HT29 KI:UO-31 KI:ACHN
SK:UACC-257 OV:OVCAR-3
LU:A549
OV:NCI-ADR-RES
OV:SK-OV-3 LU:NCI-H460 KI:TK-10 BR:T47D KI:786-0 LU:EKVX BL:K-562
CNS:U251 CNS:SNB-19 CO:SW-620 CNS:SF-268 BL:SR PR:DU-145 CO:COLO205 CNS:SNB-75 PR:PC-3 OV:OVCAR-8
LU:NCI-H322M CO:HCC-2998 BL:CCRF-CEM
SK:M14 BR:MDA-MB-468 KI:CAKI-1 LU:NCI-H522 BR:MCF7 BL:MOLT-4 BL:RPMI-8226 OV:IGROV1 CNS:SF-539 BL:HL-60 BR:MDA-MB-231 SK:SK-MEL-2 CNS:SF-295 BR:BT-549 BR:HS578T SK:UACC-62 OV:OVCAR-4 SK:SK-MEL-28 CO:HCT-116 KI:SN12C LU:HOP-92 KI:RXF-393 SK:MALME-3M LU:NCI-H23 LU:HOP-62 SK:MDA-MB-435 50 40 30 20 10 5 0 DAPI Centrin Tubulin
HOP-62 H23 MDA-MB-435 Centrin CP110 Centrin CP110 UACC-257 ACHN Control 400 380 360 340 320 300 280 260 70 60 50 40 30 20 10 0 140 130 * * * * C 0 500 1000 1500 2000 2500
Centriole length by TEM (nm)
HOP-62 MDA-MB-435 MDA-MB-435 HOP-62 SN12C Control SN12C Control **** **** ***
% of cells with overly long centrioles
Non-cancerous Centriole over-elongation Low variability in length High variability in length
c
d
Our results suggest that increase and variability in centriole
length are novel recurrent features in cancer. Given the presence
of several long centrin-positive structures in some cancer cell
lines, we wondered whether these threads could represent
abnormal centrin-positive cilia rather than bona
fide centrioles.
Nearly all centrin-positive structures are negative for ARL13B (a
cilia marker
37) and positive for acetylated tubulin (a stable MTs
marker), therefore confirming the centriole nature of centrin
threads (Supplementary Fig.
4). For a
final validation, centriole
length was measured by TEM in 4 cell lines: the non-cancerous
RPE-1 cells, and three cancer cell lines displaying increased levels
of centriole over-elongation: SN12C, HOP-62 and MDA-MB-435
(Fig.
3b). While centriole length did not exceed 500 nm in RPE-1
cells, we observed slightly longer centrioles in SN12C, long and
very long ones in HOP-62 and MDA-MB-435, respectively
(Fig.
3c, d). As expected, centrioles appear longer by TEM (e.g.
mean of 421 nm in RPE-1) than by immunofluorescence (IF,
mean of 277 nm) since centrin is restricted to the medium-distal
part of centrioles. Nevertheless, the TEM results mimic the IF
data as both show a significant increase in centriole length in the
3 cancer cell lines compared to the control, with SN12C and
MDA-MB-435, the least and the most deregulated ones. Our
TEM data further corroborates the IF results as centriole length
appears homogeneous in RPE-1 (VMR
= 2) and SN12C (VMR =
4.5) cells but very heterogeneous in the two cell lines displaying
very long centrioles, HOP-62 (VMR
= 51.9) and MDA-MB-435
(VMR
= 280.3; Fig.
3d). Altogether, the TEM data validates our
IF survey of centriole length which established increase and
variability in centriole length as novel and recurrent features of
cancer cells.
The variability in centriole length was often higher in cell lines
with overly long centrioles, (Fig.
3b). This can both reflect
inter-cellular (only a subpopulation of cells is affected by centriole
over-elongation) and/or intra-cellular variabilities (only one
centriole in each cell is affected). To address this, we analysed
the distribution of the number of overly long centrioles per cell in
the NCI-60 secondary screening. Cells displaying centriole
over-elongation have mostly only one (87%), sometimes two (11%)
and rarely more than two (2%) elongated centrioles, feature
further validated in MDA-MB-435 cells (Supplementary Fig.
5a,
b). This intra-cellular heterogeneity might reflect that only certain
centrioles are permissive to centriole over-elongation. Each
cycling cell in mitosis has three generations of centrioles: the
grandmother (the eldest), the mother, generated in the previous
cycle, and
finally, the daughters, born in the present cycle
38. We
investigated if all generations of centrioles were equally affected
by centriole over-elongation using a marker of all centrioles
(acetylated tubulin) and a daughter-specific marker (STIL). In
MDA-MB-435 cell line, centriole over-elongation rather affects
mother/grandmother (98%) than daughter centrioles
(Supple-mentary Fig.
5c, d). Further staining, using the appendages
(structure of grandmother centrioles) protein CEP164, suggests
that centriole over-elongation likely affects mainly grandmother
centrioles in MDA-MB-435 cell line (Supplementary Fig.
5e).
High centriole amplification in aggressive breast cancer.
Clas-sification into distinct molecular subtypes based on expression
analysis
39,40is increasingly used to establish prognosis and to
predict treatment response in several cancers, e.g. in breast
can-cer
41. Interestingly, all cell lines representing the basal breast
cancer molecular subtype display significant centriole
amplifica-tion (MDA-MB-231 (15%), MDA-MB-468 (24%), BT549 (25%)
and HS578T (33%)) while luminal cancer cell lines do not (MCF7
(5%) and T47D (9%); Fig.
2b, Supplementary Fig.
2
and
Sup-plementary Table
2).
In addition, centriole amplification is associated with the most
common subset of colon carcinoma, CIN (chromosome
instabil-ity, microsatellites stable), as it was detected in some of these cell
lines (HCC-2998 and COLO205), but absent in all MSI-H cell
lines (microsatellites instability, hyper-mutated), 15,
HCT-116 and KM12 (Supplementary Fig.
2
and Supplementary
Table
2). Our results suggest that centriole amplification is more
prevalent in specific subtypes of breast and colon cancer, which
are both associated with chromosome instability and worse
prognosis
42,43.
We validated these
findings in human breast using 15 hormone
receptor positive (luminal) and 10 hormone receptor negative
(basal-like) carcinomas (Fig.
4). Similar to cultured cells, we
observed a higher percentage of cells with supernumerary
centrioles in basal-like breast carcinomas (22%) than in luminal
ones (8%; Fig.
4b, Supplementary Fig.
6
and Supplementary
Table
2). Our patient data supports the results of our systematic
survey demonstrating that centriole amplification is more
frequent in basal-like than in luminal human breast carcinomas
suggesting that centriole amplification specifically occurs in more
aggressive molecular breast tumour subtypes.
Centriole amplification, p53 loss and ploidy deregulation. The
strongest molecular association shown with centrosome
amplifi-cation is loss of p53 function
5,44,45. To test this, we used the
publicly available p53 status of the NCI-60 panel (Supplementary
Table
2
29). p53 is mutated in 80% of the cell lines and most of the
cell lines displaying centriole amplification exhibit impairment of
p53 function (24/28 cell lines). Nevertheless, this proportion is
not statistically different from the one observed in cell lines
Fig. 3 Increase and variability in centriole length are recurrent in cancer cell lines. a Immunofluorescence images of cell lines without (upper panel) and
with (lower panel), centriole length deregulation. Cells were stained with DAPI (blue),α-tubulin (red), centrin (green) and CP110 (red-insets) antibodies.
Scale bar 5µm, insets 1 µm. b Output of the secondary screening for centriole length in the NCI-60. To validate the primary screening, the top 50% of
over-elongation, and a subset of the less-defective ones, were processed in the secondary screening. The results of the secondary screening are depicted in the bar graph (cell lines are ranked according to their percentage of mitotic cells containing at least one overly long centriole). The mean centriole length (blue) and the variance-to-mean ratio (VMR-red), a normalised measure of the dispersion of the distribution, are depicted for each cell line. The cut-off for centriole over-elongation (in green) was set to 5% which corresponds to the average percentage (1%) of cells with centriole over-elongation in the 5
non-cancerous cell lines plus 2 s.d. (2%). 22 cell lines display significant centriole over-elongation. Centriole length was scored in 3D using centrin staining.
From 207 to 388 centrioles were measured per cell line. The magenta asterisks label the cell lines that were selected for analysis by TEM.c TEM images of
longitudinal sections of normal-length centrioles (around 500 nm) in the control (RPE-1) and SN12C cell lines, and of overly long centrioles in HOP-62 and MDA-MB-435 cell lines (740 and 1800 nm, respectively). Note the presence of a crack (arrow) in the overly long centriole of MDA-MB-435 cell. Each
TEM picture represents an individual cell. Scale bar 500 nm.d Quantification of centriole length, using the Image J software, from TEM images of
longitudinal sections of different centrioles for the control (#22, median= 427 nm, VMR = 2.7), SN12C (#20, median = 486 nm, VMR = 4.5), HOP-62
(#25, median= 502 nm, VMR = 51.9) and MDA-MB-435 (#23, median = 546 nm, VMR = 280.3) cell lines. The bar represents the mean ± s.d.
without significant amplification (Supplementary Fig.
7a).
Inter-estingly, almost half of the p53 MT cell lines show no increase in
centriole number (18/42, Supplementary Table
2), suggesting that
loss of p53 is not sufficient to cause centriole amplification.
Centriole amplification may arise from cytokinesis failure,
mitotic slippage and/or cell fusion
23, all of which would also lead
to severe ploidy deregulation. Mild ploidy deregulation might also
arise from centrosome amplification as the latter induces the
formation of lagging chromosomes
17,46. We wondered whether
centrosome amplification correlates with ploidy deregulation,
modal chromosome number, numerical chromosome changes
and number of structural chromosomal rearrangement
30,47(Supplementary Table
2). All these parameters define the
karyotypic complexity and heterogeneity of each of the NCI-60
cell line and none of them is correlated with centriole
amplification (Supplementary Fig.
7b, c). However, 64% of the
cell lines with centrosome amplification show ploidy
deregula-tion, suggesting that events affecting both ploidy and centrosome
number, such as cytokinesis failure, might induce centriole
amplification in some cancers (Supplementary Table
2).
Centriole over-elongation drives centriole amplification. As
both centriole amplification and over-elongation are widespread
in our screen, we investigated their interdependency and observed
their correlation (Supplementary Fig.
8). Additionally, the
pro-portion of long centrioles in cells with centriole amplification is
statistically different from the expected proportion under the null
hypothesis of independence, therefore supporting that centriole
over-elongation and amplification are not independent (Fig.
5a).
This correlation might reflect that centriole over-elongation
triggers amplification, as suggested upon experimentally induced
centriole
over-elongation
in
the
osteosarcoma
cell
line,
U2OS
48,49. To further substantiate this direct link in the NCI-60
panel, we overexpressed CPAP, a promoter of centriole
elongation
48, in two cancer cell lines without significant
ampli-fication and over-elongation, T47D and SF268. The percentage of
mitotic cells with amplification is significantly increased upon
CPAP overexpression (from 4% ± 1 to 26% ± 7 for T47D and
from 3% ± 1 to 28% ± 7 for SF268; Fig.
5b) therefore confirming
that over-elongation triggers amplification.
Centriole over-elongation might induce amplification via
ectopic procentriole formation
48,49. Moreover, it was suggested
that overly long centrioles, may fragment
48, which we tested by
inducing centriole over-elongation using CPAP overexpression in
U2OS cells (Supplementary Fig.
9). While maximum centriole
length is achieved at the onset of overexpression, a decrease in
length together with an increase in centriole number are then
observed (Supplementary Fig.
9a, c). This negative correlation
supports that centriole over-elongation induces amplification,
perhaps through fragmentation. To confirm this, we prevented
centriole biogenesis by inhibiting its master regulator, PLK4, with
centrinone B
50, which drastically diminishes centriole number
(Supplementary Fig.
9d). Remarkably, CPAP overexpression
partially rescues centrinone B treatment with some cells even
displaying supernumerary centrioles (Supplementary Fig.
9d).
Centrosome amplification via over-elongation is therefore
partially independent of centriole biogenesis, but relies partly
on fragmentation (Supplementary Fig.
9d), which was further
corroborated at the ultra-structural level by TEM (Supplementary
Fig.
9e).
We then investigated if centriole fragmentation and ectopic
centriole formation occur in the NCI-60 panel using two cell lines
displaying high degree of centriole over-elongation,
MDA-MB-435 and HOP-62. We examined centriole structure using TEM
and Structured Illumination Microscopy (SIM), the latter using
acetylated tubulin as a centriole barrel marker. With SIM, we also
investigated procentriole nucleation sites using STIL staining.
While only normal-length centrioles with a proper barrel shaped
structure are visible in non-cancerous cells line (Fig.
5c, upper
Dapi Pericentrin GT335 GT335 Pericentrin 0 10 20 30 40 Luminal Basal
% of cells with centriole amplification per patient
***
Basal
Luminal
b
a
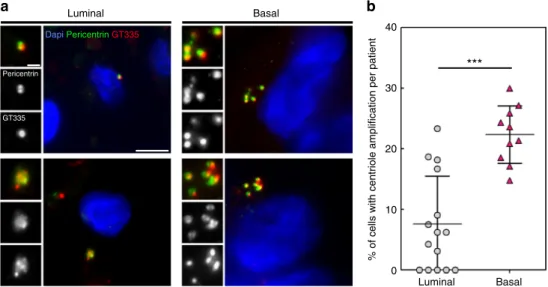
Fig. 4 Basal-like human breast carcinomas display more centriole amplification than luminal breast carcinomas. a Representative immunofluorescence
images of sections of human breast tumours showing normal centriole number (2) in interphasic cells of luminal breast carcinoma (upper left panel), and
centriole amplification (>4), in both luminal (lower left panel) and basal-like (right panel) breast carcinomas. We labelled centrioles using the centriolar
marker GT335, which labels tubulin glutamylation, a modification of tubulin present in centrioles, in co-localisation with the PCM marker, pericentrin.
Tissue sections were also stained with DAPI (blue). Please note that we focused our analysis on interphase cells, as it is very difficult to find mitotic figures
in breast tumours. Scale bar 5µm, insets 1 µm. b Percentage of cells displaying centriole amplification in each of the 15 patients with luminal breast
carcinomas (average 8% ± 2) and in each of the 10 patients with basal-like carcinomas ((on average 22% ± 2),p = 0.0004, Mann–Whitney test). Please
note that only structures positive for both pericentrin and GT335 were taken into consideration to avoid false positives. All basal-like carcinomas (10 out of
10 patients) exhibited centriole amplification while it was not detected in 5 out of the 15 luminal carcinomas. Between 20 and 133 cells were analysed for
panel), we observed asymmetrically elongated centrioles in
MDA-MB-435 cells, (Fig.
5c, middle panel), which often contain breaks
(see Fig.
5c, middle panel, lower TEM picture). This result
suggests either that only some of the MTs from the barrel have
been extended or that overly long centrioles are poorly stable and
break. Branched and opened centrioles at the tips were also
visualised by SIM in MDA-MB-435 and HOP-62 cells
(Supple-mentary Fig. S10a, b, panel (ii)). These data show that overly long
centrioles often exhibit abnormal, and likely unstable, structures
at their distal ends. Interestingly, we found evidences of centriole
fragmentation by SIM in MDA-MB-435 (fragment which were
neither procentrioles (STIL-negative) nor mother centrioles (not
associated to a nascent procentriole, unlike other centrioles in the
same cell; Fig.
5c, lower panel, insets 2). Centriole fragmentation
was also observed in HOP-62 cells (fragments emanating from
long centrioles; Supplementary Fig.
10b, panel (iii)). This was
further confirmed by TEM in MDA-MB-435 cells with the
presence of centriole fragments surrounding a centriole with a
markedly abnormal tip, (Fig.
5c, dotted boxes of Ai, Aii and Aiii).
Induced centriole over-elongation triggers amplification via
ectopic procentrioles formation
48,49. Normally, only one
procen-triole forms close to each mother cenprocen-triole proximal-end in
control cells (STIL-positive centriole, Fig.
5c, upper panel).
Strikingly, we observed that 4% of the overly long centrioles of
MDA-MB-435 cells nucleate multiple procentrioles along their
length (asterisk in inset 3 of SIM picture of Fig.
5c and
Ac-Tubulin
STIL
Control
MDA-MB-435
MDA-MB-435
DAPI Ac-Tubulin STIL
*
*
*
1 2 2 3 3 1 Ai Bi Bii Biii Biv Aii Aiiib
Normal-length centrioles Overly long centrioles
c
a
T47D control T47D CPAP SF268 control SF268 CPAP Expected Observed Expected Observed No CA CA No CA CA No CA No CA CA CA 0 10 20 30 40 50 Control CPAP T47D T47D SF268 SF268 * * 0 25 50 75 100 1.54% 1.54% 1.13% 2.53% 100 99 98 97 96Chi-squared test of independence p < 0.0001
DAPICentrin α-Tub
% of centrioles
Supplementary Fig.
10c), a phenomenon further confirmed by
TEM (asterisk in the EM pictures Biii and Biv of Fig.
5c). Our
study discovered two novel sources of centriole amplification in
some cancer cells: centriole fragmentation and ectopic
procen-triole formation upon severe cenprocen-triole over-elongation.
Overly long centrioles form over-active centrosomes. Our
sur-vey unravelled centriole length deregulation as a novel common
feature of cancer cells. Interestingly centriole length was suggested
to set centrosome size
48,51, therefore overly long centrioles should
form larger, and over-active, MTOCs. To test this, we
first
determined if overly long centrioles recruit more PCM than
normal-length centrioles. To investigate specifically the effect of
“centriole length” on PCM recruitment, we quantified the PCM
content (γ-tubulin and pericentrin) of centrosomes with an
asymmetric centriole length content in MDA-MB-435 mitotic
cells and in mitoses with only normal-length centrioles (thereafter
called symmetric mitoses) in RPE-1 and MDA-MB-435 cells
(Methods section). Mitoses containing overly long centrioles
clearly display an asymmetry in PCM content with poles with
longer centriole(s) recruiting more than double PCM amount
than the other poles. Contrarily, in symmetric mitoses, almost no
difference in PCM content was observed between poles (Fig.
6a
and Supplementary Fig.
11a). These results suggest that overly
long centrioles recruit more PCM than normal-length centrioles
which was further investigated by inferring the interdependency
of PCM content and centriole length (centrin intensity) in
MDA-MB-435 and HOP-62 cells. Both parameters indeed correlate in
both cell lines, confirming that elongated centrioles recruit more
PCM (Supplementary Fig.
11b, c).
To further substantiate the direct link between centriole
over-elongation and enhanced PCM recruitment, we induced centriole
over-elongation in T47D and SF268 and quantified PCM content
of normal-length and overly long centrioles (YFP and CPAP
overexpression, respectively). Elongated centrioles contain more
PCM than normal-length centrioles (Fig.
6b), therefore
confirm-ing that overly long centrioles form larger centrosomes which are
likely over-active. To confirm this, we analysed the MT regrowth
capacities of centrosomes in (i) MDA-MB-435 mitoses displaying
overly long centrioles, and (ii) RPE-1 and MDA-MB-435
symmetric mitoses (Methods section). Almost no difference in
α-tubulin content was observed between poles in symmetric
mitoses (Fig.
6c). Remarkably, in spindles with asymmetric poles,
the pole containing longer centriole(s) contains,
≈1,6 times more
MTs than the other pole (Fig.
6c and Supplementary Fig.
11d),
demonstrating that centrosomes containing overly long centrioles
are indeed over-active.
Elongated centrioles enhance chromosome segregation defects.
Induced centriole over-elongation was suggested to trigger
defective cell division, mostly through multipolar mitosis
for-mation due to the accumulation of supernumerary MTOCs
48. We
reasoned that centriole over-elongation could intrinsically, and
independently of centriole amplification, be detrimental for
mitotic cells as overly long centrioles form over-active
centro-somes that might generate unbalanced forces on chromocentro-somes,
leading to chromosome instability and aneuploidy, two known
features of cancer
52. To test this, we compared the occurrence of
chromosome segregation defects in mitotic MDA-MB-435 cells
containing only two centrosomes, with or without asymmetric
centriolar content. The incidence of chromosome segregation
defects, especially DNA/chromosome bridges, was higher in
asymmetric anaphases and telophases (32%), compared to
sym-metric ones (18%; Fig.
6d and Supplementary Fig.
12a, b).
To further link centriole over-elongation to chromosome
segregation defects, we induced over-elongation in T47D and
SF268. The proportion of multipolar prometaphases and
metaphases, a known source of chromosome instability
17,46,
statistically increases upon CPAP overexpression (from 14% ± 1
to 34% ± 8 in T47D and from 3% ± 0 to 18% ± 4 in SF268;
Fig.
6e). Chromosome missegregation during anaphases and
telophases is also significantly enhanced upon CPAP
over-expression (from 28% ± 0 to 44% ± 4 in T47D and from 17% ± 4
to 40% ± 4 in SF268, Fig.
6e and Supplementary Fig.
12c). Our
results show that induced centriole over-elongation enhances
multipolar mitosis formation and chromosome segregation
defects in cancer cell lines.
In conclusion, our results suggest that overly long centrioles
induce the formation of over-active centrosomes which enhance
chromosome missegregation, both directly and indirectly via
centrosome amplification. This likely leads to aneuploidy and
therefore may participate in tumorigenesis (Fig.
7).
Discussion
Recent work showed the importance of centriole amplification in
promoting tumorigenesis
18and as a target for cancer therapy
20,21,
raising the need to determine its prevalence and origins in cancer.
Here, we provided a sensitive and robust systematic survey of
centriole abnormalities in cancer cells. Our survey established
that centriole over-elongation and amplification are widespread
in cancer, the latter correlating with aggressiveness in breast and
colon cancer cell lines. Our follow up studies showed that overly
long centrioles form over-active centrosomes that enhance
chromosome missegregation. Furthermore, we provide the
first
explanation for the occurrence of centrosome amplification in
cancer as we demonstrate that centriole over-elongation generates
Fig. 5 Centriole over-elongation drives centriole amplification in cancer cells via ectopic procentriole formation and centriole fragmentation. a Centriole
elongation and amplification are not independent. Higher proportion of overly long centrioles (>500 nm) in cells with centriole amplification (CA), (p <
0.0001, Pearson’s Chi-squared test), compared with the expected proportions under the null hypothesis of independence. The expected and observed
percentages of overly long centrioles in cells with no CA and CA are shown, together with a detailed view above, given the low frequency of overly long
centrioles.b Induced centriole elongation triggers centriole amplification in cancer cell lines. CPAP was transiently overexpressed for 96 h in two cell lines
from the NCI-60 panel, T47D and SF268, which do not normally display centriole over-elongation. Cells were stained with DAPI (blue), alpha-tubulin
(a marker of MTs) and centrin (used as a readout for centriole number) antibodies (Scale bar 5µm). 3 independent experiments performed (depicted with
squares, triangles and circles). 80–140 cells were counted per condition and per experiment. The bars represent the means ± s.d. *Represents a p < 0.05
(one-tailed unpairedt test with Welch’s correction). c Centriole fragmentation and ectopic centriole formation in cancer cells with overly long centrioles.
Examples of structured Illumination Microscopy (SIM) and TEM pictures showing normal-length centrioles in the control cell line (upper panel), overly long centrioles with defective structures (middle panel), centriolar fragments (lower panel, inset 2 for SIM and insets of Ai, ii, iii for TEM) and ectopic procentrioles along the overly long centrioles (lower panel, labelled by asterisks in inset 3 for SIM and Biii and iv for TEM) in the MDA-MB-435 cell line. For
SIM, cells were stained with DAPI (blue), acetylated tubulin (green) and STIL (red) antibodies, and were subjected to a 2 h cold treatment, prior tofixation,
to depolymerise the cytoplasmic MTs. For TEM, each picture represents an individual cell except for Ai, ii, iii and Bi, ii, iii and iv, where the pictures are
supernumerary centrioles, via both centriole fragmentation and
ectopic procentriole nucleation. Our work represents an
impor-tant asset to uncover the origins and consequences of centrosome
defects in cancer, and in the development of new tools for cancer
diagnosis and therapeutics.
The NCI-60 panel encompasses 60 cancer cell lines from nine
distinct tissues, and has been widely used as a repository of cancer
diversity, since the majority of the NCI-60 cell lines genetically
represent their corresponding tumour types
24. Our survey
rein-forces the use of this panel as we observed a strong correlation
Control Control CPAP CPAP Control (28/198) Control (6/200) CPAP (42/135) CPAP (34/190) T47D SF268
% of cells with chromosome
segregation defects Normal length (n = 69/379) Overly long (n = 69/221) 40 30 50 20 10 0 Normal length Normal length Overly long 3 2 1 0 3 2 1 0 ***
b
RPE MDA-MB-435 Control CPAP
DAPI Centrin CENPB
CP110
Normal mitosis
DAPI
Chromosome segregation defects
Normal-length
Overly long
Dapi centrin pericentrin Dapi centrin pericentrin
Pericent Centrin
Pericent Centrin
Dapi centrin γTub
Centrin γ-Tub Centrin RPE Normal length Normal length Overly long 0.5 1.0 1.5 2.0 RPE MDA-MB-435 MDA-MB-435 Average of pericentrin
integrated density fold change
Average of
α
-tubulin raw
integrated density fold change
****
Pericent Ac-tub
T47D T47D
SF268 SF268
Dapi Ac-tub pericentrin
T47D
SF268
1 2 3 7 8
0
Raw integrated pericentrin density (×107 au) 4 6
Normal length Normal length Overly long
Normal length Overly long Normal length Overly long
T47D T47D SF268 SF268 Centrin α-Tub RPE MDA-MB-435 **** **** 0 20 **** **** 40 60
% of cells with chromosome
segregation defects Control (43/154) Control (26/150) CPAP (66/151) CPAP (50/125) T47D SF268 0 20 40 60 ** **** Control CPAP Dapi T47D T47D SF268 SF268
Dapicentrin α-Tub
DapiCentrinα-Tub
% of multipolar mitosis
Control CPAP
Average of
γ
-tubulin
integrated density fold change
Normal length Normal length Overly long RPE MDA-MB-435 *** **
Dapi centrin γTub
γ-Tub
a
c
d
between the
findings in breast cancer cell lines and patient
samples.
Our survey demonstrated that half of the NCI-60 cell lines, and
all analysed tissues, show significant centriole amplification
compared to non-cancerous cell lines, confirming how
wide-spread this phenomenon is in cancer. We also identified increase
and variability in centriole length as common features of cancer
cells, explaining previous observations of overly large and/or long
centrin-positive structures in both breast cancer and plasma cell
neoplasms in situ
53,54.
Our survey unveiled discrepancies in the penetrance of
cen-triole amplification within different cell lines from the same
tis-sue, indicating that centriole amplification is tumour-specific
rather than tissue-specific. We showed that centriole
amplifica-tion is more prevalent in specific molecular subtypes of breast
(basal-like) and colon (CIN molecular subtype) cancer cell lines
which represent particularly aggressive carcinomas, associated
with poor prognosis
42,43. Specific molecular features
pre-ferentially present in these carcinomas may underlie the presence
of high levels of centrosome amplification. For instance, basal-like
breast carcinomas have an increased incidence in patients with
germline BRCA1 mutations
55, shown to induce centrosome
overduplication
56. In CIN colon cancer, centrosome amplification
may arise through Aurora-A gene amplification, whose
over-expression leads to supernumerary centrosomes
45,57,58. Our data
confirm that centrosome amplification is associated with
malig-nant features, endorsing its potential as a tumour classifier to
establish prognosis and predict treatment response. The fact that
centrosome alterations are quite penetrant in cancer and rare in
non-cancerous cell lines, supports its use as a target in aggressive
tumour therapy
20,23.
The large variability in the percentage of cells with
super-numerary centrioles observed between cell lines confirms the
concept of an intrinsic centrosome amplification “set point” for
each cell line, proposed by Wong et al.
50. By reversibly inhibiting
centriole biogenesis, these authors generated dividing cells
with-out centrosomes in different cancer cell lines. After inhibitor
washout, cells form massive amounts of centrosomes de novo, but
gradually recover their initial level of centrosome amplification
50.
This may reflect a tumour-specific dynamic equilibrium between
stochastic emergence and death of cells with supernumerary
centrioles. Accordingly, a recent study followed cell fate after
induced centriole overduplication and highlighted that their
off-spring dies during the next cell cycle
59. In conclusion, while cells
with multiple centrosomes may arise and be present in the
population, part of their progeny may die. Cells with centriole
amplification may survive only if beneficial to the overall
popu-lation (e.g. by promoting invasiveness
16and/or yet unknown
non-cell autonomous effects that promote survival). Further
understanding of the
“centrosome set point” is critical to
suc-cessfully use centrosome amplification as a target for cancer
therapy.
Previously, both the limited use of centriole markers and
absence of genetic characterisation of tumours precluded proper
and systematic understanding of the origin of centriole
abnormalities
5,12. Our screening provided an opportunity to
address this important question. We focused initially in
under-standing the role of p53 and ploidy deregulation, given existing
controversy on their importance
23,60,61. While most cell lines
with amplification lost p53 function, this event is not sufficient to
trigger this abnormality, therefore reinforcing the idea that loss of
p53 function is a prerequisite to sustain centrosome amplification
across cancer
44,45,62, rather than a direct cause. Finally, we
observed that only a subpopulation of the cell lines displaying
amplification has significant increase in ploidy, suggesting
dif-ferent origins of ploidy and centrosome deregulations. Given that
cells were in a steady state, we cannot exclude that a common
event affects both ploidy and centrosome homoeostasis, as this
might be hidden by differential evolution of ploidy and
centro-some number. Further studies looking at the evolution of
popu-lations
after
triggering
ploidy
and
centrosome
number
deregulation are needed to understand how these processes are
related in cancer.
Our study identified a novel cause of centriole amplification in
cancer, centriole over-elongation. This defect affects only a
sub-population of cells, therefore reflecting inter-cellular
hetero-geneity that can reflect a dynamic equilibrium between genesis
and death of cells with centriole over-elongation. In addition, we
observed intra-cellular heterogeneity with usually only one or two
overly long centrioles per mitotic cell. This might reflect that
centriole length regulators are rate-limiting or alternatively that
not all centrioles are equally permissive to centriole length
deregulation. We rather substantiated the latter hypothesis by
showing that centriole over-elongation mostly affects
grand-mother centrioles in MDA-MB-435 cell line. Additional studies
are now required to further investigate those hypotheses.
We showed that overly long centrioles can fragment and
ectopically form procentrioles in cancer cell lines. These
phe-nomena likely explain previous observations of long centrin
fibres
and electron-dense fragment-like microtubule complexes in
breast carcinoma
53. This phenotype could result from the
deregulation
of
the
expression
of
centriole
length
Fig. 6 Centriole over-elongation leads to the formation of over-active centrosomes. a, b Overly long centrioles recruit more pericentriolar material than
normal-length centrioles.a RPE-1 (control, only normal-length centrioles) and MDA-MB-435 (with normal-length and overly long centrioles) cells were
stained with DAPI (blue), centrin (green), andγ-tubulin or pericentrin, (PCM components, red) antibodies (for details see Supplementary Fig.11a and
methods). 3 independent experiments performed (squares, triangles, circles). A total of 37–62 centrosomes quantified per condition and per experiment.
One-tailed unpaired t test with Welch’s correction. b Induced centriole elongation triggers enhanced PCM recruitment. CPAP was overexpressed for 48 h
in two NCI-60 cell lines, T47D and SF268, which do not display overly long centrioles. Cells were stained with DAPI (blue), pericentrin (red) and acetylated
tubulin (green) antibodies. Compilation of three experiments (around 30 centrosomes accounted per condition and per experiment). Mann–Whitney test.
c Overly long centrioles nucleate more MTs than normal-length centrioles. Microtubule regrowth assay in RPE-1 and MDA-MB-435 cell line. Cells were
stained with DAPI (blue),α-tubulin (red) and centrin (green) antibodies (see Supplementary Fig.11d and methods). Three independent experiments
performed (squares, triangles, circles). A total of 30–82 centrosomes accounted per condition and per experiment. One-tailed unpaired t test with Welch’s
correction.d Chromosome segregation defects (see Supplementary Fig.12a, b) are increased in mitotic cells with overly long centrioles. MDA-MB-435
cells were stained with DAPI (blue), CENPB (centromere, green), centrin (green) and CP110 (red, CP110 antibody sometimes labels the midbody)
antibodies. (200 cells counted per experiment,n = 3 squares, triangles, circles). z score test. e, f Induced centriole elongation enhances multipolar mitosis
formation and chromosome segregation defects (for details see Supplementary Fig.12). CPAP was transiently overexpressed for 96 h in T47D and SF268
cell lines. Cells were stained with DAPI (blue),α-tubulin (red) and centrin (green) antibodies. Three independent experiments performed (squares,
triangles, circles). Between 30–87 mitosis for e and 38–55 for f accounted per condition and per experiment. z score test, one-tailed. For all images: scale
bar: 5µm, insets: 1 µm (except for b, insets: 2 µm). For all graphs, the bars represent the means ± s.d. For all tests, **p ≤ 0.01 and ***p ≤ 0.001 and ****p ≤ 0.0001
regulators
48,49,63, or loss of cell cycle control
64. Further
investi-gations including mining the publicly available NCI-60 omics
data are now required to identify the causes of centriole length
deregulation in cell lines displaying over-elongation. This strategy
is critical to exploit this defect in cancer biology, and will likely
provide a better understanding of the mechanisms underlying
centriole length regulation in normal cells.
Supernumerary centrosomes induce aneuploidy, via merotelic
attachment of chromosomes during mitosis, as well as
invasive-ness, due to enhanced MT nucleation capacity resulting in
extracellular matrix degradation and RAC1 activation
16,17. We
propose that overly long centrioles may induce these features via
the formation of supernumerary centrioles. In addition, overly
long centrioles might directly trigger invasiveness as they form
over-active centrosomes which enhance MTs nucleation and
chromosome missegregation. We indeed observed an increase in
the occurrence of chromosome misalignments, polar asymmetry
and lagging chromosomes upon centriole over-elongation. These
defects likely result from the formation of asymmetric mitoses
with the pole containing longer centrioles, being over-active,
capturing more chromosomes than the other pole. Similarly,
mitoses with uneven numbers of daughter centrioles between the
two poles were recently shown to display asymmetric PCM
content and, therefore MT nucleation capacities. This asymmetry
in MT content leads to unequal kinetochore capture therefore
increasing the rate of chromosome missegregation
59.
Surpris-ingly, we also observed an increase in the occurrence of
chro-mosome bridges upon centriole elongation. Overly long centrioles
may induce this defect by triggering mitotic delays, therefore
inducing Aurora B kinase-dependent telomere uncapping and
chromosome fusion
65. Alternatively, chromosome bridges might
be a consequence of the formation of lagging chromosomes. The
latter can generate micronuclei with fragmented chromosomes,
which in the next cell cycle cause bridges
66,67. Further
investigations are now required to decipher how centriole
elon-gation triggers chromosome segreelon-gation defects. Altogether, our
work demonstrates that centriole over-elongation enhances
microtubule nucleation and chromosomal instability, two known
tumorigenic features. Further studies are now required to
deter-mine if centriole over-elongation is sufficient to trigger
tumor-igenesis in vivo.
Our study provides a thorough and comprehensive
compen-dium of centriole number and length abnormalities in the NCI-60
panel of cancer cell lines. Our work supports that centrosome
amplification is widespread in cancer and uncovers centriole
length deregulation as a common feature in cancer cells. Because
these changes are specific to cancer, these findings unravel novel
and promising opportunities in the
fields of cancer diagnostic and
therapy. Our survey combined with the publicly available data of
the NCI-60 cell lines are powerful and invaluable tools for the
identification of the molecular mechanisms by which cancer cells
lose precise control of centriole number and length. By making
our data publicly available, we will substantially expand the
characterisation of the NCI-60 panel of cancer cell lines and
consequently its use by the scientific community in the pursuit of
novel clinical and diagnostic tools in cancer research.
Methods
Cell culture. All NCI-60 cell lines were cultured in their respective media (see
Supplementary Table1), which was supplemented with fetal bovine serum (FBS,
Gibco), Penicillin (100 IU mL−1, Gibco) and Streptomycin (100 µg mL−1, Gibco). Note that the origins of all the NCI-60 cell lines are stated in Supplementary
Table1. NCI/ADR-RES, MDA-MB-435 and SNB-19 were reported to be
mis-identified cell lines. To keep the NCI-60 panel entire, and be able to compare with other studies using this panel, we kept these cell lines but affiliated them to their relative correct tissue of origin. All NCI-60 cells used in the secondary screening were tested for mycoplasma, the remaining cell lines were not. None of the cell lines used in this study were authenticated. hTERT-RPE-1 (kind gift from Lars
Jansen—IGC) and HB2 (kind gift from Fanni Gergely—Cancer Research UK) and
HaCaT (kind gift from John Marshall—BCI-QMUL) cell lines were culture in
Chromosome instability Aneuploidy Migration and invasiveness Ectopic procentriole Centriole fragmentation
Increased MT nucleation capacity
Centrosome amplification Ganem et al, 2009 Godinho et al, 2014 Centriole over-elongation ?
Fig. 7 Cellular consequences of centriole length deregulation. In cancer cells, over elongated centrioles induce centriole amplification through centriole
fragmentation and/or ectopic procentriole formation along the elongated centrioles. Elongated centrioles also generate larger MTOCs with a higher capacity to nucleate MTs that enhance chromosome instability during mitosis. Both scenarios could give rise to aneuploidy and might as well induce invasiveness, therefore centriole length deregulation might participate to tumour initiation and progression