HAL Id: halshs-00710720
https://halshs.archives-ouvertes.fr/halshs-00710720v4
Preprint submitted on 18 Feb 2014
HAL is a multi-disciplinary open access
archive for the deposit and dissemination of sci-entific research documents, whether they are pub-lished or not. The documents may come from teaching and research institutions in France or abroad, or from public or private research centers.
L’archive ouverte pluridisciplinaire HAL, est destinée au dépôt et à la diffusion de documents scientifiques de niveau recherche, publiés ou non, émanant des établissements d’enseignement et de recherche français ou étrangers, des laboratoires publics ou privés.
the Egyptian Manufacturing Industry
Youssouf Kiendrebeogo
To cite this version:
Youssouf Kiendrebeogo. Export Activity and Productivity: New Evidence from the Egyptian Manu-facturing Industry. 2014. �halshs-00710720v4�
C E N T R E D'E T U D E S E T D E R E C H E R C H E S S U R L E D E V E L O P P E M E N T I N T E R N A T I O N A L
SERIE ETUDES ET DOCUMENTS DU CERDI
Export Activity and Productivity: New Evidence from the Egyptian
Manufacturing Industry
Youssouf KIENDREBEOGOEtudes et Documents n°20
Septembre 2012 CERDI 65 BD. F. MITTERRAND 63000 CLERMONT FERRAND – FRANCE TÉL. 04 73 71 74 00 FAX 04 73 17 74 28 www.cerdi.org2
The author
Youssouf KIENDREBEOGO PhD Student in Development Economics University of Auvergne, CNRS, UMR 6587, CERDI, F‐63009 Clermont Fd. Email : youssouf.kiendrebeogo@udamail.frLa série des Etudes et Documents du CERDI est consultable sur le site :
http://www.cerdi.org/ed
Directeur de la publication : Vianney Dequiedt Directeur de la rédaction : Catherine Araujo Bonjean Responsable d’édition : Annie Cohade ISSN : 2114 ‐ 7957
Avertissement :
Les commentaires et analyses développés n’engagent que leurs auteurs qui restent seuls responsables des erreurs et insuffisances.
3
Abstract
This study explores the relationship between exports and productivity using a panel dataset of Egyptian manufacturing firms. Most previous studies using data from more developed countries suggest that exporters are more productive than non-exporters because the more productive firms self-select into export markets, while exporting does not necessarily improve productivity. We investigate if exporting firms are more productive than non-exporting firms and, if so, whether the productivity differential is due to a self-selection process or to the role of learning from exporting. We also ask if the extent of export activities matters for productivity. We find that both labor productivity and total factor productivity are significantly higher for exporters than for non-exporters. On average, labor productivity and total factor productivity are, respectively, 46% and 63% higher for exporting firms than for domestically-oriented firms. When we differentiate between pre-entry and post-entry differences in productivity, it appears that this export premium is driven by a learning-by-exporting process rather than just a self-selection of more productive firms into learning-by-exporting. This weak evidence for the selection hypothesis is a reflection of the importance of the level of development of destination countries. In contrast to exporters to OECD countries, exporters to Non-OECD countries self-select into export markets, signaling the importance of the technical assistance from foreign buyers benefiting the former exporters. We also find an inverted U-shaped relationship between export intensity and productivity, suggesting the existence of a “threshold of exporting”. These results are robust to controlling for additional firm characteristics and potential outliers.
Key words: Exports, Self-selection, Learning from exporting, Productivity JEL codes: F23, O14, O31
Remerciements:
I am grateful to Mohamed Chaffai, Patrick Plane, and Nikola Spatafora for useful comments. All remaining errors are my own.
4
1. Introduction
The issue of productivity differentials between exporters and non-exporters continues to attract the attention of economists and development practitioners. At the country-level, the exceptional income and productivity growth in countries with export-led development have been attributed to externalities derived from exporting, notably in the newly industrialized countries. Evidence suggests that international trade openness is one of the key factors explaining cross-country variations in long-run economic growth (see, for instance, Sachs and Warner, 1995; Hall and Jones, 1999). Furthermore, trade policy is traditionally used to promote exports and boost firm-level performance. Thus, trade liberalization, by bringing domestic firms into contact with international best practices, provides them the opportunity to benefit from the technical expertise of foreign buyers and become more productive (World Bank, 1997).
Although mounting evidence shows that exporting firms are expected to be larger and more productive than non-exporting firms, it is always unclear the direction of the causation between exports and firm productivity. Two main alternative hypotheses are identified to explain why exporters might be better-performer firms than non-exporters. The first argument is the self-selection hypothesis according to which more productive firms self-select into export markets because they are able to bear additional sunk costs of selling goods in foreign countries for the first time.1 Sunk start-up costs include any extra costs of locating foreign demand and competition, establishing distribution networks, adjusting product characteristics to meet foreign tastes, regulations and standards (Roberts & Tybout, 1997; Clerides et al. 1998; Bernard & Wagner, 2001). The implication of the self-selection argument is that firm productivity is the cause and not the consequence of firms’ export-market participation. The second argument is that firms learn to be more productive by becoming exporters, suggesting that the firm export status is a driver of firm productivity. The learning process may operate through a technical assistance from overseas buyers (Rhee et al., 1984; Grossman and Helpman 1991, p. 166; World Bank 1993; Pack & Saggi, 2001) or/and through the exposition to international competition (Evenson and Westphal, 1995). The learning effect, therefore, includes knowledge, technology, and efficiency gained from exporting. There is substantial evidence that exporters perform better than non-exporters but the issue of the direction of the causality between exports and productivity has only recently begun to attract attention. Beginning with Bernard and Jensen (1995), this recent strand of the literature documents the issue of causality between exports and firm performance.2 Whereas most studies considering more developed economies find evidence that the export premium is due to a self-selection process (Bernard and Jensen, 1999; and Clerides, Lach and Tybout, 1998; Aw et al, 2000; Delgado et al., 2002; Girma & al., 2003; Greenaway et al., 2005), more recent studies focusing on less developed economies tend to confirm the learning effect
1 Firms also self‐select into exporting because the returns to doing so are relatively high for them (Clerides et al. 1998). 2 The first strand of the literature includes, among others, Chen and Tang (1987); Haddad (1993); Aw and Hwang (1995).
5 (Kraay, 1999; Castellani, 2002; Balwin & Gu, 2003; Bigsten et al., 2004; Blalock and Gertler, 2004; Fernandes & Isgut, 2005; De Loecker, 2007; Mallick and Yang, 2013).
Notwithstanding its valuable insights, the big picture of the weak evidence of learning from exporting is challenging on three important grounds. The first one is related to the cross-country differences in economic and technological development. Indeed, lesser developed countries future exporters are much more likely to be less efficient than firms in developed trading partner’s countries. It is therefore reasonable to assume that firms in developing countries breaking into export markets are much more concerned with the learning-by-exporting phenomenon than others. This is the reason why, in contrast to studies using data from more developed countries, most of those working on lesser developed economies find strong evidence of learning from exporting (Kraay (1999); Bigsten et al. (2004); Blalock and Gertler, 2004; Fernandes & Isgut, 2005; Mallick and Yang, 2013).
The second point is the role of firm export experience, that is, the number of years in exporting.3 It also seems reasonable to suppose that not all exporters have the same history of involvement in export markets: recent entrants into export markets are much more likely to learn from exporting than established exporters. Similarly, while some firms only export occasionally, some others are actively and constantly involved in international markets. The third idea is that simply comparing exporters with non-exporters does not tell us the extent to which exporting improves firm performance. Some firms may export only very low levels of their export to output ratio, whereas some others export almost all of their output. This suggests that not only export-market participation improves productivity, but also the extent of the firm’s export activities is positively associated with firm performance.
Another underlying missing link is the so-called “threshold of internationalization”. On the one hand, highly internationally engaged firms realize substantial economies of scale in exporting and access new and highly sophisticated technologies. On the other, an increasing international expansion may adversely affect firm productivity, due to vulnerability to external shocks. The association between exports and productivity might, therefore, display an optimal level of firm’s international involvement.
The purpose of this paper is to revisit the link between exports and productivity, accounting for all these missing dimensions of the relationship. Specifically, we make four important contributions to the literature. First, we directly test the self-selection hypothesis against that of the learning-by-exporting using propensity score matching methods to remove the potential bias generated by confounding factors. Second, we make the first attempt to formally reconcile the two alternative hypotheses by highlighting the fundamental role of the level of development of destination countries. The underlying idea is that exporting to Organization for Economic Co-Operation and Development (OECD) countries, for example, does not necessarily involve substantial sunk costs of entry into export markets because of the technical assistance provided by such importers. In contrast, exporting to Non-OECD countries or to poor countries might require sunk costs of entering the export market, suggesting that only the most productive firms are able to export to these countries.
6 Third, our study also offers important insight for the level and the extent of firms’ engagement in export markets. We consider that both the level of engagement in exporting and how long firms have participated in the export market matter for capturing the learning effects. We account for this by applying the generalized propensity score (GPS) introduced in this literature by Fryges and Wagner (2008) and Fryges (2009) to a lesser developed economy. In so doing, this study estimates in a same framework the propensity scores using not only a binary treatment—that is the firm’s export status—but also a continuous treatment—that is the firm’s export intensity. Fourth, we consider a relatively less developed economy, namely Egypt. Questioning the exports-productivity link in the Egyptian manufacturing industry is of considerable research interest in many respects. Egypt has experienced a high level of trade restrictions in the recent past, suggesting that both the sunk costs of starting exporting and the learning effects are much more likely to coexist than in more developed economies. The implementation of the trade liberalization beginning in 1991 was followed by a rapid growth of the number of exporting firms.4
We find that both labor productivity and total factor productivity are significantly higher for exporters than for non-exporters. On average, labor productivity and total factor productivity are, respectively, 46% and 63% higher for exporting firms than for domestically-oriented firms. When we differentiate between pre-entry and post-entry differences in productivity, it appears that this export premium is driven by a learning-by-exporting process rather than just a self-selection of more productive firms into exporting. This little evidence of the selection hypothesis is a reflection of the importance of the level of development of destination countries. In contrast to firms that export to OECD countries, exporters to Non-OECD countries self-select into export markets, signaling the importance of the technical assistance from foreign buyers benefiting the former exporters. We also find an inverted U-shaped relationship between export intensity and productivity, suggesting the existence of a “threshold of exporting”. These results are robust to controlling for additional firm characteristics and to dropping potential outliers.
The rest of the paper is organized as follows. In Section 2, we present a brief review of the theoretical and empirical literature. Section 3 describes the trade liberalization in Egypt, while Section 4 explains our empirical strategy. The main results of the paper are discussed in Section 5 and concluding remarks are presented in Section 6.
2. Exports and Productivity: Theoretical and Empirical Literature 2.1. Theoretical arguments
Exporting firms are expected to be larger and more productive than non-exporting firms, mainly due to the self-selection of more productive firms into export markets and the role of learning-by-exporting (Bernard & Jensen, 1999a; Wagner, 2007a). On the one hand, the more productive firms self-select (randomly or consciously) into exporting because of sunk costs of starting exporting and financial constraints. Thus, only firms that can successfully overcome
7 these additional costs, or that are financially liquid, become exporters. These additional costs therefore represent barriers to entering foreign markets.
The self-selection can operate either randomly (Melitz, 2003; Bernard et al., 2003) or consciously. The idea of the random self-selection is that trade exposure randomly causes a selection of the more productive firms in the international market forcing the least productive to exit. Regarding the conscious self-selection the basic insight is the existence of a rationality effect. Future exporters plan and prepare themselves to enter the export market so that they increase their productivity before facing international competition (Yeaple, 2005). The work of Melitz (2003) focused attention on firm heterogeneity in international trade and suggested that the entry and exit movements lead to a reallocation of market shares in favor of the most productive firms and an increase in aggregate productivity.
Exporting increases expected revenue and the productivity threshold of survival in international markets. This leads to an exit of least efficient firms in a Schumpeterian logic of “creative destruction”, suggesting that exporting firms have to be more productive than their domestically-oriented counterparts. So rational, firms have the incentives to invest and innovate in order to increase their productivity when they anticipate entering the export market. Thus, the ex-ante productivity level depends on previous forward looking decisions of firms facing sunk costs of entering the export market.
On the other hand, exporting improves firm productivity because exporters learn from international buyers and competitors. Foreign consumers and competitors transfer their knowledge and technology to domestic firms entering the export market, suggesting a transition from traditional technologies to modern technologies (Rodrik, 1988a; Grossman & Helpman, 1991; Clerides et al., 1998).5 Firms may benefit from the technical expertise of foreign buyers, notably in lesser developed economies. When the demand requires a certain degree of standardization or coordination, importers in developed countries provide technology to sellers located in developing countries. The reason is that production techniques in developing countries are not sophisticated enough to meet the quality standards of export markets.
For example, the model developed by Pack and Saggi (2001) highlights the importance of incentives of buyers to provide technology to sellers. Developed countries buyers are willing to transfer knowledge to lesser developed exporters, although such knowledge transfer can diffuse to other firms and, ultimately, leads to entry into developed markets. Exporting firms may also benefit from exposure to the intense competition of export markets. The exposition to international competition forces exporting firms to adopt the most sophisticated technologies. Otherwise, they cannot survive in more competitive markets. In contrast to domestically-oriented firms, which often produce with increasing returns to scale, foreign-oriented firms need to fully exploit economies of scale to survive in competitive international
5
Exporters may also be more efficient by reducing X‐inefficiency, while using the same technology (Nishimizu & Robinson, 1984).
8 markets.6 That is consistent with the study by Van Biesebroeck (2005) who finds that because of financial constraints and contract enforcement, domestically-oriented firms do not fully exploit scale economies.
The leaning from exporting hypothesis is also supported by the theoretical models of firms export market participation. The argument in these models is that firms export only when the expected benefits of such an investment are positive. Another plausible story is that the exceptional productivity performance of exporters reflects a market driven selection process. Exporting firms with low productivity are forced to exit the export market and only successful ones will continue exporting.
2.2. A brief survey of evidence
Since the seminal paper by Bernard & Jensen (1995), an extensive empirical literature on the relationship between exports and productivity performance has grown. Wagner (2007a)
reviews 54 empirical studies covering 34 countries that address this issue. The familiar picture is that exporters are more productive than non-exporters. The evidence suggests that the export premium is much more explained by the fact that the more productive firms self-select into exporting, while exporters do not necessarily learn from exporting. This suggests that the empirical evidence strongly supports the self-selection hypothesis against the learning effect. Let’s sum up the main findings in favor to the selection into export markets.7 Bernard & Jensen (1995) use a panel dataset of U.S. manufacturing firms over the period 1976-1987 and find that exporters have a third greater LP than non-exporters. The estimated export premium is about 15%. Aw & Hwang (1995), in the case of Taiwan, find that LP is 36% higher for exporting firms, as compared with their counterparts selling on the domestic market only. Furthermore, although Clerides et al. (1998) construct a model of export participation with learning effects, they find that the association between exports and productivity is much more in favor of the self-selection hypothesis. Using data from the Indonesian manufacturing industry, Sjoholm (1999) finds that exporters experience higher levels and growth rates of LP than non-exporters and that this export premium is increasing with the export to output ratio.
Bernard & Wagner (1997, 2001), even after controlling for unobserved firm-level heterogeneity, find that future export entry is strongly and positively associated with higher productivity, mainly due to sunk costs of starting exporting. The same picture is found in other studies, with pre-entry export premia varying across industries and with the level of economic development (see, for instance, Isgut, 2001; Wagner, 2002; Castellani, 2002; Aw et
al., (2000); Delgado et al., 2002; Hansson and Lundin, 2004; Aw & Huang, 1995; Liu et al.,
1999; Girma et al., 2004; Greenaway & Kneller, 2004; Greenaway & Yu, 2004; Bernard & Jensen, 2004). 6 Domestically‐oriented firms are often protected from international competition, especially in developing economies. Participation in international markets allows achieving economies of scale, mainly due to increased demand. 7 These findings were summarized using, in part, the detailed survey of Wagner (2007a).
9 Regarding the learning hypothesis, with few exceptions, it is supported by much of the emerging literature looking at the trade-productivity nexus in lesser developed economies. The work of Blalock and Gertler (2004) emphasized the shortcomings of previous attempts to test the leaning-by-exporting hypothesis in more developed economies. They point to the fact that the traditional weak evidence of learning from exporting is due to cross-country differences in economic development. The underlying idea is that the learning effect is much more likely to be found in poorest countries, where future exporters have much more to learning from foreign buyers and competitors in terms of best practices and efficiency.
Using data for the Indonesian manufacturing industry over the period 1990-1996, their results strongly support the learning hypothesis. Very similar results were obtained, among others, by
Kraay (1999) in China, Bigsten et al. (2004) and Van Biesebroeck (2005) in African countries, Fernandes & Isgut (2005) in Colombia, De Loecker (2007) in Slovenia, and
Mallick and Yang (2013) in India. Although the learning effects found in these studies vary with samples and estimation methods, the big picture that emerges is that exporting improves firm productivity in developing economies.
In sum, with some few exceptions, empirical studies tend to find evidence for the self-selection hypothesis in developed countries and for the learning-by-exporting hypothesis in emerging and developing countries. This could be explained by the fact that the learning effect is more relevant in developing countries than in developed countries where firms are relatively closer to their production possibility frontier.
3. The Egyptian trade policy and manufacturing exports
Since the initiation of the stabilization program in the early 1990s Egypt has implemented a gradual but progressive trade liberalization. Most non-tariff measures have been removed, the tariff protection has been significantly reduced, and the domestic sector has been reformed in a market-friendly manner. The Egypt’s average most-favored-nation (MFN) tariff fell to 20.0% in 2005 from 26.8% in 1998. The number of tariff bands has also been significantly reduced since the 1990s.
The government does not grant any export subsidies but promotes exports through an Export Promotion Law adopted in 2002. Although exporters need to be registered in the Commercial Register with the General Organization for Export and Import Control, no export approval is required. Unlike imports, exports are not restricted to Egyptian nationals. Regarding export taxation, Egypt does not apply any export taxes, charges or levies. There are no export quotas, licences, or prohibitions. Exports are not subject to any quotas, licences, or prohibitions and are also exempt from the general sales tax introduced since 1991.
Various incentives are used to encourage export-oriented activities. These mainly include the promotion of (i) the establishment of free zones, (ii) the access to finance, insurance, and guarantees for exporting firms,8 and (iii) the market assistance through a number of
8
Since its establishment in 1983, the Export Development Bank of Egypt (EDBE), provides short‐ and medium‐ term loans to finance capital assets of exporting firms. It also provides bank guarantees required for financing
10 government agencies.9 The manufacturing sector is at the core of the Egypt’s export development strategy, although exports of petroleum and natural gas constitute a major source of foreign exchange earnings. Apart from agricultural products, the four priority areas are processed food products, textiles and garments, chemicals and pharmaceuticals, and building materials.
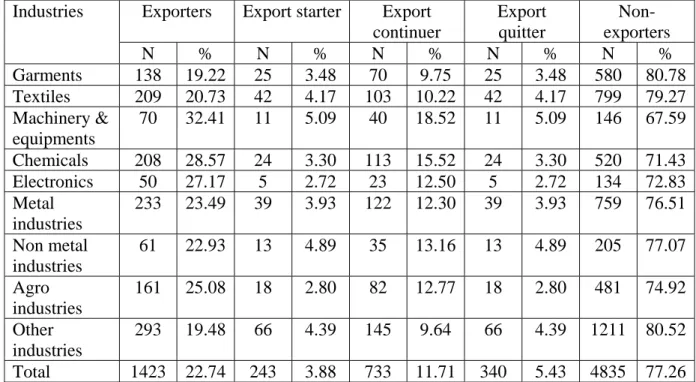
These reforms, by introducing a greater degree of competition in the economy, have helped spur exports beginning in the early 2000s. The increase in exports has made a switch from chronic current account deficits to growing surpluses since 2000s (WTO, 2005). The non-oil exports has increased, particularly manufacturing exports, main driven by the tariff reductions for imported inputs and the New Intellectual Property Legislation entered into force in 2002. The sample period of this study is from 2003 to 2008, and therefore, covers the episode of exports expansion in Egypt resulting from the trade liberalization. The dataset includes the main manufacturing industries of the Egyptian economy (Table 1). The number of exporting firms, as a percentage of manufacturing firms, has increased significantly, moving from 20% in 2003 to 30% in 2008. As shown in Table 2, the generalization of the exporting activity occurs mainly in the garments, textiles, food and metal industries, confirming the overall structure of the Egypt’s export sector described by the 2005 Trade Policy Review (WTO, 2005).
Table 1: Number of exporters and non-exporters, by year
Year Number of exporters Number of non-exporters Total
2003 2004 2005 2006 2007 2008 136 185 215 259 299 329 532 572 579 663 721 737 668 757 794 922 1020 1066 4. Empirical Strategy
4.1. Measuring productivity performance
In the empirical literature on the export-productivity relationship, the issue of productivity measurement is important. Productivity can be defined as the ability of the firm to transform inputs into output. Productivity is generally measured using partial productivity measures (output per worker, for example) or using TFP measures. TFP measures are often preferred because they allow accounting for the use of multifactor inputs in production. A basic non-parametric measure of TFP comparing firms’ productivity can be defined by the profitability ratio as follows: exports. The Export Credit and Guarantee Company, established in 1992 by the EDBE, supports exporters by issuing export credit insurance guarantees covering up to 80% of any losses incurred. 9 These agencies mainly include the Commercial Representation Body, the General Organization for International Exhibitions and Fairs, the International Trade Point under UNCTAD's initiative, and the Egyptian Export Promotion Centre.
11
k k i i x y p x y p '' (1)where y denotes the output vector using the input x. p and represent the corresponding output and input price vectors, respectively. This ratio is however limited because output and input prices could vary across firms, requiring the use of more enhanced measures of TFP. One alternative is the multilateral productivity index introduced by Caves et al. (1982). Such a productivity index allows for direct comparisons between any two firm-year observations possible and is in the following form:
] ) )( ( 2 1 ) ( ) ( 2 1 [ ) ( 2 1 ) 1 ( ) 1 ( 1 2 1
T t K k t k kt t k kt kt kit K k kt kit T t t t t iy x x c c x x c c y y y y TFP (2)where y is the output of firm it i in period t using the input vector x . it c is the cost share of kit the input vector x in the total cost. it
Thus, firm’s TFP is computed using the deviations of its inputs and output from the reference situation, that is, a situation in which output and inputs represent sample geometric means and input cost-based shares reflect the sample arithmetic mean. This TFP measure is often used in the empirical literature on the relationship between exports and productivity (see, for instance,
Aw et al., 2000; Delgado et al., 2002; Bellone et al., 2010). However, one drawback of such a measure is that it does not take into account the endogenous nature of the capital input. The reason is that firm choices on input quantities, notably those of the capital input, depend on its productivity (Olley & Pakes, 1996).
In this study, we account for this shortcoming by using the productivity measure proposed by
Levinsohn & Petrin (2003). The basic insight is to instrument the capital input with intermediate inputs. This procedure is done by estimating the following log-linear production function: t t m t l t k t LnK LnL LnM LnY (3)
where Y , t K , t L , and t M are respectively firm’s output, capital, labor and intermediate t input in period t . Here, value added is used as the output indicator and raw material inputs are used as a proxy for firm’s intermediate inputs. L and M are assumed to be free variables, while K is a state variable. t t t is an additively separable error term including two
components: a transmitted productivity component (t) and an i.i.d. component (t). This
procedure allows correcting for the potential correlation between input levels and the unobserved firm-specific productivity shock to the production technology (Levinsohn &
12
Petrin, 2003). Unlike Olley & Pakes (1996) who use investment to control for such a correlation, Levinsohn & Petrin (2003) use intermediate inputs to tackle this simultaneity issue. In so doing, intermediate inputs are set as a function of firm’s state variablesK . TFP is then consistently estimated using the OLS estimator of the following structural model:
) , ( ) , ( ) , ( t t t t k t t t t t t t l t M K LnK M K M K LnL LnY (4)
As a robustness check, we also use the LP index, that is considered here as the value added per worker.
4.3. The data
We exploit data from an unbalanced panel of 1655 manufacturing firms over the period 2003-2008 taken from the World Bank Enterprise Surveys database.10 The surveys focus on domestic firms having at least 10 employees. Exporter firms are defined as establishments that export directly, implying that firms exporting indirectly through a distributor are not considered as exporters.
Table 2: distribution of exporter status across manufacturing industries Industries Exporters Export starter Export
continuer Export quitter Non-exporters N % N % N % N % N % Garments 138 19.22 25 3.48 70 9.75 25 3.48 580 80.78 Textiles 209 20.73 42 4.17 103 10.22 42 4.17 799 79.27 Machinery & equipments 70 32.41 11 5.09 40 18.52 11 5.09 146 67.59 Chemicals 208 28.57 24 3.30 113 15.52 24 3.30 520 71.43 Electronics 50 27.17 5 2.72 23 12.50 5 2.72 134 72.83 Metal industries 233 23.49 39 3.93 122 12.30 39 3.93 759 76.51 Non metal industries 61 22.93 13 4.89 35 13.16 13 4.89 205 77.07 Agro industries 161 25.08 18 2.80 82 12.77 18 2.80 481 74.92 Other industries 293 19.48 66 4.39 145 9.64 66 4.39 1211 80.52 Total 1423 22.74 243 3.88 733 11.71 340 5.43 4835 77.26
The export dummy takes 1 if a given firm exports directly in the given year and 0 otherwise. The distribution of the exporter status across manufacturing industries is given in Table 2. As in most developing countries, there are fewer exporters (22.74%) than non-exporters
(77.26%), although export participation varies significantly across industries. The Machinery & equipments and Chemicals appear to be the leading export industries, whereas Garments
10
This period was obtained by exploiting the information provided for the year preceding each survey year (2004, 2006, and 2008). The World Bank’s Enterprise Survey database is available at:
13 and Textiles are the relatively small export industries.11 Our sample includes 3.88% of export starters, 11.71% of export continuers, and 5.43% of export quitters, with substantial
heterogeneity between industries.
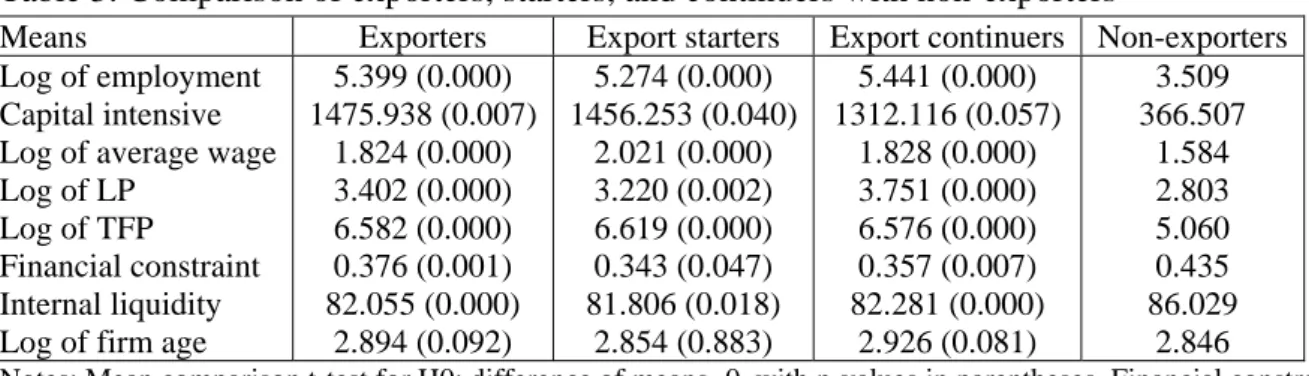
Table 3 provides the characteristics of exporters, starters, and continuers, as compared with non-exporters. Both labor productivity and total factor productivity are importantly higher for exporters than for non-exporters. Consistent with earlier studies comparing (see, for instance,
Bernard and Jensen, 1995; Bernard and Wagner, 1997; Blalock and Gertler, 2004), it is clear that exporters tend to be larger (in terms of number of employees) and more capital intensive than non-exporters. Exporting firms also pay higher wages per employee, reflecting their higher productivity performance. On average, domestically-oriented firms experience relatively severe financial constraints than export-oriented firms. The former also tend to finance their working capital with internal funds or retained earnings, consistent with their limited access to external financing sources. Finally, exporters are older than non-exporting firms, although the difference is only statistically significant at the 10 percent level.
Table 3: Comparison of exporters, starters, and continuers with non-exporters
Means Exporters Export starters Export continuers Non-exporters Log of employment
Capital intensive Log of average wage Log of LP
Log of TFP
Financial constraint Internal liquidity Log of firm age
5.399 (0.000) 1475.938 (0.007) 1.824 (0.000) 3.402 (0.000) 6.582 (0.000) 0.376 (0.001) 82.055 (0.000) 2.894 (0.092) 5.274 (0.000) 1456.253 (0.040) 2.021 (0.000) 3.220 (0.002) 6.619 (0.000) 0.343 (0.047) 81.806 (0.018) 2.854 (0.883) 5.441 (0.000) 1312.116 (0.057) 1.828 (0.000) 3.751 (0.000) 6.576 (0.000) 0.357 (0.007) 82.281 (0.000) 2.926 (0.081) 3.509 366.507 1.584 2.803 5.060 0.435 86.029 2.846
Notes: Mean comparison t-test for H0: difference of means=0, with p-values in parentheses. Financial constraint is a dummy variable defined to take 1 if the access to external financing is a major problem for their operation and growth. Internal liquidity is the share of working capital financed by internal funds or retained earnings.
Even when we differentiate between export starters and continuers, it is apparent that they are also larger and more capital intensive, have higher labor productivity and total factor productivity than non-exporters. They are less financially constrained and rely less on internal funds to finance their working capital. However, because some of these firm characteristics are used as matching variables, we make sure that the means of firms’ characteristics do not differ statistically between the treated and the non-treated firms.
These unconditional differences between exporters and non-exporters put into question a possible causal effect of export-market participation on productivity performance. The underlying issue is the determinants of these productivity differentials between exporters and non-exporters. These can be the result of a self-selection of more productive firms into exporting markets, a learning by exporting process or both.
11
This feature is consistent with the structure of the Egyptian export sector depicted in the 2005 Trade Policy Review (WTO, 2005).
14
4.1. Empirical specification
In this section, we first investigate whether exporters are more productive than non-exporters, and then check if the anticipated productivity differential is due to a self-selection process or/and to the role of leaning-by-exporting. In so doing, we use a Propensity Score Matching approach that allows adjusting for potentially confounding firm characteristics. Here, the point is to match each exporters to non-exporters whose observed characteristics as similar as possible.
In contrast to regression analysis, propensity score estimates are more robust to differences in the distributions of the confounding variables. In order to test the two alternative (but not mutually exclusive) hypotheses discussed above, we define two groups of exporter: export-starters and export-continuers. Let’s consider the export-market participation dummy as
1
it
Exporter if the firm i is an export directly in period t .12 In year t , export-starters (Strater ) are defined as establishments that did not export in year t t1 and export in year t .13 Export continuers (Continuer ) are firms that exported in years t t1 and continue to export in year t . Similarly, export quitters (Quitter ) are defined as establishments having exported in t year t1 but not in year t .14
We follow the empirical literature on the export-productivity link and specify the following econometric model: it t i i it it
it Exporter Control Industry
PT 1 2 (5)
where PT is the productivity indicator (in level) for firm i in period t . In the baseline it situation, where we just look at the export premium, Exporter represents a dummy taking 1 it if the firm i export in period t .
The idea behind the self-selection is that future exporters prepare themselves to enter the export market so that they are expected to have a productivity boost over the period just before starting exporting. As for the learning effect, the point is that exporting increases firm performance so that firms are expected to experience a jump in productivity over the period following the first year of export. To test these two hypotheses we modify (5) as follows:
it t i i it it
it Starter Control Industry
PT 1 2 (6) 12 The precision “directly” is important because in developing countries some exporters used to export through a distributor and therefore are much less concerned with the issue of sunk costs. As mentioned in the discussion above, the sunk costs are at the core of the hypothesis of self‐selection. In the survey data we will be using, the question on the export status is expressed as follows: What percent of your establishment’s sales in 2007 were (i) sold domestically, (ii) exported directly, (iii) exporter indirectly through a distributer. The responses indicate that 18% of total exporters were indirect exporters. 13 This definition of export‐starters, export‐continuers and export‐quitters, is constrained by the limited time period, is more restrictive than that of Wagner (2002), who uses 3‐year windows.
14 Although that is not the point in this study, we will compare the productivity of export‐continuers with that of export‐stoppers. An export‐stopper is defined to be firm that export in period t1having but do not export in t.
15 it t i i it it
it Continuer Control Industry
PT
1 2 (7)
Here, PTit is the growth of the productivity indicator for firm i between t1 and t .
Consistent with above definitions, (6) and (7) allow testing the presence of self-selection and learning effects, respectively. To consistently identify the export premium as well as the pre-and post-entry premia, we make use of propensity score matching method. To evaluate the export status effect of productivity, we estimate the average treatment effect on the treated (ATT) in the following way:
] 1 | [ ] 1 | [ 1 0 E PTi Exporteri E PTi Exporteri ATT (8)
where PTià |Exporteri 1 is the productivity level the firm i would have if it had been a non-exporter and PTi1 |Exporteri 1 its actual level. The selection and learning effects are then given, respectively, by:
] 1 | [ ] 1 | [ 1 0 i i i i s E PT Starter E PT Starter ATT (9) ] 1 | [ ] 1 | [ 1 0 i i i i s E PT Continuer E PT Continuer ATT (10)
However, one fundamental problem in this evaluation is that PTi0 |Exporteri 1 is not observable. The export premium would be contaminated if the export decision is not random. In the case where the decision to export is correlated with observable factors such as internal liquidity, employment and wages, the so-called “selection on observables” problem arises. To account for this problem, we use the propensity score matching procedure. The treatment effects given in (8) can therefore be rewritten as follows:
)] ( , 1 | [ )] ( , 1 | [PTi1 Exporteri p Xi E PTi0 Exporteri p Xi E ATT (11)
where X is a set of observable covariates and p( X)is the propensity score generated from a Logit estimate of the probability of exporting, conditional on X. X includes the log of employment, the log of average wage (as a proxy of firm’s human capital), the firm financial health and the log of firm age. We also control for the localization in an industrial zone, thus accounting for horizontal integration and therefore for any regional positive externalities. Indeed, the presence in an industrial zone can improve the likelihood of exporting because the concentration of exporters in such a zone generates positive externalities to others firms. The one-period lagged values of covariates are used to alleviate potential endogeneity on the estimation of the propensity score. The export premium, defined as the ceteris paribus productivity difference (in percentage) between exporters and non-exporters is given by:
] 1 ) [exp(
100 ATT .
To test the hypothesis of self-selection, we compare the productivity performances between today’s exporters and non-exporters, one year before starting to export, controlling for firm
16 characteristics included inX . Similarly, the hypothesis of learning-by-exporting is tested by computing the productivity differential between today’s exporters and their counterparts which do no export during the year after entering the foreign market, controlling for conditioning information included in X . More formally,
)] ( , 1 | [ )] ( , 1 | [ i1 i i ià i i s E PT Starter p X E PT Starter p X ATT (9) )] ( , 1 | [ )] ( , 1 | [ i1 i i ià i i s E PT Continuer p X E PT Continuer p X ATT (10)
We use the nearest neighbor matching with replacement, consisting in matching each treated firm with control firms that experience the closest propensity score. The algorithm of Becker and Ichino (2002) was used to make sure that the matching was successful. The difference in means of firms’ characteristics is not statistically different between treated and control units. In addition, we make sure of the validity of the common support condition by dropping treated units with a propensity score higher than the maximum or lower than the minimum propensity score of the control units.
4.2. Estimating the propensity scores
The results of Logit regressions to generate the propensity score are reported in Table 4, when simply using the export dummy as the treatment variable. The results that use the export starter and export continuer dummies as the treatment variables are presented in Tables A1 and A2 in the appendix. In Table 4, the values of the Pseudo-R-squares—ranging from 28.7% to 32.1%—suggest that the Logit regressions fit the data well (see Domencich and McFadden (1975) and Louviere et al. (2000) for detailed discussion on goodness-of-fit tests).15
In the baseline specification, we simply control for the log of employment, the log of average wage, the log of firm age, the share of working capital and new investments financed by internal funds or retained earnings, and a dummy variable indicating if the firm has a department specialized in research and development. As shown in Table 3, firms that export tend to hire more, to pay more, and are older than non-exporters. They do not rely heavily on internal funds to finance working capital and new investments. In addition, exporters typically spend more than domestically-oriented firms to finance research and development activities.
15
The same picture is observed in Tables A1 and A2, when the export starter and export continuer dummy variables are used as the treatment variables (see the appendix).
17 Table 4: Logit estimates of the propensity scores
Dependent variable =1 if exporter
(1) (2) (3) (4) (5) (6) Log of employment
Log of average wage Log of age
R&D
Internal liquidity
Localization in an industrial zone Log of employment (squared) Log of age (squared)
Constant 0.516*** (0.032) 0.070** (0.035) -0.183*** (0.066) 0.696*** (0.110) 0.004** (0.001) -3.585*** (0.274) 0.527*** (0.033) 0.071** (0.035) -0.181*** (0.067) 0.649*** (0.112) 0.003** (0.001) -3.392*** (0.294) 0.497*** (0.033) 0.054 (0.036) 0.059 (0.074) 0.604*** (0.113) 0.004** (0.001) 1.001*** (0.108) -4.286*** (0.324) 1.228*** (0.167) 0.052 (0.036) 0.098 (0.074) 0.578*** (0.112) 0.003** (0.001) 0.932*** (0.109) -0.072*** (0.016) -5.950*** (0.502) 0.408*** (0.052) 0.106* (0.036) 0.664* (0.368) 0.602*** (0.113) 0.003** (0.001) 0.977*** (0.108) -0.108* (0.064) -5.097*** (0.588) 0.643*** (0.044) 0.105** (0.047) -0.039 (0.094) 0.684*** (0.134) 0.005*** (0.002) 0.999*** (0.135) -5.224*** (0.414)
Sector-Fixed Effects NO YES YES YES YES YES
Number of obs. Pseudo R2 2831 0.153 2831 0.158 2828 0.186 2828 0.193 2828 0.187 2092 0.253 Notes: Standard errors are presented in parentheses. All of the explanatory variables are lagged one period.
18 The propensity score is estimated using a Logit model to limit the problem of disproportionate sampling.16 Most estimated coefficients show the expected signs. As anticipated, we find that firms with higher levels employment and higher wages are likely to be exporters. It is worth noting, however, that the level of employment can affect the likelihood of exporting in opposite directions. On the one hand, since we are in a less developed setting, firms with relatively high employees can exploit the comparative advantage in labor and export in countries with higher levels of unit labor cost. This leads to a positive association between the level of employment and the probability to export. On the other hand, firms with a high number of employees can perform poorly due to diminishing returns to labor in production, potentially leading to a negative association between the employment level and the likelihood of exporting.
The coefficient on firm age is negative and statistically significant, possibly reflecting the nonmonotonic association between the firm age and the export decision. Indeed, as for the level of employment, the effect of the firm age on the probability of exporting may be, a priori, ambiguous. In effect, although firm age can increase the likelihood of exporting at lowest levels of age, it can also negatively affect the likelihood of exporting as the firm becomes older and do not innovate. This is particularly the case in lesser developed economies. To control for this, we include the log of firm age along with its squared term in the Specification 6 (column 6).
Furthermore, the internal financial health positively influences the probability to export, signaling the importance of link between financial factors and firm export behavior (see for instance Blalock & Roy, 2007; Manova, 2008; Bellone et al., 2010; Minetti & Zhu, 2011). Consistent with Wagner (2007), firms with a department specialized in research & development tend to make decision to sell abroad. While the baseline specification accounts for the main factors explaining the probability to export (Column 1), we nevertheless check the robustness of the baseline results to a number of sensitivity tests. We first control for industry-level heterogeneity to allow for productivity differentials across industries in the matching (Column 2). We then account for the localization in an industrial zone (Column 3), the squared values of employment and firm age (Columns 4-5), potential outliers (Column 6). The regression estimates are not also sensitive to dropping the most influential firms. These firms are those for which the Cook’s distance is greater than the conventional cut-off point 4/N, with N the number of observations. The Cook’s distance is derived from a regression of a log-linear Cobb-Douglas production function.
16 Unlike of the Probit model, the estimation of the coefficients of the regressor variables using a Logit model is not affected by the unequal sampling rates for exporters and non exporters (Maddala, 1992). This problem is frequent in large firm‐level datasets, particularly when the number of observation in one groups if is much larger than the number of in the other group. In our case, as it is mostly the case in developing economies, the number of exporters appears to be much smaller than the number of non‐exporters.
19 We further test the sensitivity of these results by using the two and three-nearest-neighbor matching estimators. This does not alter the statistical significance of the treatment effect and the magnitude of the export premium.17
4.2. Are exporters more productive than non-exporters?
The results on productivity differentials between exporters and non-exporters are reported in Table 5. We present the ATT and the derived export premium. In the baseline specification, the results strongly support the idea that exporting firms are more productive than their domestically-oriented counterparts. The LP is almost 46% greater for exporters than their more insulated domestic counterparts. Similarly, TFP is about 63% higher for exporters than for domestically-oriented firms. These results are consistent with the picture of earlier studies on the link between exports and productivity. The exporter productivity premium is robust to augmenting the baseline specification of the propensity score estimates with additional covariates. All these additional factors do not alter the statistical significance of the treatment effect.
Another result is that the export premium is far larger for TFP than for LP. This signals that export-market participation is proportionately more associated with the capital productivity than with the labor productivity. In the case of the self-selection hypothesis, this suggests that future exporters need to increase relative more the productivity of their capital than that of their labor. In contrast, if the export premium is driven by the learning hypothesis, this would suggest that exporting firms improve relatively more the capital productivity than the labor productivity after they enter foreign markets. In both hypotheses, this picture is quite consistent with the situation of the developing economies where the capital factor is relative less abundant than labor and where exporting requires relatively capital intensive technology. Consistent with the spirit of Greenaway and Kneller (2007), we control for industry
differences in the export premium by including industry dummies. Not surprisingly, this decreases the export premium by 2.64 and 1.83 percentage points, respectively for LP and TFP. The obvious explanation is that exporters are concentrated in different industries than non-exporters and reflects the difference of productivity differentials between industries, but this does not alter the statistical significance of the treatment effect. In contrast, taking into account the localization of the firm in an industrial zone leads to an increase of the export premium, signaling the fact that exporting firms locating in an industrial zone tend to be above the average in terms of productivity performance.
20 Controlling for the localization in an industrial zone also makes the treatment effect less clear-cut, but leaves its significance unchanged. The export premium decreases by 4.67 and 14.59 percentage points for the LP and the TFP, suggesting that the export premium is lower for firms located in industrial zones than for others. This is quite intuitive because as mentioned above, the localization in an industrial zone can be regarded as a factor generating positive externalities from exporters to non-exporters.
Similarly, accounting for the squared terms of employment and firm age reduces the export premium, relative to the specification (4), but does not alter its significance. Interestingly, this reveals the nonmonotone nature of the relation between firm employment and age and the propensity to export. Employment has a positive and significant effect on the likelihood to export, but at a decreasing rate. At lower levels, employment increases the probability to export but no longer beyond a certain threshold level of employment (Table 4, column 5). Table 5: Export premium
Average treatment effect on the treated
Export premium (%) LP TFP LP TFP Number of observations Baseline specification (1) Exporter dummy 0.360*** (0.123) 0.480*** (0.157) 43.422 61.715 Treated= 285 Untreated=752 (1) and controlling for the industry-level differences (2)
Exporter dummy 0.329*** (0.164) 0.514*** (0.146) 39.022 67.335 Treated= 285 Untreated=752 (2) and controlling for the localization in an industrial zone (3)
Exporter dummy 0.317** (0.134) 0.517*** (0.136) 37.376 67.854 Treated= 285 Untreated= 751 (2) and controlling for the squared term of employment (4)
Exporter dummy 0.288** (0.138) 0.446*** (0.160) 33.447 56.248 Treated= 285 Untreated= 751 (2) and controlling for the squared term of firm age (5)
Exporter dummy 0.313** (0.120) 0.462*** (0.143) 36.802 58.775 Treated= 285 Untreated= 751 (2) and controlling for potential outliers (6)
Exporter dummy 0.248*** (0.138) 0.430*** (0.134) 28.204 53.739 Treated=585 Untreated=1497 Notes: Bootstrapped standard errors for the ATT, using 50 replications are reported in parenthesis. Standard errors are presented in parentheses. Industry-level differences are controlled for by adding dummy variables for the following industries: garments, textiles, machinery & equipments, chemicals, electronics, metal industries, nonmetal industries, agro industries, and other industries.
This result was also found by Wagner (2007) on a comparable study for 14 countries. As for the firm age, the likelihood of exporting is also increasing with firm age up to a threshold level beyond where the sign of this association changes (Table 4, column 5). Finally, we control for the potential effect of outliers by running a regression of a log-linear Cobb-Douglas production function and dropping firms for which the Cook’s distance is greater than the conventional cut-off point 4/N, with N the number of observations. This also reduces the export premium, compared with that of the Specification (4). But, once again, the main result remains statistically significant at the 1 percent level. The result on the relative importance of the export premium for the TFP than for the LP also continues to hold after applying these
21 robustness tests. To sum up, the bottom line is therefore that Egyptian exporting firms perform better than their domestically-oriented counterparts.
4.2. Do firms self-select into foreign markets or/and learn from exporting?
In this section, we want to explain the exporter productivity premium find the previous subsection. To this end, we next differentiate between export-starters and export-continuers to test the self-selection hypothesis against the idea of the learning-by-exporting. The selection hypothesis is tested by comparing the productivity performance of export-starters and non-exporter in the period just before the export-starter enter the export market (pre-entry premium). For the hypothesis of learning from exporting, we compare the performance of export-continuers and non-exporters one year after continuers start to export (post-entry premium). The results are presented in Table 6. For each specification, we report both the pre- and post-entry premia, using the growth of LP and TFP as the outcome variable.
The results in the baseline specification clearly suggest that hypothesis that the productivity increases prior to exporting is not statistically significant. In contrast, the leaning effect is relatively more important, signaling that the export premium found in Table 5 is driven by the learning-by-exporting hypothesis. The treatment effect is much larger for the post-entry premium than for the pre-entry premium. The former is also statistically significant at any level of significance, while the latter is always insignificant.
The coefficients on the post-entry treatment effect indicate that LP grew 152.77% faster for exporter-continuers, one year after entering the export market, as compared with non-exporters. Similarly, exporting significantly and importantly increases the TFP. TFP growth is almost 123.05% higher for export-continuers than for firms producing for domestic markets only. Once again, however, TFP growth is not statistically different between export-starters and non-exporters. After controlling for the industry-level heterogeneity, the same picture remains, though the post-entry premium decreases by 38.16% and 23.05%, respectively for LP and TFP (Specification 2).
Also, the post-entry treatment effect becomes weaker when controlling for the localization in an industrial zone but its statistical significance remains unchanged (Specification 3). More interestingly, this leaning effect continues to be significant and economically large, even after further controlling for the squared terms of employment and firm age and potential outliers (Specifications 4, 5, and 6). The post-entry premium becomes insignificant only when we include the square term of employment. Nevertheless, we do not regard this as a rejection of the learning hypothesis because in such a case, we control for the nonmonotone association between employment and the likelihood to export. The focus is therefore more on the significance of the coefficients on employment and its squared term in the equation of the probability to export.
On average, the learning effect in Egypt is much larger than that commonly found in other developing countries, but more advanced countries. This definitely suggests that the more the economy is developed, the weaker will be the leaning effect. The extreme case is the situation of OECD developed countries for which there might be no evidence of learning from
22 exporting. This strong evidence of the learning from exporting hypothesis may be the result of the technical assistance of Egyptian exporters by foreign buyers. It can also be the reflection of the more intensive competition in international markets.
In contrast, the pre-entry treatment effect remains statistically insignificant, even after augmenting the baseline specification with additional conditioning information. A possible explanation of this insignificant export premium is that future exporters tend to hire more and export the relatively abundant production factor.
Table 6: Export premium: Pre-entry vs. Post entry
Average treatment
effect on the treated
Export premium (%) Number of
observations LP TFP LP TFP LP TFP Baseline specification (1) Pre-entry 0.164 (0.245) 0.411 (0.266) - - Treated=120 Untreated=622 Post-entry 0.617*** (0.222) 1.058*** (0.263) 85.424 188.115 Treated=165 Untreated=622 (1) and controlling for the industry-level differences (2)
Pre-entry 0.061 (0.269) 0.221 (0.285) - - Treated=120 Untreated=607 Post-entry 0.588** (0.275) 0.668*** (0.243) 80.043 95.108 Treated=165 Untreated=622 (2) and controlling for the localization in an industrial zone (3)
Pre-entry 0.140 (0.252) 0.356 (0.313) - - Treated=120 Untreated=607 Post-entry 0.468* (0.266) 0.702** (0.305) 59.714 101.943 Treated=165 Untreated=622 (3) and controlling for the square term of employment (4)
Pre-entry -0.049 (0.269) 0.301 (0.268) - - Treated= 120 Untreated= 607 Post-entry 0.397* (0.204) 0.816** (0.319) 48.846 126.292 Treated=165 Untreated=622 (4) and controlling for the square term of firm age (5)
Pre-entry 0.125 (0.261) 0.231 (0.213) - - Treated= 120 Untreated= 607 Post-entry 0.440* (0.231) 0.685*** (0.226) 55.413 98.431 Treated=165 Untreated=622 (4) and controlling for potential outliers (6)
Pre-entry -0.126 (0.199) 0.199 (0.259) - - Treated=117 Untreated=584 Post-entry 0.468* (0.257) 0.529** (0.232) 59.696 69.760 Treated=157 Untreated=596 Notes: Bootstrapped standard errors for the ATT, using 50 replications are reported in parenthesis. Standard errors are presented in parentheses. Industry-level differences is controlled for by adding dummy variables for the following industries: garments, textiles, machinery & equipments, chemicals, electronics, metal industries, nonmetal industries, agro industries, and other industries.
In short, the big picture is that in Egypt, the export premium is clearly driven by the leaning from exporting rather than by the selection of more productive firms into export markets. This is consistent with the picture commonly found in lesser developed economies. The learning
23 effect for Egyptian exporters found here is far larger than that found in relatively more developed economies.
These results do not necessarily call into question the idea of the importance of sunk costs in developing countries. One plausible explanation is that future exporters overcome the sunk costs of entering into exporting by benefiting from technology transfer from foreign buyers The immediate implication of the evidence for leaning rather than self-selection is that the technical assistance of overseas buyers solves the problem of the sunk costs, which is at the origin of the self-selection. Another possible explanation is the role of financial constraints. Indeed, the problem of access to financial services appears to be more important than that of the sunk costs.
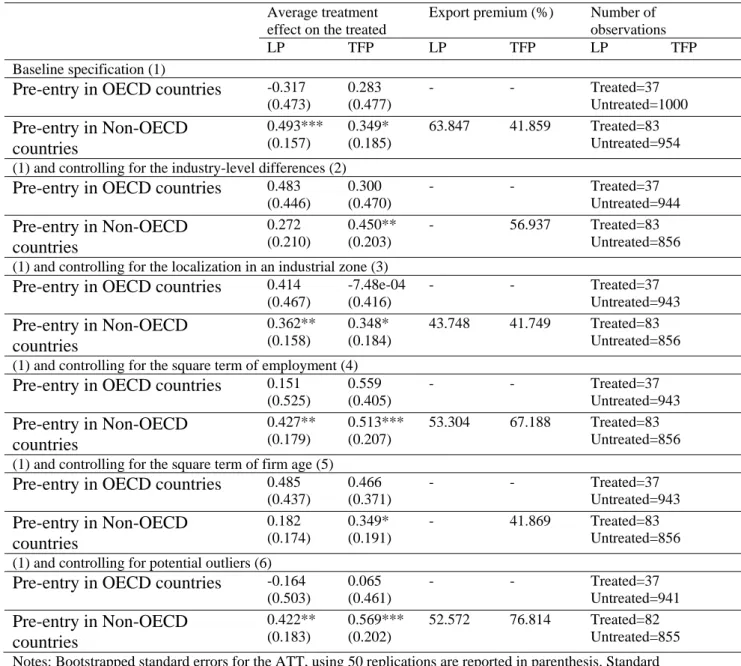
4.3. Does export destination matter for the selection process
In the previous subsection, we found strong evidence for learning-by-exporting and little evidence of self-selection into export markets. In this subsection, we explain why the pre-entry premium is not significant by differentiating the destinations between OECD countries and Non-OECD countries.
The underlying idea is that whereas exporters need to increase their productivity to be able to exports toward Non-OECD countries, they do not necessarily self-select into OECD countries. The reason is that they benefit from technical expertise of OECD importers. This technology transfer from OECD buyers to lesser developed countries sellers is likely to overcome the sunk costs of entry export markets, thereby making unnecessary the self-selection. In contrast, lesser developed countries future exporters do need to self-select into Non-OECD countries because they do not benefit from substantial technical assistance from these countries.
The results are presented in Table 7, which reports the same specifications as in Tables 5 and 6. The results strongly support our presumption. In the baseline specification, as anticipated, the ATT is statistically significant for the pre-entry in Non-OECD countries but insignificant for the pre-entry in OECD countries. The value of the ATT suggests an economically substantial pre-entry premium in Non-OECD countries, even if this premium remains lower than the post-entry premium found in the baseline specification of Table 6. Future export-starters in Non-OECD markets increase their productivity relative to non-exporters by 64.84% and 41.85%, respectively for LP and TFP (Specification 1).
With few exceptions, this picture remains unchanged, even after controlling for additional factors. The export premium for the pre-entry in OECD countries remains insignificant even after controlling for industry differences, the localization in an industrial zone, the square terms of employment and age, and potential outliers (Specifications 2, 3, 4, 5, and 6). As for the pre-entry in Non-OECD countries, the self-selection effect is important in most cases. When controlling for industry differences, the pre-entry premium increases by 0.09 and 0.10 percentage points, respectively for LP and TFP. However, after accounting for the localization
24 in an industrial zone, the export pre-entry premium decreases by 0.10 percentage points for TFP, though LP substantial increases.
Similarly, taking account of the square term of employment and potential outliers increases the pre-entry premium, even if controlling for the square term of age reduces it. These results, therefore, clearly point to the level of development of export destinations as the reason why we find no evidence that firm self-select into export markets.
Table 7: Export destinations and the self-selection process
Average treatment
effect on the treated
Export premium (%) Number of
observations
LP TFP LP TFP LP TFP
Baseline specification (1)
Pre-entry in OECD countries -0.317 (0.473) 0.283 (0.477) - - Treated=37 Untreated=1000 Pre-entry in Non-OECD countries 0.493*** (0.157) 0.349* (0.185) 63.847 41.859 Treated=83 Untreated=954 (1) and controlling for the industry-level differences (2)
Pre-entry in OECD countries 0.483 (0.446) 0.300 (0.470) - - Treated=37 Untreated=944 Pre-entry in Non-OECD countries 0.272 (0.210) 0.450** (0.203) - 56.937 Treated=83 Untreated=856 (1) and controlling for the localization in an industrial zone (3)
Pre-entry in OECD countries 0.414 (0.467) -7.48e-04 (0.416) - - Treated=37 Untreated=943 Pre-entry in Non-OECD countries 0.362** (0.158) 0.348* (0.184) 43.748 41.749 Treated=83 Untreated=856 (1) and controlling for the square term of employment (4)
Pre-entry in OECD countries 0.151 (0.525) 0.559 (0.405) - - Treated=37 Untreated=943 Pre-entry in Non-OECD countries 0.427** (0.179) 0.513*** (0.207) 53.304 67.188 Treated=83 Untreated=856 (1) and controlling for the square term of firm age (5)
Pre-entry in OECD countries 0.485 (0.437) 0.466 (0.371) - - Treated=37 Untreated=943 Pre-entry in Non-OECD countries 0.182 (0.174) 0.349* (0.191) - 41.869 Treated=83 Untreated=856 (1) and controlling for potential outliers (6)
Pre-entry in OECD countries -0.164 (0.503) 0.065 (0.461) - - Treated=37 Untreated=941 Pre-entry in Non-OECD countries 0.422** (0.183) 0.569*** (0.202) 52.572 76.814 Treated=82 Untreated=855 Notes: Bootstrapped standard errors for the ATT, using 50 replications are reported in parenthesis. Standard errors are presented in parentheses. Industry-level differences are controlled for by adding dummy variables for the following industries: garments, textiles, machinery & equipments, chemicals, electronics, metal industries, nonmetal industries, agro industries, and other industries.
4.3. The learning from exporting in a continuous treatment framework
The results reported so far suggest that exporting increases productivity through a learning from exporting rather than a self-selection of better-performing firms into export markets. But
25 an underlying fundamental question remains: considering the subpopulation of exporters, to what extent exporting increases firm performance? In other words, what is the effect of export intensity (export to output, in percentage) on firm productivity?
We explore the impact of exporting on firm productivity at each export to output ratio in the interval zero to one hundred. In so doing, we make use of the generalized propensity score (GPS) procedure developed by Imbens (2000) and Hirano and Imbens (2004) and adopted by
Fryges and Wagner (2008) and Fryges (2009) to study the export-productivity relationship in Germany and the UK. Instead of using the firm’s export status as a binary treatment, the GPS method is designed for analyzing the effect of a treatment intensity, that is, in our case, the firm’s export intensity. The advantage of such an approach is that it allows for continuous treatment, thus estimating a dose-response function describing the conditional expectation of firm productivity given the level of export intensity and the GPS.
Although the export to output ratio is randomly distributed, it is potentially correlated with firm characteristics and productivity performance. To remove such a bias, we make the weak unconfoundedness assumption suggesting that conditional on covariates, export intensity is independent of firm productivity.18 In estimating the conditional distribution of the treatment variable, we use the same set of covariates used previously to estimate the propensity scores. This set of covariates includes the log of employment, the log of average wage, the log of firm age, the share of working capital and new investments financed by internal funds or retained earnings, and dummy variables indicating if the firm has a department specialized in research and development and if the firm is located in an industrial zone. In line with the binary treatment propensity scores estimated previously, we also include industry dummies to remove the potential omitted variables bias associated with differences in the degree of vertical integration and capital intensity.
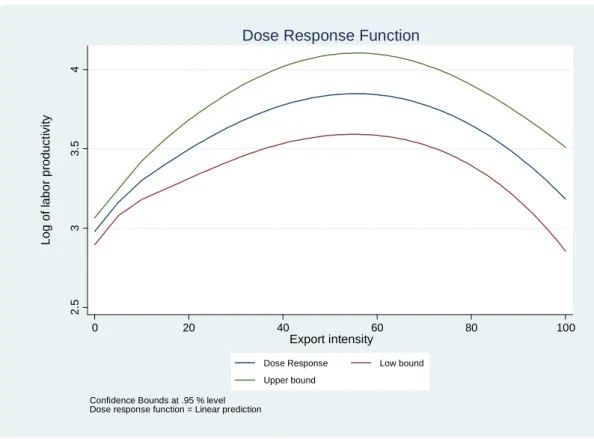
The estimated dose-response functions are presented in Figures 1 and 2, respectively for LP and TFP. These figures show an inverted U-shaped relationship between export intensity and firm productivity, both for LP and TFP. The results do not support the presence of multiple waves in the relationship between firm’s export intensity and their labor productivity, as suggested in the international management literature (see, for instance, Hitt et al. 1994;
Sullivan 1994; Riahi-Belkaoui 1998). In contrast, the results are in line with the findings by
Fryges and Wagner (2008) and Fryges (2009).19
18 Hirano and Imbens (2004) show that the GPS can be used to eliminate any biases associated with differences in the covariates.
19
In the international business literature, Geringer et al. (1989) and Gomes and Ramaswamy (1999), for example, also find a similar picture.
26 Figure 1: Estimated dose-response function using the labor productivity
2. 5 3 3. 5 4 Lo g of l abor pr oduct ivi ty 0 20 40 60 80 100 Export intensity
Dose Response Low bound Upper bound
Confidence Bounds at .95 % level Dose response function = Linear prediction
Dose Response Function
Figure 2: Estimated dose-response function using the total factor productivity
3. 5 4 4. 5 5 Log o f t o ta l f a ct or pr oduct ivi ty 0 20 40 60 80 100 Export intensity
Dose Response Low bound Upper bound
Confidence Bounds at .95 % level Dose response function = Linear prediction