Publisher’s version / Version de l'éditeur:
Vous avez des questions? Nous pouvons vous aider. Pour communiquer directement avec un auteur, consultez la première page de la revue dans laquelle son article a été publié afin de trouver ses coordonnées. Si vous n’arrivez pas à les repérer, communiquez avec nous à [email protected].
Questions? Contact the NRC Publications Archive team at
[email protected]. If you wish to email the authors directly, please see the first page of the publication for their contact information.
https://publications-cnrc.canada.ca/fra/droits
L’accès à ce site Web et l’utilisation de son contenu sont assujettis aux conditions présentées dans le site LISEZ CES CONDITIONS ATTENTIVEMENT AVANT D’UTILISER CE SITE WEB.
RTO-TR-AVT-080 - Vortex Breakdown over Slender Delta Wings, pp. 8-1-8-26,
2009-10
READ THESE TERMS AND CONDITIONS CAREFULLY BEFORE USING THIS WEBSITE.
https://nrc-publications.canada.ca/eng/copyright
NRC Publications Archive Record / Notice des Archives des publications du CNRC :
https://nrc-publications.canada.ca/eng/view/object/?id=1231a1aa-5292-4212-b6f1-2f01db353762 https://publications-cnrc.canada.ca/fra/voir/objet/?id=1231a1aa-5292-4212-b6f1-2f01db353762
NRC Publications Archive
Archives des publications du CNRC
Access and use of this website and the material on it are subject to the Terms and Conditions set forth at
Topology of the flow on a 65° delta wings
N.G. Verhaagen, MSc
Delft University of Technology, Department of Aerospace Engineering P.O. Box 5058, 2600 GB Delft, The Netherlands
X. Z. Huang
The Institute for Aerospace Research, National Research Council Canada 1200 Montreal Rd. Ottawa, Ont. Canada K1A 0R6
ABSTRACT
The flow topological structures over two 65o swept delta wings (a flat plate TUD wing and an IAR delta wing) have been investigated at varies angles of attack, sideslip and roll angles. The observed skin -friction line pattern has been used to infer the topology of the flow on the wing surface. Special attention was paid to the flow on the nose, the boundary-layer transition and the topological evolution as the attitude (control parameter) changes. Two large-scale wind tunnel models of the apex were constructed to obtain more data on the flow in this region. A correlative studies between kinematical flow space and critical states in dynamic space was conducted which shows useful information for further studies.
KEYWORDS
Flow visualisation, Topology, Delta wing, Vortices, Vortex breakdown
8.1
INTRODUCTION
Modern fighter aircraft are designed to rely on the lift generated by vortex flow to enhance maneuverability. Strong vortices generated at the leading edge of highly swept lifting surfaces are part of the overall flow field of such aircraft and may have a dominant effect on the whole flow field and the air loads. At high angles of attack a sudden change in the vortex flow occurs when the core of the vortex breaks down which introduces additional discontinuities and transients in the aerodynamics. Experimental studies of these flows are needed to develop mathematical models to represent the interaction between the vehicle motion and the air loads. As a prerequisite, understand the flow physics and the complex structure are the important stages towards solving the problem.
The widely used topology and singular (fixed) point analyses is a powerful tool towards understanding the flow physics and its complex structures, such as the location, structure and the origin of the boundary-layer separation lines, the status and the transition of boundary-boundary-layer, the structure of vortices - their left off, interference or breakdown, etc. It also can picture the evolution and the development of the flow structures when the attitude (control parameter) is changing. Moreover, the bifurcation in topologic evolution can be taken as useful information to diagnose the critical states in air loads, which is crucial to construct the mathematical model.
On the other hand, there are many limitations which should be kept in mind. The predictive ability of topology and singular point analyses is limited by their inherent qualitative nature and the fact that the Taylor expansion around a singular point is highly localised. The flow visualisation from surface oil flow streak only represents the time invariant equilibrium flow or time-averaged flow pattern on the surface
RTO-TR-AVT-080 8 - 1
where all unsteady informations are missing. The projection of the surface oil flow streak, or the skin-friction lines, into three-dimensional flow field off the wing is non-unique. The topological changes far away from the wing surface have a diminished effect on the skin-friction line topology as their pressure perturbations are damped over distance or overwhelmed by local flow field structure. Most important limit is that this analysis is in a kinematical space of surface flow streaks and not in the dynamic space of air loads.
Thus a complete and careful study both experimental and theoretical is necessary in order to understand the flow behaviour and to recognize the complex flow pattern. An reliable experimental correlation between the bifurcation in kinematical space and the critical states in dynamic space may help to explore the relations and to remedy the deficiency theoretically.
In viewing of this, extensive series of flow visualisation experiments on delta wing models were carried out both at the Delft University of Technology (TUD) in the Netherlands and in a joint program between the Institute for Aerospace Research (IAR) in Canada and US Air Force (SARL). A 65° swept leading-edge angle model was chosen as a benchmark in those studies. Profound results have been obtained and partly reported by Verhaagen and Jobe, Huang and Hanff, and Addington et al. [1]-[7] which are summarized in this chapter.
8.2
BRIEF OF TOPOLOGY
8.2.1 SURFACE FLOW TOPOLOGY
As this paper emphasis on the topology analysis about surface flow streaks, a brief introduction on surface flow topology theory is helpful for analysis the experimental results and theoretical considerations. Skin-friction lines describe the flow immediately on the surface of a body. Lighthill [8] postulates that these lines form the trajectories of a continuous vector field. When the visualization fluid is applied to the surface, it follows the path of least resistance along the surface. Streak lines on the surface indicate this path left behind by the fluid which is dragged along by the skin friction forces. The pattern formed by the streak lines can be used to determine a time-averaged phase portrait of the surface flow, which consists of a continuous vector field, V(χ), with a limited number of singular points. The characterization of the flow of a vector field in the neighborhood of a singular point is a classical topic of differential equations. The “linear part” or Hessian matrix of the vector field at that point,
j i 2 V χ ∂ χ
∂∂ , is the main content of the topology
theory and it dominates the local flow behavior. The importance of knowing those singular points and related topological analysis is at that all those singular points have an importance that the non singular points do not have. Basically they organize the entire qualitative nature of the velocity vector fields. The all qualitative properties of V(χ) on the surface are known if we know the locations and the types of all isolated singular points. Thus, the rules in topology are powerful tools for performing surface topological analysis and constructing corresponding flow patterns.
A fundamental background for the above concept published in literliture can be given as follows. Consider a surface of a body with the general orthogonal coordinates χ(ξ,η) on the surface ℜ2and a
coordinate ? normal to it. The components of the skin friction vector parallel to ? and ? can be denoted t1
(? ,?,0) and t2 (? ,?,0). For a steady or time-invariant equilibrium flow, the skin friction lines are defined
by the following autonomous (time invariant) differential system: ) 0 , , ( d ) 0 , , ( d 2 1 τ ξ η η = η ξ τ ξ
This equation defines the trajectories of the surface shear stress vector. Singular points in the pattern of the skin-friction lines occur at isolated points where the skin friction vector (t1, t2) becomes identically
8 - 2 RTO-TR-AVT-080
zero: 0 ) 0 , , ( ) 0 , , (ξ η =τ ξη = τ1 2
If the discussion is limited to the local behaviour of the singular point χ(? ,?), based on Taylor expansion around a highly localized singular point in the boundary layer on the surface, the nature of the phase portrait near this individual singular point may be determined by considering the two-dimensional linear system and by solving the eigenvalues of the matrix A.
ηξ = η ξ A d d
Bakker [9] classifies the phase portraits in terms of the trace (p = ?11 +?22) and Jacobian (q = ?11?22 - ? 12?21) where j i ij d d χ τ =
λ . A classification of the phase portraits in the plane (p,q) is shown in Fig. 1.
Depending on the value of (p, q), phase portraits can be classified into different forms. At the conditions of p≠0, q≠0 and ∆=p2-4q≠0, the phase portraits take the forms of saddles, nodes and foci as marked S, N
a
and Ns, and Nf, respectively, shown in Fig. 1. They are isolated, non-degenerate, or Morse critical points.
For the conditions of either p=0, q=0 or ∆=0 the corresponding points take the forms of centers, star shaped sinks and sources. They are non-isolated, non-degenerate, or non-Morse critical points and they are eventually conveying to the isolated points under perturbation.
A singularity is defined to be stable when all skin-friction lines pass through its origin. Through a saddle S pass only two skin-friction lines, while all the other lines miss the origin and take directions consistent with those of the adjacent lines. Following this definition, a saddle is unstable, because most of the skin-friction lines miss the origin. Nodes can be subdivided into nodal points and foci. At a nodal point there is one tangent line. All skin-friction lines are either directed outward away from the node (a nodal point of attachment Na) or inward toward the node (a nodal point of separation Ns). The other type of node, the
focus Nf , has no common tangent line. All skin-friction lines spiral around the origin, either out of it (a
focus of attachment) or into it (a focus of separation). Node and foci of attachment are stable singularities, because all skin-friction lines pass through their origin. Unstable nodes and foci are rare occurrences in skin-friction line phase portraits. If q = 0, the phase portrait consists of a line of singular points. These may be combinations of nodes and saddles, or foci and saddles. As will be noted later, these combinations occur frequently in the topology of the flow on a delta wing.
The singular points obey the following rules governing the topology of the skin-friction line patterns as derived in Refs [8], [10] and [11]:
• All skin-friction lines originate at a node of attachment (or source) and must end at a node of separation (or sink).
• Flow separation lines may originate from a saddle point (close separation) and end at a node of separation or it may originate from an ordinal point (open separation)
• Since the vector field is continuous, kinks in the separation lines are possible only with a node-saddle point combination
• The focus invariably appears in company with a saddle point
• On a closed body the number of nodes exceeds the number of saddles by two
The skin-friction lines give a direct indication of the flow close to the wing surface. As suggested by Hunt et al. [11], in the flow field off the wing, nodes and saddles can be defined just as they were for the flow on the surface (Fig. 2). The symbols A’and S’ are used to designate the attachment and separation lines on
RTO-TR-AVT-080 8 - 3
the surface, respectively. Subscript numbers indicate the order, e.g., S’
2 marks the secondary-separation
line. Just as the singular points on the surface, those off the surface satisfy certain topological rules. It should be noted that the projection of the two-dimensional skin-friction lines into the three-dimensional flow field off the wing is non-unique. The topological changes far away from the wing surface have a diminished effect on the skin-friction line topology as their pressure perturbations are damped over distance or overwhelmed by local flow field structure.
Fig. 1 Classification of phase portraits in (p,q) plane Fig. 2 Singular points on and off the wing surface (Bakker)
The above fundamental concept of topology theory will be applied on analyzing the flow pattern obtained in experiments and on understanding and constructing the surface flow structure at a fixed attitude such as an angle of attack, sideslip angle or roll angle, etc. However when the attitude, or the control parameter, changes the bifurcation in topology is another important aspect which should be investigated.
8.2.2 BIFURCATION IN FLOW TOPOLOGY
As modern fighter aircraft is expected to flight over wide range of angle of attack, sideslip and roll angle, the topological analysis is not only limited to the flow structure at certain attitude but, more importantly, to understand how the flow structure changes when the attitude varies. Even for the time-invariant equilibrium flows, the flow topology may change or evaluate as the parameter changes. For this time-invariant equilibrium flow the evolution equation can be described as:
) ; (x λ
F x&=
where F refers to a vector field which does not explicitly depend on the independent variables t, vector x is a state vector, x∈ℜn, ℜn is an n-dimensional state space and λ is the vector of control parameters. The
singular points are obtained by the vanishing of the vector field i.e. 0
) ; (x λ =
F .
When changes of the parameters cause an alteration of the number and type of singularities, the set of control parameters at which transition occurs is called the bifurcation set. From its effective area, bifurcation can be dived into two types of bifurcation: local and global bifurcation. The former one means a qualitative change occurring only in the neighbourhood of a singular point or a periodic solution of the system. While any other qualitative change is global bifurcation. The bifurcation has quite different stability feature, such as Inaccessibility, Modality (two or more distinct physical states), Divergence,
8 - 4 RTO-TR-AVT-080
Hysteresis, Anomalous (defined by a probability over the space of state variables rather than by an isolated point), Variance, Sudden Jumps, etc. These bifurcations can be classified into continues and discontinues or catastrophic bifurcations, depending on whether the states of the flow patterns vary continuously or discontinuously as the control parameter varies gradually through its critical value. Discontinue bifurcations can be further subdivided into dangerous and explosive bifurcations, depending on whether the system response jumps to a remote disconnected attractor or explodes into a large attractor, with the new attractor including the old attractor as a proper subset. The sudden jump can be understood as a large change (“sudden jump”) in the value of the state variable and the system jumps from one local minimum to another caused by a small change in the value of the control parameter. The flow may experience a loss of analytic dependence on the parameter. The simple diagram shown in Fig. 3 can be taken as examples of different bifurcations. Fig. 3a is an example of supercritical bifurcation. In this bifurcation there is at least one branch of stable bifurcating solutions that is continuous with the original solution at the bifurcation point. While in a subcritical bifurcation shown in Fig. 3b there is no branch of stable bifurcating solutions that is continuous with the original branch and normally the solution will jump from one stable branch to another. The diagram of Fig. 3c is a hybrid of super-and sub- bifurcation.
ε µ stable stable stable ε µ stable stable stable unstable unstable ε µ stable stable stable unstable
Supercritical bifurcation Subcritical bifurcation Transcritical bifurcation ε µ stable stable stable ε µ stable stable stable unstable unstable ε µ stable stable stable unstable
Supercritical bifurcation Subcritical bifurcation Transcritical bifurcation Fig. 3 Different bifurcation diagram
In conducted flow visualization experiments it has been observed that several singular points merge into less number singular points or split into more singular points shown below:
Ns S ⇔ NsS ⇔ regular point Na S Na ⇔ NaSsNa ⇔ Na Ns S Ns ⇔ NsSNs ⇔ Ns Nf S Nf ⇔ Ns
Detail discussions of these bifurcations are beyond the scope of this chapter. However recognising the presence and the type of bifurcation is often an important input for the proper description of a physical system. This input can be used either to save work or to provide qualitative and even quantitative information when even a mathematical description (i.e., equations) doesn’t exist.
8.2.3 CORRELATION STUDIES OF TWO TOPOLOGICAL SPACES
As emphasized earlier that all those previous discussions on surface flow topology are based on Taylor expansion around a highly localized singular point in the boundary layer on the surface. Moreover, the eigenvalues of the matrix A is based on the behaviour of streamlines which are in kinematic space and not in dynamic space related to flight dynamics. Therefore one cannot use the information obtained in the kinematic space to simply derive any information in dynamic space. In addition, the surface oil flow results only reflect time-average surface streaks. No unsteady behavior, which is important in high angle of attack, could be obtained. Thus, following a pilot study in an attempt to remedy the deficiency by
RTO-TR-AVT-080 8 - 5
Tobak [12], additional studies, both theoretical and experimental, have been conducted. Some of the theoretical consideration is presented here while the experimental correlation studies between the topological evolution and the critical states measured in dynamic space will be presented in the corresponding experimental part.
In the following discussion some assumption of a physical or intuitive nature, such as quasi-static evolution or adiabaticity (i.e., all time derivatives are very small) is imposed. Under this assumption the possible relations between two topological spaces are investigated.
From a familiar relation between skin friction, τ, and vorticity, ω, on an arbitrarily curved wall surface δs, the surface friction shear stress is one of a pair orthogonal vectors between skin friction, τ, and vorticity,
ω: n × ν = ω τ
While the vorticity (ω) has some relations with the surface pressure gradient. Applying the tangent components of Navier-Stokes equation on δs, the boundary vorticity flux from δs defined by σ≡−ν∂ω/∂n
has the following relation:
) ( p /∂ =−n×∇ +ν n∇ ⋅ − ⋅K ν∂ − ≡ ω ω ω σ n t
where K is the curvature tensor of δs and the suffix t denotes tangent components of any vector. If the viscosity term is omitted, the pressure gradient can be approximately expressed as:
σ × = ∇p n
The above first and the third equations show that τ, ω and ∇p, σ are two pairs of orthogonal vectors on the surface element, δs. It is interesting to see that the two pairs belong to kinematical and dynamic spaces respectively. The second pair looks less directly related to the identification of the surface flow topology. However, since the vorticity flux is the root of all vorticity in the flow, the surface topology must be the consequence of the development of the second pair, (∇p, σ). By combining the first and the third equations we have:
(
n)
p=n× −ν∂ω/∂ ∇
The above equations show that ω, σ and ∇p are vectors and should be subject to topological rules. These three fields can be understood as mapping from one to another in Banach space. From the definition of differentiable at a point of control parameter, in the case of subcritical bifurcation in boundary vorticity vector, the loss of analytic dependence on the parameter will result in the loss of analytic dependence of the pressure gradient and related aerodynamic loads on the parameter.
The above consideration can be further evaluated from boundary-layer equation if the discussion is limited at the surface excluding boundary-layer separation. In that region there are two layers of flow: a boundary-layer flow and an oil film flow underneath. By combining two familiar equations corresponding to the boundary-layer and the oil film and noticing that at the singular point: ui=τι=0 it is obtained that at
each singular point:
0 = = y p x p ∂ ∂ ∂ ∂
which means as mentioned by Tobak [12}, the existence of singular point in skin friction pattern is a sufficient but not necessary condition for the existence of a surface pressure extremum. Thus it could be imaged that in the case of subcritical bifurcation in flow topology, where a singular point (or points) discretely jumps from one location to another, the pressure extrema follow suit may result in a discontinuity in the pressure distribution and thus on the air loads.
In accompanying with the theoretical effort, flow visualisation experiments were conducted particularly
8 - 6 RTO-TR-AVT-080
around the parameters where airloads exhibited discontinuities and will be presented in the corresponding experimental section.
8.3
TUD EXPERIMENTS
8.3.1 EXPERIMENTAL SET-UP
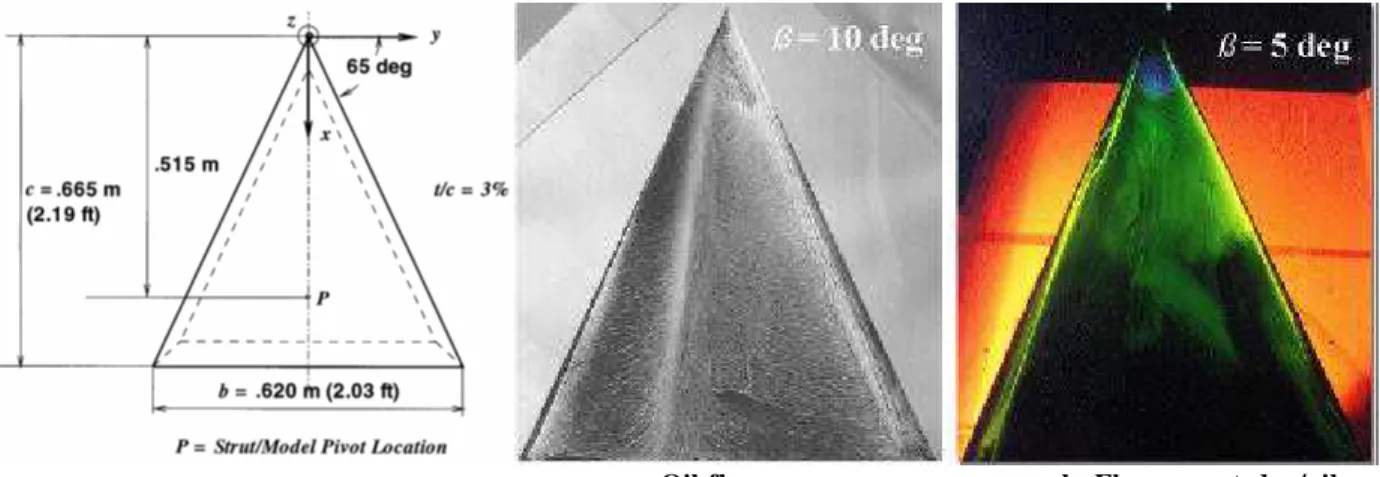
Tests were conducted on a model of a flat-plate 65o swept delta wing. As shown in Fig. 4, the wing has a
chord length c of 0.665 m and a span b of 0.620 m. The thickness equals 20 mm, yielding a thickness-to-chord ratio t/c of 0.03. The leading and trailing edges are sharp and beveled on only the lower surface at 31 and 23o, respectively. An x, y, z wing-axes system is used with the origin at the apex. The wing was
tested in the Low-Turbulence-Tunnel of the TUD Department of Aerospace Engineering in the Netherlands. This is a closed-circuit tunnel with an octagonal test section 1.80-m wide, 1.25-m high and 2.60-m long. The tests were conducted a constant angle of attack α of 30o and at an airspeed of 50 m/sec,
yielding a chord Reynolds number of 2.3 million. Although α was exactly 30o at zero airspeed, the elastic
deformation of the strut and balance system under aerodynamic load and the tunnel-wall-interference effects are estimated to yield an effective α as large as 36o [1].
The flow on the wing was visualized using two different fluids. One fluid, briefly called oil-flow fluid, consisted of a mixture of titanium dioxide, pipe clay, a surface tension relaxant and kerosene. The other fluid was a mixture of fluorescent-dye and oil. To visualize the latter mixture, it had to be illuminated using ultraviolet light. Fig. 5 shows the upper-surface pattern visualized with the oil-flow and fluorescent-dye fluid. These pictures were taken during the study of the effect the angle of sideslip (β) on the flow over the delta wing [1].
a. Oil-flow b. Fluorescent-dye/oil Fig. 4 TUD Delta wing geometry Fig. 5 Upper-surface flow pattern visualized using different fluids
8.3.2
FLOW VISUALISATION AND TOPOLOGICAL ANALYSIS
8.3.2.1 Observed Unsteady Behaviour
Flow visualisation tests indicated that the core of both the left and right leading-edge vortex breaks down at x/c = 0.20. The flow at the vortex breakdown point is unstable and oscillating. The breakdown points were observed to oscillate at a frequency of 4 - 5 Hz. The amplitude of the oscillations was about 3 % chord.
8.3.2.2 Flow Pattern on Lower Surface and its Topology
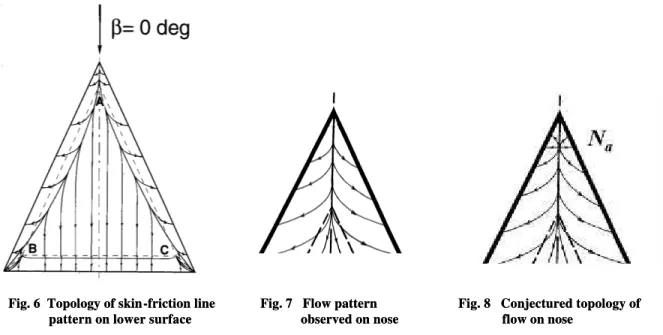
Fig. 6 shows the skin-friction line pattern on the lower surface. Short-dashed lines mark the inboard boundary of the beveled edges on this surface. The transition from the beveled edges to the flat lower surface is sharp, not rounded. For reference, the inside corners of the transition lines are marked A, B and
RTO-TR-AVT-080 8 - 7
C. A long-dash-dot line is used to mark the centerline of the wing. Solid lines (or curves) are used to mark surface skin-friction lines, as well as separation and attachment lines.
In Fig. 6, on the nose an attachment line is visible at the centerline. Downstream of the nose, this line splits into two separate lines. Outboard of these lines, the shear flow bends towards the leading edge and will leave the wing to mix with the shear layer from the upper surface to a free shear layer that rolls up into a primary vortex. Inboard of the two attachment lines, the skin-friction lines are parallel to the wing centerline and directed towards the trailing edge.
On the nose the skin-friction line pattern has been observed depicted in Fig. 7. The pattern suggests an attachment line at the centerline. From the attachment line the boundary layer flows outwards into the direction of the leading edges. Since at the present angle of attack the free flow impinges on the nose just downstream of the apex, a stagnation point can be expected to be located there. As shown in Fig. 8, this can be simulated by a node of attachment Na.
Fig. 6 Topology of skin-friction line pattern on lower surface
Fig. 7 Flow pattern observed on nose
Fig. 8 Conjectured topology of flow on nose
Fig. 6 Topology of skin-friction line pattern on lower surface
Fig. 7 Flow pattern observed on nose
Fig. 8 Conjectured topology of flow on nose
In the experiment, the resolution of the streak line pattern is too low to resolve this stagnation point. To understand the origin of the vortices over the wing, it is important to know the development of the flow downstream from this point. Theoretically, an idea of this can be obtained by considering the apex on a microscopic scale. Lighthill [8] suggests a topology for the flow on a thus blunt apex, as reproduced here in Fig. 9. It consists of a node of attachment Na on the upper and lower surface, and a saddle S at the apex.
At the saddle, two separation lines are formed which separate the skin-friction lines from the upper and the lower surface.
On the rear part of the wing, a bubble-type of boundary-layer separation occurs at the sharp transition between the flat central surface and the beveled trailing edge. The crossflow topology of this bubble is shown in Fig. 10. In Fig. 10, the attachment line A’ is marked by a solid line at a short distance downstream from transition line BC.
8 - 8 RTO-TR-AVT-080
Fig. 9 Topology of flow at apex (Lighthill [8]) Fig. 10 Bubble-type of boundary-layer separation
8.3.2.3 Flow Pattern on Upper Surface and its Topology
Fig. 11 shows the skin-friction line pattern on the upper surface. The pattern, well known from earlier experiments, is characterized by an attachment line at the wing centerline and a secondary separation line. At x/c ˜ 0.16, a kink is visible in the latter line. This is due to a transition of the boundary layer on the central part of the wing from laminar to turbulent. With Na at the nose of the lower surface, a total of 10
nodes and 8 saddles is conjectured on the wing. This satisfies the topological rule which states that the number of nodes should exceed the number of saddle points by two. In the following, the topology of the flow at the apex, transition and tip region will be discussed in more detail.
The flow pattern on the nose is not well resolved in the experiment. Several theoreticians have made conjectures for the topology of the flow in this region. The nose in these theories is magnified to such a degree that the leading edge becomes rounded and the apex blunt. Lighthill [8] suggests the Na S Na
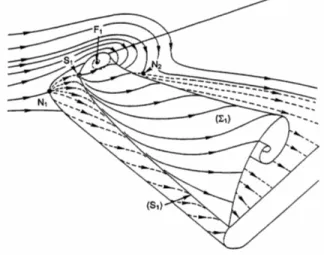
topology shown in Fig. 11. Associated with this, Délery [12] suggests a topology for the 3-d flow as shown in Fig. 12. From the saddle S, a primary-separation line S1
’starts from which a streamline surface
originates that rolls up into a spiraling vortex. If secondary separation occurs, the topology is conjectured to extend to that depicted in Fig. 13 with two saddle -nodes on the centerline. In the present experiment, a tertiary-separation line was observed upstream of the boundary-layer transition region. Based on this observation, the origin of the vortex system over the delta wing is believed to be a triple Na S combination.
Fig. 11 Topology of skin-friction line pattern on upper surface
Fig. 12 Topology of two-vortex flow at apex of delta wing, as conjectured by Délery [13]
RTO-TR-AVT-080 8 - 9
Fig. 13 Topology of four-vortex flow at apex delta wing, as conjectured by Délery [12]
Fig. 14 Topology of flow at apex, as conjectured by Peake and Tobak [14]
Peake and Tobak [14] suggest a development of the flow as shown in Fig. 14. The topology of diagram (a) is similar to that suggested by Lighthill, with the exception that the skin-friction lines at the node are conjectured to be tangent to the centerline. Diagram (b) is based on conjectures by Legendre [15] that the skin-friction line pattern consists of a Nf S combination associated with a “horn-type” of separation.
Diagram (c) and (d) show an increasing number of singularities. The latter diagram is based on an interpretation of the oil-flow pattern observed on a slender, rectangular wing by Wickens [16].
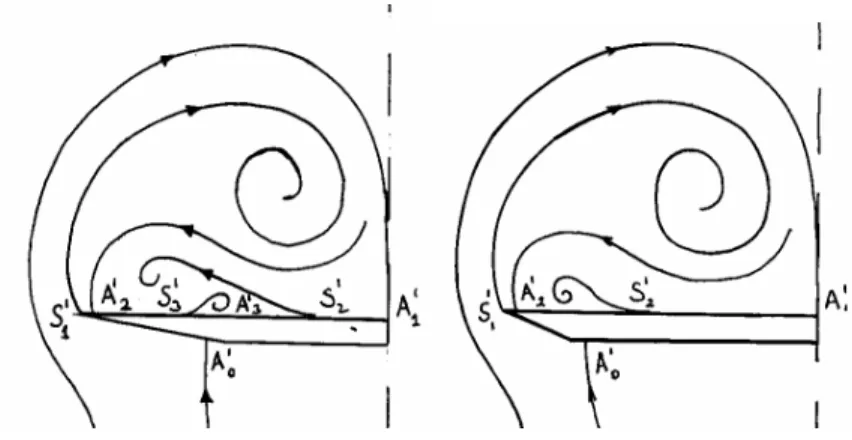
Since the skin-friction pattern on the nose is poorly resolved, the above theoretical topologies could not be verified in the present experiment. To better resolve the pattern, at TUD large-scale wind tunnel models of the apex have been constructed. Currently, wind tunnel tests are carried out to investigate the flow over these models. The models and some preliminary test results will be discussed in the next Sections. The conjectured topology of the crossflow upstream and downstream of the boundary-layer transition region is sketched in Fig. 15. The primary, secondary and tertiary separation lines are marked S1
’, S 2
’
and S3
’, respectively, while the attachment line on the lower surface is denoted A 0 ’, and A 1 ’ , A2 ’and A 3 ’ on the upper surface. 8 - 10 RTO-TR-AVT-080
Fig. 15 Crossflow topology (a) upstream and (b) downstream of transition region
Fig. 16 shows a schematic for the topology of the skin-friction line pattern in this region. This is characterized by a Nf S combination at the kink in the secondary-separation line
S2 ’
.
Fig. 16. Topology of boundary-layer transition region Fig. 17. Topology of flow at left-hand wing tip At the wing trailing edge, a saddle is conjectured at the center and a Ns S Ns combination at both tips. The
topology of the flow at the left-hand tip on a microscopic scale is shown in Fig. 17. The upper plot shows the pattern of the skin-friction lines on the upper surface, the central plot shows the singularities on the trailing edge enlarged to such a scale that it can be considered smooth and rounded, while the lower plot depicts the pattern on the bottom surface.
8.3.2.4 Flow Pattern on Apex Models
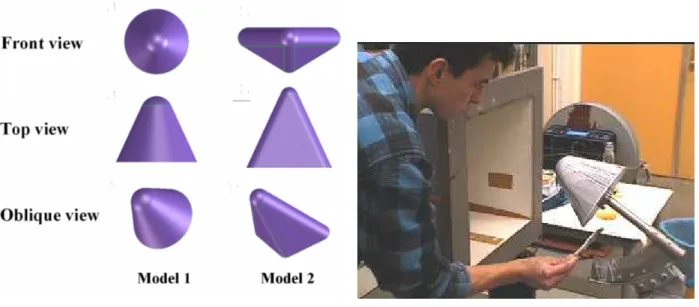
The two apex models are shown in Fig. 18. If one magnifies the apex region of the delta wing, the edges will no longer be sharp but of finite radius. Model 2 represents the smallest magnification of this region.
RTO-TR-AVT-080 8 - 11
It has a triangular cross section and rounded 65-deg swept leading edges. Leading edge and nose radii are 20 mm, the model length and span are 187 and 200 mm, respectively. Further magnification of the apex region may result in a hemisphere-cone configuration. This is represented by Model 1, which has a nose radius of 40 mm, a length of 160 mm and a span of 200 mm.
Fig. 18. Apex models Fig. 19. Flow visualizati on of Model 1
The models were constructed of PVC material and painted black for a higher contrast with the visualization fluids. Currently, an extended test program is being carried out to visualize in detail the flow on both models at various angles of attack and sideslip. For visualization the same two fluids are used as for the visualization of the flow on the delta wing. The tests are performed in an open low-speed wind tunnel with a nozzle of 0.40 m wide and 0.40 m high. An advantage of an open test section is that the visualization fluid can be applied to the model after the air has reached the desired speed. A closed test section has to be opened and the visualization fluid applied at zero air speed. It then takes some time to close the test section and bring the air to full speed. During this transition time part of the visualization fluid may dry resulting in a streak-line pattern that does not correspond to the flow pattern generated when the fluid is applied at full speed. The latter is a problem with models whose surface flow is sensitive to Reynolds number effects. Fig. 19 shows the test setup behind the nozzle of the open tunnel, oil flow is applied to Model 1. The model is mounted on a sting that is fixed to a (α,β) traversing mechanism. Preliminary tests have been conducted at an air speed of 20 m/s, being the largest speed attainable with the present set-up. In the following, the results of these tests are discussed.
a. Bottom surface flow
8 - 12 RTO-TR-AVT-080
b. Side surface flow
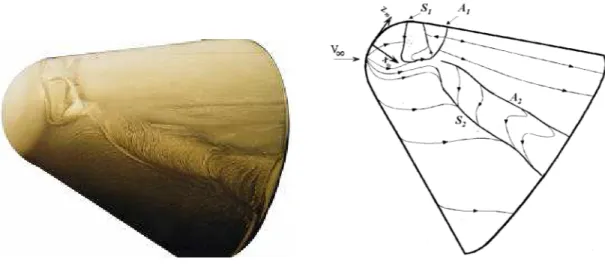
Fig. 20 Flow patterns on Model 1 for α = 35o
Fig. 20 shows photographs of the streak-line pattern and schematics of the skin-friction line pattern on the bottom surface and the side of Model 1 at α= 35o. On the bottom surface, a stagnation point is evident
and an attachment line A0 on the centerline. On the upper surface, a bubble -type of separation occurs at
the hemisphere/cone transition. The bubble separates at line S1 and reattaches at line A1. The boundary
layer from the lower surface separates at line S2 and reattaches at line A2. Note that these lines are not
connected to the first separation and attachment lines. In between S2 and A2 integral-shaped streak lines
are visible. The curvature of these lines increases on the aft surface of the model due to trailing edge effects. The streak line pattern shows the footprint of a single vortex on each half of the model.
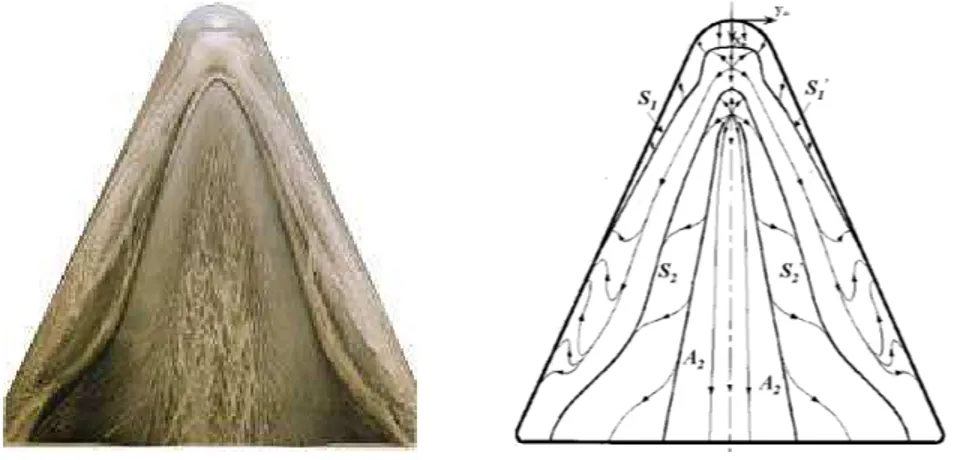
Fig. 21 shows the patterns on the lower and upper surface of Model 2 at α = 30o. The flow attaches on the
bottom surface at a stagnation point a short distance downstream of the apex. An attachment line Ao
emanates from this point. Closer to the leading edge another attachment line A1 is visible. The streak
lines outboard of this line sweep around the round leading edge to separate at the primary-separation line S1. The separated flow reattaches at line A2 on the upper surface and separates again at
secondary-separation line S2. Between these lines, integral-shaped lines mark the footprint of the secondary
separation. The attachment and separation lines start at the centerline of the model and proceed along rays towards the trailing edge. This correlates with the flow topology suggested by Délery [12]. Upstream of the trailing edge, a kink can be noted in the secondary-separation lines. This is believed to be due to trailing-edge effects. The pattern on the upper surface hence shows the onset of a primary- and secondary separation. There are no markings of a tertiary separation.
a. Lower surface flow
RTO-TR-AVT-080 8 - 13
b. Upper surface flow
Fig. 21 Flow patterns on Model 2 for α = 30o
The preliminary tests have been conducted at an air speed of 20 m/s. Based on chord length the Reynolds number of the models is of the order of 105. A question is how to actually define the Reynolds number of
these models. If this number would be based on e.g. the leading edge radius, which is 200 times larger than that of the delta wing model, or on the chord of a delta wing 200 times larger than the one tested here, the Reynolds number would be of the order of 107. An important effect of increased leading edge radius is
the occurrence of Reynolds number sensitivities, especially as regards to separation onset. Using sharp leading edges as in the case of the 65o delta wing eliminates this Reynolds number sensitivity. The
capability for studying the sensitivity of the streak-line patterns of the apex models to Reynolds number is limited. The viscosity of the visualisation fluid requires a minimum air speed of 10 m/s, while the maximum speed for the present test set up is about 20 m/s. In this speed range effects have been observed on the streak-line pattern of Model 1. At air speeds below 15 m/s the separation lines S1 and S2 become
connected. In addition, an extension of the vortex footprint area between the lines A2 and S2 has been
observed. No effects of the air speed have been observed on the streak-line pattern of Model 2.
8.4
IAR/USAF EXPERIMENTS
8.4.1 EXPERIMENTAL SET-UP
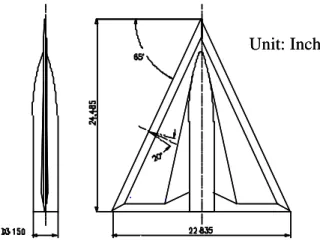
Wind-tunnel tests were conducted at the Wright Laboratory 7 ft x 10 ft open-return atmospheric tunnel (SARL) and at the IAR 6 ft x 9 ft close-return wind tunnel (LSWT). A 65° delta wing model (Fig. 22) was statically tested over a range of angles of attack at 0° sideslip angle or over a range of sting angles (σ) and roll angles (φ). The positive roll angle is defined as the port wing half rolls down. Most of the tests were conducted at a Reynolds number 2.4 million based on the mean aerodynamic chord and a Mach number of 0.3. In order to obtain clear picture, the viscosity of the silicon oil and titanium dioxide mixture was tailored to optimise the observation of prescribed features. Photographs were taken to capture the surface flow patterns during/after wind on. High-resolution videos recorded the development of these patterns and were used to resolve some ambiguities in the flow direction near the surface. In addition, different oil and tailored dioxide mixture was used at each interested attitude so that the oil and dioxide particles separated from surface or attached to surface can be visualized, which was found very helpful to understand the possible three-dimensional flow structure near the surface. An important aspect of the experiment was to investigate the evolution of the topological change as the attitude varies. Detailed oil flow patterns were recorded at various attitude angles such that all possible topologies would be identified. Very intensive experiments were conducted at the vicinity of each recognized topological change in order to understand how possible topological change appears. Particular attention was placed around those angles where airloads exhibited various types of discontinuities founded in previous static experiments.
8 - 14 RTO-TR-AVT-080
Unit: Inch Unit: Inch
Fig. 22 IAR 65° delta wing model 8.4.2 FLOW VISUALISATION AND TOPOLOGICAL ANALYSIS 8.4.2.1 FLOW VISUALISATION
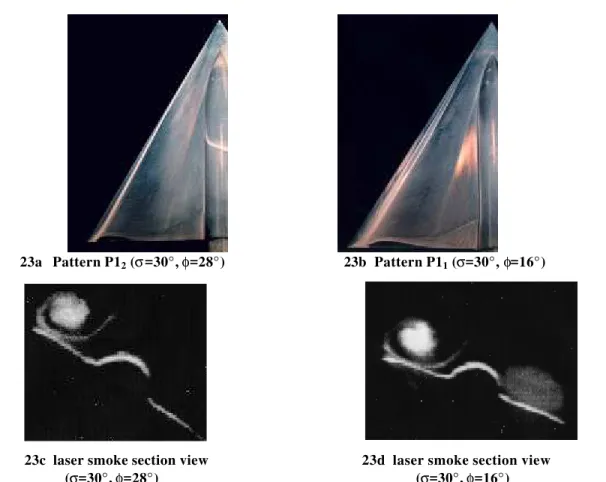
Profound flow visualisation results have been obtained either in pitch or in roll plane. Varieties of mean surface flow patterns, their evolutions have been observed as the governing parameter (roll angle or angle of attack) changes. As examples the results in roll plane for two sting angles σ?= 30° and 35° and roll angles -21°< φ? <62°, are presented from Fig. 23 to Fig. 26 and discussed here.
At very high roll angle (Fig. 23a left), the flow pattern exhibits a concentrated leading edge vortex on the leeward wing half, characterised by the presence primary and secondary separation. The tertiary vortex is hard to see at this attitude. This is probably due to at very high roll angle the equivalent leading-edge sweep-back angle for the corresponding leeward wing half becomes very large as the following equation shows: φ ∗ σ ± Λ = Λ 0 tan sin
From the equation, the corresponding leading-edge sweet-back angle at the flow condition of Fig. 23a (σ=30°, φ=28°) is around 80.5°. At such large swept back angle the circulation and axial vorticity is insufficient to introduce the tertiary vortex. Also the corresponding leeward wing becomes very narrow as shown in Fig. 23a. Both of them are unfavourable to the tertiary vortex to appear. Moreover, it looks there is no any visible kink point in the secondary separation line indicating the boundary layer in the reattached area may still be laminar due to shorter length of streamline and lower local Re number. At a little lower roll angle the tertiary separation line appears (Fig. 23b). The kink point in the secondary line appears roughly at middle chord. Those two feathers are clearly seen from corresponding section views shown in Fig. 23c and Fig. 23d)
RTO-TR-AVT-080 8 - 15
23a Pattern P12 (σ=30°, φ=28°) 23b Pattern P11 (σ=30°, φ=16°)
23c laser smoke section view 23d laser smoke section view (σ=30°, φ=28°) (σ=30°, φ=16°)
Fig. 23 Concentrated vortex patterns and related section views
When roll angle decreases more, at least one whorl corresponding to a focus at where the secondary or tertiary vortex lifts off the surface (Fig. 24) indicating breakdown of those vortices. Fig. 24a shows the secondary vortex is well organised but the tertiary one is close to breakdown near the trailing edge with a “whorl” lift-off from the surface. When the roll angle further decreases the secondary one is also close to breakdown so that two “whorls” appear on both of them as depicted in Fig. 24b. Further decrease of roll angle leads the tertiary one merges into secondary vortex and the “whole” on the end of secondary vortex move forward (Fig. 24c).
24a Pattern P21 (σ=30°, φ=14°) 24b Pattern P22 (σ=30°, φ=7°) 24c Pattern P23 (σ=30°, φ=4.6°) Fig. 24 Vortex “whorl” patterns
8 - 16 RTO-TR-AVT-080
Further reductions in roll angle results in the primary vortex breakdown location moving on to the wing (Fig. 25a to Fig. 25d). The kink point in the secondary separation line can be clearly observed in the forward potion of the wing at ~10% of the root chord (Fig. 25a). This pattern could appear either at windward half or leeward half when the roll angle is relatively smaller. As seen from Fig. 25b on windward side (right wing half), the vortex breakdown location is around 10% of the root chord. There is no any sign of tertiary vortex and related separation line on windward side, indicating the strength of the vortex on this half is much weaker than leeward half as seen in Fig. 25b, 25c and 25d.
25a forward part P31:P31 25b forward part P31:P32 25c part of left wing P31 25d part of right wing P32
(σ=30°, φ=0°) (σ=35°, φ=2.5°) (σ=35°, φ=2.5°) (σ=35°, φ=2.5°) Fig. 25 Vortex bursting patterns observed on different wing areas
When the wing half under consideration is sufficiently to windward, and the primary vortex breakdown location is near or at the apex, a variety of spiral or reverse patterns may develop (Fig. 26). All those patterns are mainly due to the interaction and balance between the spiral flow starting from leading-edge and reverse flow from trailing edge.
26a pattern P41 (σ=30°, φ=14°) 26b pattern P42 (σ=30°, φ=47°) 26c pattern P43 (σ=35°, φ=59°)
RTO-TR-AVT-080 8 - 17
26d pattern P44 (σ=30°, φ=51°) 26e P45 (aft part, σ=35°, φ=62°) 26f P45 (apex, σ=35°, φ=62°) Fig. 26 Flow visualization of spiral flow patterns
It is important to note that a strong spiral flow is still alive during this period. In addition, the reverse flow on the windward half is getting fiercely due to the equivalent sweep-back angle decreases and the trailing edge resembles partly as wing side edge as the roll angle decreases further. Moreover the axes of spiral flow at first is still along the axes of vortex as in the previous stage but as the roll angle increases further, its axes lift off the surface eventually due to the stronger reverse flow. This lift-off process is gradually getting stronger as the roll angle increases. At first, the strength of spiral flow is still stronger or equivalent to that of the reverse flow leading to a tiny focus appears along middle chord near the leading-edge as shown in Fig.26a. When the roll angle further increases the reverse flow becomes stronger than the spiral flow which pushes the influence area of spiral flow upstream as shown in Fig. 26b. Also the strong reverse flow mixes with spiral flow resulting in a remarkable focus on the wing surface as seen in Fig. 26b. Part of spiral flow is involved in the reversed flow from trailing edge results an additional focus develops near the trailing edge as shown in Fig. 26b, 26c and 26e. Also it was found that if one focus is not enough to handle all the vorticities in the reverse flow two foci could appear as observed in Fig. 26d and 26e. It is remarkable that the range of roll angles when the spiral flow exists is quite large in roll case comparing with the range of angles of attack in pure pitch case. This is probably due to the fact that in roll case, roll angle induced effective angle of attack and sideslip angle can be obtained from the following equations: φ ∗ σ = α tan cos tan φ ∗ σ = β sin sin sin
The effective angle of actually, decreases as the roll angle increases, which partly cancels out the roll effect resulting in the spiral pattern existed in large range of roll angle. For example at 50° roll angle and 30° sting angle, the effective angle of attack, sideslip and leading-edge sweepback angle is only 20°, 26°
and 2° respectively. At such attitude, the flow will not be like dead water but separated and reattached on the surface downstream of leading edge. Actually from section view of laser sheet visualisation a reformed leading-edge vortex has been observed at such high roll angle.
At extreme roll angles a separation bubble develops destroying any discernible pattern. 8.4.2.2 FLOW TOPOLOGY ANALYSIS
By synthesizing our results with those of other flow visualization experiments the flow visualization results have been interpreted into various topology patterns. As examples the topological changes in roll
8 - 18 RTO-TR-AVT-080
plane at eight attitudes are sketched in Fig. 27. The singular points and corresponding topologies associated with the centerbody have been omitted in Fig. 24 for the sake of simplicity. The variety of mean surface flow topologies can be classified into five major categories: concentrated vortex pattern (P1), vortex “whorl” patterns (P2), bursting vortex patterns (P3), reverse flow patterns (P4) and totally separated flow pattern (P5). The above list reflects the patterns in the order in which they appear on a wing half as it moves from leeward to windward. Each category may include more than one pattern depending on attitude. Patterns are topologically different due to the addition or deletion of nodes or saddles. The nodes are denoted Na for a node of attachment, Ns for a node of separation, and Nf for a
focus or spiral node. The saddle is denoted by S. The numerical subscript identifies the specific singularity. Combined or higher-order singularities are enclosed in parentheses e.g. (NsS)1. Bear to
mention that the figures describing the topology are not drawn to scale. Furthermore, to avoid excessive cluttering of lines converging toward the apex, the closely spaced singular points there have been separated longitudinally and labelled on a line next to the apex. Those points are, in fact, merged singular points and thus appear to be of a higher order. A simila r approach is used at the trailing edge where the primary reattachment saddle is virtually coincident with a node of separation and the reattachment saddle associated with the left wing half spiral flow. The single attachment node on the windward, lower surfaces is common to all patterns and is denoted by Na1 at the right of the apex.
RTO-TR-AVT-080 8 - 19
Fig. 27 Evolution of surface flow topology on a 65 delta wing at different attitudes
The concentrated vortex pattern, P1 in Fig. 27a to Fig. 27d, appears on the leeward wing half (port) at very large roll angles. When roll angle is reduced, a “whorl” pattern (P21 in Fig. 24e) suddenly appears on the leeward wing half, characterized by the presence of a ‘whorl”. This is a focus, NF, where the flow sharply
lifts off from the surface due to the tertiary vortex lifting off. The topology abruptly evolves from the original node of separation, NS, and the reattachment saddle, S, associated with the tertiary vortex into
combinations of singular points: NS? NS1−S2−Nf1
S? S3−Na2−S1
As the roll angle is decreased further, this whorl moves forward and a second one reflecting the lifting-off of the secondary vortex suddenly appears (P22 in Fig. 27f) with the following topological evolution:
NS→Ns1−S2−Nf2
S→ S3−Na2−S6
Additional reduction in the roll angle results in the rapid disappearance of the first whorl (and corresponding topological change (from Fig. 27f to Fig. 27g) i.e.S4 − Nf1→ NS S, followed by the
disappearance of the secondary whorl leading to a bursting vortex patterns (P3). The corresponding surface flow topologies are shown by sub-patterns (P31 and P32) in Fig. 27f and Fig. 27h respectively.
Once the wing half under consideration is sufficiently to windward and breakdown is near to or at the apex, the shear stress of the flow near the surface is considerably reduced leading to the disappearance of the separation and reattachment lines on the surface. However, there is a weak spiral flow appears as indicated by a focus near mid-chord (Fig. 27e and Fig. 27h) which gradually moves forward as the wing half rotates to windward.
Further reduction in the roll angle results in this focus moving aft accompanied by a strengthening of the shear stress, possibly due to the reduced angle of attack. The original focus splits into NF→NF−S7−Ns6 as
seen in Fig. 27d. It was experimentally difficult to determine exactly when these changes occurred as they take place near the model tip where the resolution of the images is not sufficient. Concurrently, some new singular points also appear near the trailing edge. At even lower roll angles, the spiral flow area becomes even stronger resulting in the appearance of a second focus as seen in Fig. 27a, 27b and 27c.
Finally, at very low roll angles, the spiral flow over the windward wing half disappears and a separation bubble is formed. Under these conditions no discernible oil flow pattern is produced (P5) leading to its exclusion from Fig. 27.
8 - 20 RTO-TR-AVT-080
8.4.2.3 EVOLUTION OF FLOW TOPOLOGIES
From the above observed topology changes the evolution of flow patterns on the model corresponding to a variety of attitudes in roll plane are listed in a Table below. In some cases there is an uncertainty regarding a particular pattern due to limitations in the image quality or due to excessive flow unsteadiness that does not seem to result in discernible mean pattern. The sting angles in the table have been corrected for the sting deformation under airloads. Careful study by intensive experiments along bifurcation point of roll angle shows that there are at least three different types of topology evolution exist when the roll angle is changing near a bifurcation point. One is local and gradual topology change. The second is local but sudden topology change. And the third one is global and sudden change in flow topology. For the first one, the singular points in surface flow topology either move continuously on the surface or gradually merge or split into other types of singular points. As an example the flow topology pattern changes from P41 to P42 is this type of bifurcation. For the second one the singular points change suddenly but limited
in some local area. The tertiary vortex lefts off with corresponding topology change from P21 to P22 is an
example of this evolution. For the third one the topology pattern changes suddenly and globally. It looks as the flow topology jumps between two distinctive flow patterns no matter how small the roll angle changes. The topology changes from P11 to P41 or from P31 to P41 belong to this type of bifurcation. In
addition, an oscillatory bifurcation between two flow patterns was also recognized in the experiments. The information of topology evolution is helpful in the correlation studies between surface flow topology and critical states in airloads.
Flow topologies (σ=30°) Flow topologies (σ=35°)
φ° Port Starboard φ° Port Starboard
0 P31 P31 0 P31 P31 4 P31 P31 1.2 P31 P31 4.6 P22 P31 2.5 P31 P32 4.8 P22 P31 6 P31 P41 5.2 P22 P31 7 P31/P23 P41 6 P22 P31 9 P31/P23 P41 6.5 P22 P31 12 P11/P23 P41? 7 P22 P31 14 P11/P23 P41? 7.5 P22 P41(weak) 21 P11 P41/P42 8.4 P22 P41 28 P11 P42 10 P22 P41 37 P11 P42 11.2 P22 P41 42 P11 P42 12 P22 « P21 P41 59 P11 P43 14 P21 P41 62 P11 P45 16 P21 P41 67 P11 P5 21 P11 P42 69 P11 P5 28 P11 P42 32 P11 P42 40 P11 P42 42 P11 P42 47 P11 P42 51 P11 P44 57 P11 P11
8.4.2.4 CORRELATION STUDY BETWEEN TOPOLOGY CHANGE AND CRITICAL STATES An important step for understanding and applying the nonlinear indicial response method and other nonlinear flight mechanics is the recognition of “critical states” defined as points within the motion history
RTO-TR-AVT-080 8 - 21
where Fr
è
chet differentiability of the aerodynamic response functional is lost. How to locate or how to detect the critical states is a prerequisite for solving the non-linear flight mechanics. As previous mentioned that the sub-bifurcation in surface flow topology might be a sufficient but not necessary condition for the critical states. It is worthwhile to study the related experimental results. Thus the critical states found by measured airloads in stationary model condition are compared with topological bifurcation as shown in the table below. It is interesting to see that for each governing parameter (roll angle) where a statically measured critical state exists, there is a corresponding topological change nearby as shown briefly in the table. Detail looking the evolution of topologies when governing parameter (roll angle) is across that value, it is found that the topological change behaves as it jumps between two quite different topologies as a kind of subcritical bifurcation involved.Critical states Topological changes Observations in flow visualization experiment σ=29° ,φ=5° P31:P31↔P22:P31 two whorls appear suddenly on secondary and tertiary vortices
σ=29° ,φ=8.2° P22:P31↔P22:P41(weak) separation and attach line of secondary vortex disappeared
while a very weak focus appear at the middle area of the wing σ=29° ,φ=11.6° P22:P41↔P21:P41 a whorl at the end of secondary vortex suddenly disappeared
σ=29° ,φ=50.1° P11:P42↔P11:P44 one focus suddenly splitted into two bigger foci
σ=29° ,φ=51.5° P11:P44↔P11:P5 skin-friction line disappeared suddenly
σ=35° ,φ=1.2° P31:P31↔P31:P32 secondary vortex disappeared suddenly
σ=35° ,φ=3.5° P31:P32↔P31:P41 separation and attach line of secondary vortex disappeared
while a very weak focus appeared at the middle area of the wing σ=35° ,φ=62.1° P11:P43↔P11:P45 large focus appeared suddenly near the trailing edge
On the other hand there are some topology changes (for example P21:P41? P11:P41 and P11:P41? P11:P42
corresponding to the attitudes of σ=30°, φ=14°∼16° and σ=35°, φ=21°) which are not associated with a measurable critical state. One thing is noticed that the effects of those topological changes on the airloads are probably too small to be detected. For instance, when topology changes from P21 to P11, the only
change is the tertiary vortex. Its effect on the loads might be very small. As for the topology change from P41 to P42 with increasing roll angle, the continuous video images show that the Nf moves forward
smoothly till the vicinity of the apex and then moves back resulting in the smooth flow pattern changes from P41 to P42. At its onset, the topology changes may be associated with small-scale structures that
have minimal effects on the aerodynamic forces, or they may be related to gradual process, e.g., a critical point of high order. In either case, the changes in flow topology may not have measurable effects on the aerodynamic forces, moments, or their derivatives.
From comparisons shown above it looks as if the subcritical bifurcation, jumps or discontinuities in airloads can be expected. In other words a subcritical bifurcation in flow topology could be referred to as the sufficient condition for a loss in analytic dependency of the aerodynamic response. However it is worthwhile to reiterate that the above measured critical states come from static measurement, which ignores any spectral analysis or unsteady behavior and assumes the equilibrium states being time-invariant. Also the measured amount of discontinuity is limited by the uncertainty of experiments. That means much of the work needed for the reliability and the completeness. For example when vortex breakdown is across the trailing edge the principle change is the large time scale and fluctuation which could not be found by static test. Also when wing surface has geometrical discontinuity such as trailing edge bevel, it will result in vortex breakdown jumping between two relatively stable locations: one is downstream of trailing edge and another is upstream of trailing edge so as the related discontinuity in airloads. Identifying singular points in the skin-friction-line pattern does not go very far in clarifying the critical states and it can never be conclusive by means of experiment, no matter how carefully it is carried
8 - 22 RTO-TR-AVT-080
out.
8.4.2.5 POSSIBLE THREE-DIMENSIONAL FLOW STRUCTURE
One of the intentions in flow visualization experiment was to visualize the particles either separated from the surface or attached on the surface as these results are helpful to understand where and how the flow separates from or attaches to the surface and to construct possible three-dimensional flow structures near the surface. However, it should be emphasised that in order to unambiguously define the three-dimensional flow it is necessary to have other independent information, such as local pressure, etc. in addition to the surface flow visualization. Thus the possible three-dimensional flow structure presented here only corresponds to the best conjecture based on the observed topology and information from smoke flow visualization.
From observed flow patterns and topological analysis, possible three-dimensional flow structures corresponding to typical topological cases (P1 to P4) are hypothesised in Fig. 28. These flow structures can be imaged as contributions and interactions of three different types of flow: vortical flow from leading-edge, spiral flow over the wing surface and reversed flow from trailing edge. The first one is the flow separated from the leading-edge through free shear layer and rolls up into a concentrated vortex (P1) or partially breakdown (P2). The three-dimensional structures are shown on starboard wing half in Fig. 28a to Fig. 28d. The second type flow corresponds to that the leading-edge vortex is totally breakdown but it reattaches on the surface. It happens at high roll angle where the trailing edge acts partly as side edge resulting in stronger reverse flow along the trailing edge as the third type of flow. The interaction of these two flows lead to verity of P4 pattern as sown on port side wing half in Fig. 28.
Fig. 28 Conjuctured three-di mensional flow structures interpretated from surface flow topologies
RTO-TR-AVT-080 8 - 23
8.5
CONCLUSIONS
The flow visualization on 65o delta wings observed at various of angle of attack, sweep back angles and
roll angles were described. Topology theory is used to qualitatively describe the flow on the wing. Special attention is paid to the complex flow at the apex, boundary-layer transition and the evolution of topologies, especially in the vicinity of the critical state in dynamic space. Two large-scale wind tunnel models of the apex have been constructed in order to obtain more data on the flow in this region. Flow visualisation on these models shows the onset of primary and secondary vortices and results indicate that the conjecture of the flow topology near the apex of a delta wing by Delery [12] may be accurate. Correlation studies between flow topology and critical states strongly suggest that the subcritical bifurcation in flow topology may be a sufficient but not necessary condition for the critical states in airloads.
8.6
REFERENCES
[1] Verhaagen, N.G. and Jobe, C.E., "Topology of the Flow on a 65-deg Delta Wing at Sideslip," AIAA 2002-0095, Reno, Jan. 2002
[2] Huang, X.Z., Hanff, E.S., Jenkins, J.E. and G. Addington, “Leading-Edge Vortex Behavior on a 65° Delta Wing Oscillating in Roll,” AIAA Paper 94-3507.
[3] Huang, X. Z. and Hanff, E.S., “Leading-Edge Vortex Behavior and Surface Flow Topology,” AIAA Workshop III: Delta Wings-Unsteady Aerodynamics and Modeling, AIAA Atmospheric Flight Mechanics Conference, 1995.
[4] Jobe, C.E., Huang, X.Z. and Jenkins, J.E., “Impact of Static Topological Changes on Dynamic Airloads,” AIAA Workshop III: Delta Wings-Unsteady Aerodynamics and Modeling, AIAA Atmospheric Flight Mechanics Conference, 1995.
[5] Huang, X. Z. and Hanff, E.S., “Surface Flow Topology on a Delta Wing Rolling at High Incidence,” NPU/AIAA Atmospheric Flight Mechanics, Xian, China, 1996.
[6] Jobe, C.E., Hsia, A.H., Jenkins, J.E., and Addington, G.A., “Critical States and Flow Structure on a 65° Delta Wing,” J. of Aircraft, Vol. 33, No. 2, March-April, 1996.
[7] Addington, G.A., ”The Role of Flow Field Structure in Determining the Aerodynamic Response of a Delta wing,” Ph.D. Dissertation, University of Notre Dame, April 1998
[8] Lighthill, M.J., “Boundary Layer Theory,” Laminar Boundary Layers, L. Rosenhead, ed., Oxford, Cambridge, 1963, pp. 46-113.
[9] Bakker, P.G., ”Bifurcations in Flow Patterns: Some applications of the qualitative theory of differential equations in fluid dynamics,” Kluwer Academic Publishers, the Netherlands, 1991. [10] Tobak, M. and Peake, D.J., “Topology of Three-Dimensional Separated Flows,” Annual Review of
Fluid Mechanics, Vol. 14, 1982, pp. 61 - 85
[11] Hunt, J.C.R., Abell, C.J., Peterka, J.A. and Woo, H., “Kinematic Studies of the Flows around Free or Surface-mounted Obstacles; Applying Topology to Flow Visualization,” J. Fluid Mech. (1978), Vol. 86, Part I, pp. 179-200.
[12] Tobak, M and Coon, M.D., “Topology of Pressure Surfaces in Three-Dimensional Separated Flows,” AIAA Paper 96-0319, 1996.
[13] Délery, J.M., “Robert Legendre and Henri Werlé: Towards the Elucidation of Three-Dimensional Separation” Annual Review of Fluid Mechanics. 2001. Vol. 33, pp. 129-154.
[14] Peake, D.J. and Tobak, M., “Three-Dimensional Interactions and Vortical Flows with Emphasis on
8 - 24 RTO-TR-AVT-080
High Speeds”, AGARDograph No. 252, July 1980.
[15] Legendre, R., “Lignes de Courant d’un Écoulement Continu,” La Recherche Aérospatiale, No. 105, 1965, pp. 3-9.
[16] Wickens, R.H., “The Vortex Wake and Aerodynamic Load Distribution of Slender Rectangular Plates,” National Research Council of Canada Aero Report LR-458, July 1966.
RTO-TR-AVT-080 8 - 25
8 - 26 RTO-TR-AVT-080
![Fig. 14 Topology of flow at apex, as conjectured by Peake and Tobak [14]](https://thumb-eu.123doks.com/thumbv2/123doknet/14153992.472205/11.894.204.692.375.658/fig-topology-flow-apex-conjectured-peake-tobak.webp)