Publisher’s version / Version de l'éditeur:
Environmental Microbiology, 10, 4, pp. 950-966, 2008-01-23
READ THESE TERMS AND CONDITIONS CAREFULLY BEFORE USING THIS WEBSITE. https://nrc-publications.canada.ca/eng/copyright
Vous avez des questions? Nous pouvons vous aider. Pour communiquer directement avec un auteur, consultez la première page de la revue dans laquelle son article a été publié afin de trouver ses coordonnées. Si vous n’arrivez pas à les repérer, communiquez avec nous à PublicationsArchive-ArchivesPublications@nrc-cnrc.gc.ca.
Questions? Contact the NRC Publications Archive team at
PublicationsArchive-ArchivesPublications@nrc-cnrc.gc.ca. If you wish to email the authors directly, please see the first page of the publication for their contact information.
NRC Publications Archive
Archives des publications du CNRC
This publication could be one of several versions: author’s original, accepted manuscript or the publisher’s version. / La version de cette publication peut être l’une des suivantes : la version prépublication de l’auteur, la version acceptée du manuscrit ou la version de l’éditeur.
For the publisher’s version, please access the DOI link below./ Pour consulter la version de l’éditeur, utilisez le lien DOI ci-dessous.
https://doi.org/10.1111/j.1462-2920.2007.01516.x
Access and use of this website and the material on it are subject to the Terms and Conditions set forth at
Prokaryotic diversity of arctic ice shelf microbial mats
Bottos, Eric M.; Vincent, Warwick F.; Greer, Charles W.; Whyte, Lyle G.
https://publications-cnrc.canada.ca/fra/droits
L’accès à ce site Web et l’utilisation de son contenu sont assujettis aux conditions présentées dans le site
LISEZ CES CONDITIONS ATTENTIVEMENT AVANT D’UTILISER CE SITE WEB.
NRC Publications Record / Notice d'Archives des publications de CNRC:
https://nrc-publications.canada.ca/eng/view/object/?id=300f5878-6e31-43ad-a16a-0d8ce3eda61b
https://publications-cnrc.canada.ca/fra/voir/objet/?id=300f5878-6e31-43ad-a16a-0d8ce3eda61b
Prokaryotic diversity of arctic ice shelf microbial mats
Eric M. Bottos,1Warwick F. Vincent,2
Charles W. Greer3and Lyle G. Whyte1*
1Department of Natural Resource Sciences, McGill University, Montreal, Canada.
2Département de Biologie and Centre d’Études Nordiques, Laval University, Quebec City, Canada. 3National Research Council of Canada, Biotechnology Research Institute, Montreal, Canada.
Summary
The prokaryotic diversity and respiratory activity of microbial mat communities on the Markham Ice Shelf and Ward Hunt Ice Shelf in the Canadian high Arctic were analysed. All heterotrophic isolates and > 95% of bacterial 16S rRNA gene clone library sequences from both ice shelves grouped within the phyla Bacteroidetes, Proteobacteria and Actinobacteria. Clone library analyses showed that the bacterial communities were diverse and varied significantly between the two ice shelves, with the Markham library having a higher estimated diversity (Chao1 = 243; 105 operational taxonomic units observed in 189 clones) than the Ward Hunt library (Chao1 = 106; 52 opera-tional taxonomic units observed in 128 clones). Archaeal 16S rRNA gene clone libraries from both ice shelves were dominated by a single Euryarchaeota sequence, which appears to represent a novel phylotype. Analyses of community activity by radio-respiration assays detected metabolism in mat samples from both ice shelves at temperatures as low as -10°C. These findings provide the first insight into the prokaryotic biodiversity of Arctic ice shelf com-munities and underscore the importance of these cryo-ecosystems as a rich source of microbiota that are adapted to extreme cold.
Introduction
The areas of Earth that sustain life are dominated by cold environments, with approximately 75% of the biosphere existing at temperatures below 5°C (Cavicchioli, 2006). Research of these vast expanses of frigid habitat has recently revealed the importance of these environments as complex, active, ecosystems, home to diverse and
unique microbial communities (Deming, 2002). Studies of ice bound ecosystems are providing insight into how life may have existed when Earth experienced periods of widespread glaciations in the Paleoproterozoic (2.4 billion years ago) and Neoproterozoic (550–800 million years ago) periods (Vincent et al., 2000). Microbial ecosystems in cryo-environments are also of relevance to astrobiol-ogy, particularly with knowledge that the polar regions of Mars and the moons of Jupiter and Saturn contain stocks of frozen water capable of supporting life in the past or present (Kivelson et al., 2000; Malin and Edgett, 2000; Jakosky et al., 2003; Lorenz, 2003; Schulze-Makuch et al., 2005). Finally, the study of microbiology in cold environments is highly relevant to biotechnology and bioremediation; cold-adapted organisms and their enzymes are increasingly sought after and exploited in the food, chemical and textile industries, and for the reme-diation of contaminated cold environments (Gerday et al., 2000). The impetus to increase our understanding of cold ecosystems has led to the description of microbial assem-blages in other cryo-environments, including sea ice (Brown and Bowman, 2001; Brinkmeyer et al., 2003; Junge et al., 2004), lake ice (Mosier et al., 2007), perma-frost (Vishnivetskaya et al., 2006; Steven et al., 2007a) and glacial systems (Christner et al., 2003; Skidmore et al., 2005; Stibal et al., 2006; Zhang et al., 2007); however, many cold temperature systems remain little characterized to date. Ice shelves are regions of landfast sea ice that exist as perennial ecosystems in the Arctic and Antarctica. In both polar regions, these cryo-environments provide unique habitats for complex micro-bial mat communities (Vincent et al., 2000; 2004). These communities exist frozen and intact within the ice shelves through most of the year, and emerge seasonally in melt-water pools that form atop the ice shelf in summer months. These communities face many harsh environ-mental stresses, including constant exposure to low temperatures, fluctuations in salinity and high exposure to UV radiation during the summer months (Mueller et al., 2005). Under these summer conditions, the phototrophic biomass demonstrates high productivity and mats can be seen to make up the majority of the biomass in ice shelf ecosystems (Mueller et al., 2005). In addition to the large abundance of cyanobacteria (Vincent, 2007), the mat ecosystems from both polar regions contain bacteria, diatoms, chlorophytes, flagellates, ciliates, nematodes, tardigrades and rotifers (Vincent et al., 2000). Despite the diversity and complexity of these communities, analyses Received 23 October, 2007; accepted 27 October, 2007. *For
correspondence. E-mail lyle.whyte@mcgill.ca; Tel. (+1) 514 398 7891; Fax (+1) 514 398 7990.
of microbial mats from Arctic and Antarctic ice shelves have been predominantly restricted to the cyanobacterial components (Vincent et al., 2004; Jungblut et al., 2005).
The Ward Hunt and Markham ice shelves, located off the northern coast of Ellesmere Island in the Canadian high Arctic, are home to the richest reported Arctic ice shelf microbial mat communities. These ice shelves are among the remnants of a larger ice shelf that has been in place for at least 3000 years, but that has contracted 90% during the last century from 9000 km2to its current frag-ment sizes (Vincent et al., 2004). Meltwater pools atop the ice shelves in summer months resemble dilute seawater (Vincent et al., 2004), which remain predominantly as freshwater systems through the summer melt and become saline during freeze-up (Mueller et al., 2005). Mat communities exist submerged within the meltwater pools and on raised mounds of ice with little or no water cover. Mats at both ice shelves share similar architectures, although the mat material found on the Markham Ice Shelf is generally more developed than that on the Ward Hunt Ice Shelf. Various cyanobacteria (Nostoc, Phormidium, Leptolyngbya, Gloeocapsa) and eukaryotic algae (Chlo-rosarcinopsis, Pleurastrum, Palmellopsis, Brateococcus) were identified in these mats and found to be most abundant in the top 100–500mm of mat material (Vincent et al., 2004). High concentrations of non-cyanobacterial prokaryotes have been observed in these communities, but their phylogenetic diversity has not been assessed. As such, the prokaryotic communities in these mats remain largely uncharacterized.
The objective of this study was to evaluate the prokary-otic diversity, microbial distribution and metabolic activity in the mats on the Ward Hunt and Markham ice shelves using a combination of dependent and culture-independent techniques. This study represents the first detailed description of the prokaryotic assemblages in the microbial mats of High Arctic ice shelves, the first molecu-lar phylogenetic analyses of these mat communities and the first description of subzero metabolic activity in these mat communities.
Results
Site description
During the 2005 sampling, mats were found directly atop the ice at both the Ward Hunt and Markham ice shelves in meltwater pools and on raised mounds of ice. Tempera-ture, pH and conductivity of the water overlaying the mats at each sample site are presented in Table 1. During freeze-up, the mats experience much more extreme chemical and physical conditions due to freeze concen-tration of solutes and liquid water temperatures below 0°C. During the 2006 sampling period, mats were found
frozen beneath approximately 45–55 cm of snow on both ice shelves, with snow temperatures directly overlaying mat samples of -7.0°C at the Markham Ice Shelf and -2.0°C at the Ward Hunt Ice Shelf. In both seasons, the mats consisted of dark organic material covered with a 0.5–1 mm layer of highly pigmented orange biomaterial. On the Markham Ice Shelf in 2006, the mat samples collected ranged from 60 to 100 mm in thickness. The dark organic material did not appear to be stratified by macroscopic observation, and anoxic black sediments reported previously in thick mats from Arctic and Antarctic ice shelves (Mueller et al., 2005) were not observed in the samples analysed in this study. The mats sampled at the Markham Ice Shelf were generally classified as ‘orange mat’ and were more highly pigmented than those found on the Ward Hunt Ice Shelf which were classified as cohesive ‘matlet’ based on previous mat classifications (Mueller et al., 2006). Microscopic analyses showed that both mats contained a high concentration of mineral particles, as observed previously (Mueller et al., 2006).
Microbial enumeration and characterization
Cells with intact membranes, which were scored as live cells, were enumerated by direct microscopic counts of LIVE/DEAD BacLight-stained samples. Mat material col-lected from the Markham Ice Shelf and the Ward Hunt Ice Shelf in the 2005 field season were found to contain 3.6¥ 108 (⫾2.3 ¥ 107) live cells per gram of mat and 4.0¥ 108 (⫾6.9 ¥ 107) live cells per gram of mat respectively. Samples collected in the 2006 field season revealed the presence of 2.3¥ 108(⫾1.6 ¥ 107) live cells per gram of mat in Markham Ice Shelf samples and 6.9¥ 108(⫾5.0 ¥ 107) live cells per gram of mat in Ward Hunt Ice Shelf samples. Cells with compromised mem-branes were not enumerated due to difficulties in distin-guishing these cells from background fluorescence resulting from mat pigments and their degradation prod-ucts, other organic matter and sediments captured on the filters.
Table 1. Characteristics of water in the meltwater pools at sampling
sites on the Markham (MIS) and Ward Hunt (WIS) ice shelves in spring 2005. Site Location Temperature (°C) pH Conductivity (mS cm-1) MIS 1 83°01.90′N 1.5 7.39 1.83 71°27.15′W MIS 2 83°01.90′N 3.4 7.20 2.28 71°29.72′W WIS 1 83°04.87′N 1.0 8.26 0.53 74°25.84′W WIS 2 83°04.87′N 1.0 7.98 1.22 74°25.84′W
Prokaryotic diversity of arctic ice shelf microbial mats 951
© 2008 The Authors
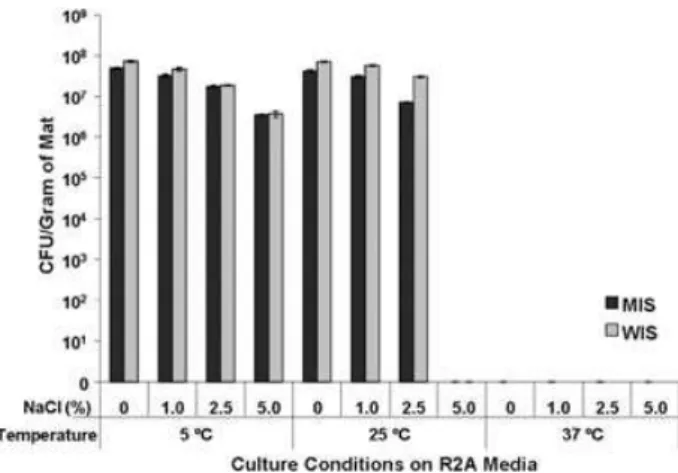
Heterotrophic plate counts on R2A inoculated in the field in 2005 revealed the presence of 6.3¥ 107 and 7.8¥ 107 colony-forming units (cfu) per gram of mat at Markham Ice Shelf and Ward Hunt Ice Shelf respectively. Heterotrophic plate counts prepared in the laboratory from samples collected in 2005 revealed similar trends in salt sensitivity and temperature sensitivity in the cultured com-munities from both ice shelves (Fig. 1). No growth was observed in samples plated on Subzero medium, regard-less of incubation temperature. Isolates obtained grouped into 34 phylotypes (defined as isolates sharing greater than 97% 16S rRNA gene sequence similarity). Of the phylotypes obtained, 8 were isolated solely from the Markham Ice Shelf samples, 13 were isolated from the Ward Hunt Ice Shelf samples and 12 were isolated from samples from both ice shelves. Phylogenetic groupings and observations of growth at various temperatures on R2A supplemented with various salt concentrations for the isolates are presented in Table 2.
Denaturing gradient gel electrophoresis (DGGE) analyses
Denaturing gradient gel electrophoresis (DGGE) analyses of bacterial 16S rRNA genes were performed to compare the microbial composition of the ice shelf microbial mats, and the DGGE banding patterns were used to construct dendrograms. DGGE analysis revealed many similarities in banding patterns between all of the mat samples analy-sed (Fig. 2). Although replicate samples collected from within the same ice shelf showed the highest degree of similarity to each other, the banding patterns of samples collected from the two different ice shelves were also similar. The DGGE profiles of the top and bottom layers of samples from each ice shelf also showed little variation.
Bacterial 16S rRNA gene clone libraries
Bacterial 16S rRNA gene clone libraries from both the Markham and Ward Hunt ice shelves were analysed in order to characterize the microbial biodiversity of the two ice shelves. Of the 189 clones analysed from the Markham library, 105 phylotypes were identified when grouping sequences with greater than 97% 16S rRNA gene sequence similarity. Of the 128 clones analysed from the Ward Hunt library, 52 phylotypes were identified. Statistical analyses of the two libraries revealed differ-ences in composition, species richness and diversity (Table 3). The two libraries were determined to have sig-nificantly different compositions (P< 0.05) by analysis with WEBLIBSHUFF; the differences in composition were supported by comparing the libraries by the Sorensen index (Sorensen index= 0.53). Common measures of community richness and diversity were used to compare aspects of the communities between the two ice shelves. Calculations of community richness by the Chao1 (Markham Chao1= 243.00; Ward Hunt Chao1 = 106.38) and ACE richness estimates (Markham ACE= 244.85; Ward Hunt ACE= 99.82) and community diversity by Shannon’s index of diversity (Markham H′ = 4.41; Ward Hunt H′ = 3.50) and the reciprocal of Simpson’s index of diversity (Markham 1/D= 95.52; Ward Hunt 1/D = 25.52) showed that the Markham Ice Shelf bacterial library had greater richness and diversity than that of the Ward Hunt Ice Shelf. Estimates of library coverage (Markham library coverage= 63.49%; Ward Hunt library coverage= 76.56%) and analysis of rarefaction curves (Fig. S1) also indicated higher diversity in the Markham library than the Ward Hunt library.
Fig. 1. Heterotrophic plate counts of microbial mat communities
from the Markham (MIS) and Ward Hunt (WIS) ice shelves. Culturing was performed on R2A agar supplemented with 0%, 1.0%, 2.5% and 5.0% w/v NaCl and incubated at 5°C, 25°C and 37°C. Error bars indicate standard error.
Fig. 2. Denaturing gradient gel electrophoresis (DGGE) analysis of
bacterial 16S rRNA genes amplified from samples from two sites on the Markham Ice Shelf (M1 and M2), two sites on the Ward Hunt Ice Shelf (W1 and W2), as well as the upper and lower halves of core samples from M1 and W1. DGGE was run on an 8% acrylamide gel with a gradient of urea and formamide from 35% to 65% (left to right). A similarity matrix based on band position was used to construct a neighbour joining tree for comparison of banding patterns between lanes using Quantity One imaging software version 4.2.1 (Bio-Rad Laboratories, Hercules, CA).
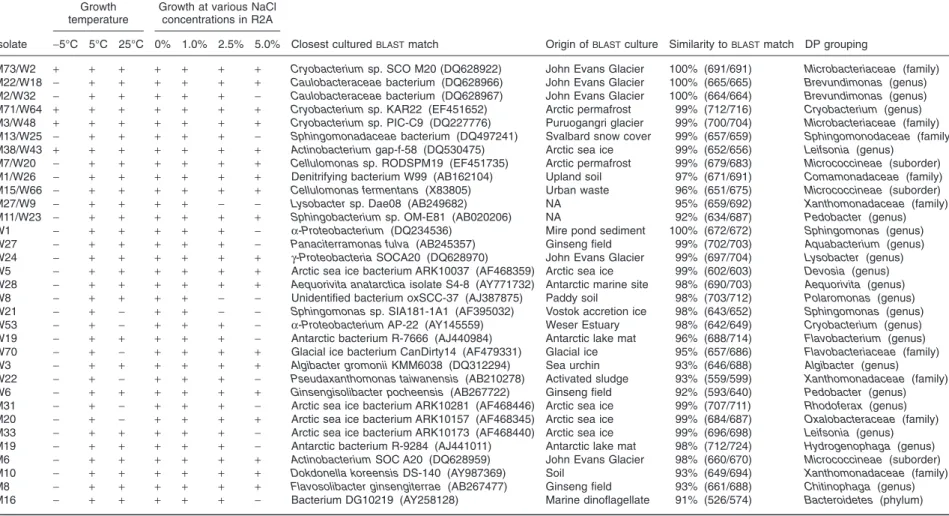
Table 2. Growth characteristics and 16S rRNA gene analyses of isolates obtained from samples from the Markham and Ward Hunt ice shelves.
Isolate
Growth temperature
Growth at various NaCl concentrations in R2A
Closest culturedBLASTmatch Origin ofBLASTculture Similarity toBLASTmatch DP grouping
-5°C 5°C 25°C 0% 1.0% 2.5% 5.0%
M73/W2 + + + + + + + Cryobacterium sp. SCO M20 (DQ628922) John Evans Glacier 100% (691/691) Microbacteriaceae (family)
M22/W18 - + + + + + + Caulobacteraceae bacterium (DQ628966) John Evans Glacier 100% (665/665) Brevundimonas (genus)
M2/W32 - + + + + + - Caulobacteraceae bacterium (DQ628967) John Evans Glacier 100% (664/664) Brevundimonas (genus)
M71/W64 + + + + + + + Cryobacterium sp. KAR22 (EF451652) Arctic permafrost 99% (712/716) Cryobacterium (genus)
M3/W48 + + + + + + + Cryobacterium sp. PIC-C9 (DQ227776) Puruogangri glacier 99% (700/704) Microbacteriaceae (family)
M13/W25 - + + + + + - Sphingomonadaceae bacterium (DQ497241) Svalbard snow cover 99% (657/659) Sphingomonodaceae (family)
M38/W43 + + + + + + + Actinobacterium gap-f-58 (DQ530475) Arctic sea ice 99% (652/656) Leifsonia (genus)
M7/W20 - + + + + + + Cellulomonas sp. RODSPM19 (EF451735) Arctic permafrost 99% (679/683) Micrococcineae (suborder)
M1/W26 - + + + + + + Denitrifying bacterium W99 (AB162104) Upland soil 97% (671/691) Comamonadaceae (family)
M15/W66 - + + + + + + Cellulomonas fermentans (X83805) Urban waste 96% (651/675) Micrococcineae (suborder)
M27/W9 - + + + + - - Lysobacter sp. Dae08 (AB249682) NA 95% (659/692) Xanthomonadaceae (family)
M11/W23 - + + + + + + Sphingobacterium sp. OM-E81 (AB020206) NA 92% (634/687) Pedobacter (genus)
W1 - + + + + + - a-Proteobacterium (DQ234536) Mire pond sediment 100% (672/672) Sphingomonas (genus)
W27 - + + + + + - Panaciterramonas fulva (AB245357) Ginseng field 99% (702/703) Aquabacterium (genus)
W24 - + + + + + + g-Proteobacteria SOCA20 (DQ628970) John Evans Glacier 99% (697/704) Lysobacter (genus)
W5 - + + + + + + Arctic sea ice bacterium ARK10037 (AF468359) Arctic sea ice 99% (602/603) Devosia (genus)
W28 - + + + + + + Aequorivita anatarctica isolate S4-8 (AY771732) Antarctic marine site 98% (690/703) Aequorivita (genus)
W8 - + + + + - - Unidentified bacterium oxSCC-37 (AJ387875) Paddy soil 98% (703/712) Polaromonas (genus)
W21 - + - + + - - Sphingomonas sp. SIA181-1A1 (AF395032) Vostok accretion ice 98% (643/652) Sphingomonas (genus)
W53 - + - + + + - a-Proteobacterium AP-22 (AY145559) Weser Estuary 98% (642/649) Cryobacterium (genus)
W19 - + + + + + - Antarctic bacterium R-7666 (AJ440984) Antarctic lake mat 96% (688/714) Flavobacterium (genus)
W70 - + - + + + + Glacial ice bacterium CanDirty14 (AF479331) Glacial ice 95% (657/686) Flavobacteriaceae (family)
W3 - + + + + + + Algibacter gromonii KMM6038 (DQ312294) Sea urchin 93% (646/688) Algibacter (genus)
W22 - + - + + + - Pseudaxanthomonas taiwanensis (AB210278) Activated sludge 93% (559/599) Xanthomonadaceae (family)
W6 - + + + + + + Ginsengisolibacter pocheensis (AB267722) Ginseng field 92% (593/640) Pedobacter (genus)
M31 - + - + + + - Arctic sea ice bacterium ARK10281 (AF468446) Arctic sea ice 99% (707/711) Rhodoferax (genus)
M20 - + - + + + + Arctic sea ice bacterium ARK10157 (AF468345) Arctic sea ice 99% (684/687) Oxalobacteraceae (family)
M33 - + + + + + - Arctic sea ice bacterium ARK10173 (AF468440) Arctic sea ice 99% (696/698) Leifsonia (genus)
M19 - + + + + + - Antarctic bacterium R-9284 (AJ441011) Antarctic lake mat 98% (712/724) Hydrogenophaga (genus)
M6 - + + + + + + Actinobacterium SOC A20 (DQ628959) John Evans Glacier 98% (660/670) Micrococcineae (suborder)
M10 - + + + + + + Dokdonella koreensis DS-140 (AY987369) Soil 93% (649/694) Xanthomonadaceae (family)
M8 - + + + + + + Flavosolibacter ginsengiterrae (AB267477) Ginseng field 93% (661/688) Chitinophaga (genus)
M16 - + + + + + - Bacterium DG10219 (AY258128) Marine dinoflagellate 91% (526/574) Bacteroidetes (phylum)
Cultured representatives from theBLASTanalysis whose isolation sources were not available in GenBank were marked NA.
Prokaryotic diversity of arctic ice shelf microbial mats 953 © 2008 The Authors Journal compilation © 2008 Society for Applied Microbiology and Blackwell Publishing Ltd, Environmental Microbiology , 10 , 950–966
Despite the apparent difference in diversity, there were some similarities in community structure between the two sites, with representatives of the same phyla found to dominate both libraries (Fig. 3). The Markham library was dominated by the three phyla Bacteroidetes, Actinobacte-ria and ProteobacteActinobacte-ria. Sequences grouping in the phyla Gemmatimonadetes, Firmicutes and Verrucomicrobia were also present in the library and represented less than 3% of the sequences in the library. Approximately 3% of the sequences in the library did not group well with any phylum. Members of the orders Sphingobacteriales and Flavobacteriales were found to comprise 71% and 9% of the Bacteroidetes phylum, respectively, while 20% of the sequences grouped in this phylum were unclassified. Approximately 94% of Actinobacteria sequences were of the subclass Actinobacteridae, and 6% of the sequences remained unclassified in the phylum. The phylum Proteobacteria had representatives of the classes g-Proteobacteria (15%), d-Proteobacteria (21%), b-Proteobacteria (38%) and a-Proteobacteria (23%). Approximately 86% of g-Proteobacteria sequences grouped within the order Xanthomonadales, and
sequences grouping in the order Pseudomonadales and unclassified g-Proteobacteria each made up 7% of the class. Approximately 86% ofb-Proteobacteria sequences were found to group in the order Burkholderiales, and 3% of sequences grouped in the order Hydrogenophilales and 11% of sequences remained ungrouped in this class. The classes d-Proteobacteria and a-Proteobacteria had representatives of multiple orders, with the d-Proteobacteria being comprised of sequences repre-sentative of the orders Desulfobacterales (50%), Desulfu-romonales (15%), Myxococcales (10%) and unclassified d-Proteobacteria (25%). The a-Proteobacteria were com-prised of sequences from the orders, Rhizobiales (36%), Rhodobacterales (27%), Sphingomonadales (23%), Rho-dospirillales (9%) and Caulobacterales (5%). A total of 4% of the sequences grouping within the phylum Proteobac-teria were unclassified within the phylum.
The Ward Hunt library was also found to be dominated by the phyla Bacteroidetes, Actinobacteria and Proteo-bacteria, with all sequences grouping within these phyla except for 2% of sequences that grouped in the phylum Fibrobacteres and 4% of sequences which did not group well with any phylum. Members of the order Sphingobac-teriales made up 78% of the Bacteroidetes phylum, with the other 22% of the phylum composed of unclassified Bacteroidetes sequences. Members of the subclass Acti-nobacteridae made up 95% of the Actinobacteria phylum, while sequences grouping in the Rubrobacteridae subclass and unclassified Actinobacteria each made up ~3% of the sequences in the phylum. Proteobacteria had representatives of the classes g-Proteobacteria (7%), d-Proteobacteria (9%), b-Proteobacteria (48%) and a-Proteobacteria (35%). All representatives of the g-Proteobacteria grouped within the order Xanthomonad-ales while~77% of b-Proteobacteria sequences grouped in the order Burkholderiales and the remaining 23% of sequences in this class represented unclassified
Table 3. Statistical analyses of bacterial 16S rRNA gene clone
librar-ies constructed from samples from the Markham (MIS) and Ward Hunt (WIS) ice shelves.
MIS WIS
Clones analysed 189 128
Operational taxonomic units 105 52
Library coverage (%) 63.49 76.56
Chao1 richness estimate 243.00 106.38
ACE richness estimate 244.85 99.82
Shannon’s diversity index (H′) 4.41 3.50 Simpson’s diversity index 1/D 95.52 25.52
Sorensen index 0.53
Grouping of operational taxonomic units and all statistical analyses were calculated based on groupings of sequences at 0.02% differ-ence inDOTUR.
Fig. 3. Phylogenetic groupings of sequences from 16S rRNA gene clone libraries constructed from samples from the Markham (left) and Ward
Hunt (right) ice shelves. The number of sequences in each phylum is represented as a percentage of the total 189 sequences analysed from the Markham library and 128 sequences analysed from the Ward Hunt library. Sequences were grouped using the RDP Classifier function of the Ribosomal Database Project-II release 9 with a confidence threshold of 80%.
b-Proteobacteria. The class d-Proteobacteria contained members of the two orders Desulfobacterales (80%) and Myxococcales (20%). The class a-Proteobacteria con-tained representatives of the orders Sphingomonadales (42%) Rhodobacterales (32%), Rhizobiales (21%) and Caulobacterales (5%).
Phylogenetic trees constructed to analyse groupings of sequences from the clone libraries and cultured represen-tatives obtained in this study indicated some similarities in community structure between the two ice shelves. Many sequences from the two different libraries clustered within the Proteobacteria (Fig. 4) with remaining sequences clustering with other phyla (Fig. 5). The phylogenetic trees also reflect diversity in the clone libraries that was not observed in the cultured communities from either site. Although all of the cultured representatives grouped within the major phyla covered by the bacterial clone libraries, there were many sequences found within the libraries that do not group closely with cultured represen-tatives of the communities. Conversely, 11/34 of the iso-lates recovered from the samples, shared greater than 99% sequence similarity with at least one clone found in the clone libraries. Comparison of sequences from both libraries to their closestBLASTmatch in the NCBI database revealed that many sequences were highly similar to pre-viously described sequences. For example, 66% of the sequences in the Markham library and 85% in the Ward Hunt library showed greater than 97% sequence identity with their closest BLAST match. Sequences that shared less than 95% sequence identity with their closest match in the NCBI database represent 19% of the Markham library and 5% of the Ward Hunt library.
Archaeal 16S rRNA gene clone libraries
Restriction fragment length polymorphism (RFLP) analy-sis of the archaeal 16S rRNA gene inserts from 41 clones from the Markham Ice Shelf library and 39 clones from the Ward Hunt Ice Shelf library revealed the dominance of a single phylotype. Four inserts of the 80 analysed were found to have RFLPs differing from the dominant pattern, and sequencing of these inserts revealed either very slight sequence divergence (< 1%) from the dominant sequence, or did not provide reliable sequence reads. A total of 31 reliable sequence reads, 27 from the Markham library and 4 from the Ward Hunt library, were obtained by sequence analysis of inserts. A single sequence differing from the other 30 sequences had a closest BLAST match to a bacterial 16S rRNA sequence. A pairwise alignment of the other 30 sequences revealed that these sequences shared a minimum of 99% sequence identity (571/576 bp) with one another. The dominant archaeal sequence shared 74% sequence identity with its closest NCBI BLASTN
match, a sulfidic surface water clone from white bioma-terial (clone HOEHK17, Accession No. AJ631250), when aligned over the entire 714 base pair insert sequence read. Despite this low overall sequence identity, there were regions of higher sequence similarity observed from base pairs 1–68, 102–439 and 567–713 which share 94%, 97% and 91% sequence identity with clone HOEHK17 respectively. Phylogenetic grouping of this sequence reveals it grouped within the Euryarchaeota, but distantly from other known sequences (Fig. 6).
Microbial mat activity at subzero temperatures
Mineralization of glucose was observed in Markham and Ward Hunt ice shelf mat samples at 5°C,-5°C and -10°C, showing that these communities are metabolically active at subzero temperatures (Fig. 7). Glucose respiration rates were extrapolated from the glucose mineralization curves from days 56 to 141 (85 days) when mineralization curves were most linear after the initial burst (Fig. 7). Glucose respiration rates (mg of glucose per day per gram of mat with standard error shown in brackets) were as follows for Markham Ice Shelf:-10°C, 0.024 (⫾0.002); -5°C, 0.050 (0.002); 5°C, 0.101 (⫾0.009); and for Ward Hunt Ice Shelf: -10°C, 0.020 (⫾0.004); -5°C, 0.019 (0.001); 5°C, 0.133 (⫾0.023). Background respiration rates in corresponding sterile controls were 0.001 for 5°C, 0.0008 for-5°C and 0.0005 for -10°C. Both the rates and levels of mineralization decreased with temperature. Levels of mineralization were~2.4-fold and 4.2-fold less at -5°C and -10°C, respectively, in comparison with miner-alization levels observed at 5°C. Minerminer-alization was observed to a greater extent in the Markham Ice Shelf microcosms compared with the Ward Hunt samples, perhaps reflective of the greater biomass observed in the Markham samples in 2006. Glucose mineralization in sterile controls remained less than 1% after 141 days of incubation.
Discussion
Cultured community characteristics
The microbial abundances of these communities were similar at each ice shelf and were similar to those reported in microbial mats from Antarctic lakes (Van Trappen et al., 2002). Culture-dependent analyses indicated that the het-erotrophic bacterial populations in the cultured communi-ties of the two ice shelves were primarily cold-adapted. Heterotrophic plate counts were similar at 5°C and 25°C and no growth was observed in plates incubated at 37°C. All isolates characterized grew at 5°C and 4/30 isolates were capable of growth at-5°C. The number of isolates capable of subzero growth is probably underestimated as Prokaryotic diversity of arctic ice shelf microbial mats 955
© 2008 The Authors
only 8/30 strains were capable of growth at 5°C on the subzero medium which appeared to contain an inhibitory combination of 5% NaCl and 5% glycerol. On the other hand, 19/30 strains tested were halotolerant to 5% salt but only four of these strains were capable of subzero growth indicating that halotolerance and subzero growth are not inclusive; many of these strains are most closely related to strains isolated from other cryo-environments (glaciers, sea ice, Antarctic soil). The adaptation to cold tempera-tures observed in the cultured communities from these ice shelves is not surprising given that air temperatures in this region drop to-50°C in the winter, and throughout all but a brief meltwater period the mats are encased in snow and ice. In situ thermal studies on these mats have shown that they remain below 0°C through most of the year (~300 days), experience an average annual mat tempera-ture of -8.6°C, drop to a minimum mat temperature of -17°C and rise to a maximum of only 1.7°C in late summer (Mueller et al., 2005). Many of the isolated strains are phylogenetically related to the genera Cellulomonas, Algi-bacter, Pseudoxanthomonas and Lysobacter that are often associated with plants and algae and are capable of metabolizing polysaccharides. These mat isolates are likely to have a similar role in utilizing organic carbon derived from the microbial phototrophs present in the mats. Although a general downward trend in plate counts was observed when mat samples were cultured on medium supplemented with higher concentrations of NaCl, the cultured community was moderately salt tolerant. In experiments conducted at 5°C, the highest counts were observed on R2A medium that was not supplemented with additional NaCl; however, counts on plates supple-mented with 5.0% NaCl were only decreased by one order of magnitude. Furthermore, 63% of the isolates tested were capable of growth on medium supplemented with 5.0% NaCl. Although the NaCl concentrations used to supplement the medium cover a relatively narrow range, medium containing 5% NaCl represented a 30 times greater concentration of Na+and Cl–than has been reported for the meltwater pools on the Markham Ice Shelf in the summer melt season (Vincent et al., 2004). The observation of a degree of halotolerance may be expected, as the mat communities must tolerate increased solute concentrations in the surrounding water as the meltwater ponds become frozen (Mueller et al., 2005). Automated in situ measurements in the water over-lying mats in a pond on the Ward Hunt Ice Shelf have
shown large increases in salinity during freeze-up, with conductivities rising from 5 to > 25 mS cm-1, and water temperatures dropping below 0°C (Mueller and Vincent, 2005). In an analogous pond in Antarctica, the salinity of remaining water above the mats rose to more than five times that of seawater during winter freeze-up, with a minimum observed water temperature of-13°C (Schmidt et al., 1991).
Arctic ice shelf microbial mat composition
The stratification found in some Antarctic mats of a highly pigmented aerobic surface layer overlying a black, anoxic layer (Vincent et al., 1993) was not apparent from our visual inspection of these communities, consistent with the relatively homogeneous, aerobic oxygen conditions that have been previously measured throughout these mat profiles (Mueller and Vincent, 2005). Our DGGE analyses of the upper and lower halves of core samples from each ice shelf suggested similar community compo-sitions between the two layers in the mats from both ice shelves, which implies habitat similarities between the portions of the mat analysed.
The homogeneity in vertical profile may be related to mat thickness. The Arctic mat samples analysed in this study were~2.2 cm in thickness, compared with thicker Antarctic McMurdo ice shelf mat communities (~8 cm thick) which are highly stratified (Mountfort et al., 1999) relative to the mats analysed here. It is also possible that variations in species distribution over a smaller scale were not observed because only the upper and lower halves of the mats were analysed and species in very thin layers may be present in too low a proportion to be discerned by DGGE analyses (Muyzer et al., 1993). The results show very little difference in community structure within the sampled areas of the same ice shelf, although more extensive survey data would be required to verify this. The DGGE analysis also showed little difference in community composition between samples from the two ice shelves, although in the banding pattern analyses the two replicate samples from each ice shelf grouped more closely with one another than they did samples from different ice shelves.
Phylogenetic analyses and biodiversity
Clone library analyses revealed that the mat communities from both the Markham and Ward Hunt ice shelves have
Fig. 4. Phylogenetic analysis of bacterial 16S rRNA gene sequences from clone libraries and cultured representatives of the Markham (MIS)
and Ward Hunt (WIS) grouping with the Proteobacteria. Sequences sharing>95% sequence identity to each other were grouped as a phylotype. Phylogenetic relationships were constructed by neighbour joining analysis of 430 positions of homologous sequence, and rooted to the outgroup Aquifex pyrophilus strain Kol5A (M83548). Bootstrap values above 50% are shown as a percentage of 1000 replicates. Sequences obtained in this study are in bold type, and parentheses denote the site from which each isolate was obtained for cultured representatives and the percentage in which each sequence was found in each clone library for cloned representatives. The scale represents the number of mutations per nucleotide position.
Prokaryotic diversity of arctic ice shelf microbial mats 957
© 2008 The Authors
diverse bacterial populations, with statistical analyses suggesting that the diversity at the Markham Ice Shelf exceeds that of the Ward Hunt Ice Shelf. The diversity of the two ice shelves (H′ = 3.5, 4.4) was higher in compari-son with bacterial diversity examined in other polar regions, including cold saline springs in the Canadian
Arctic (H′ = 2.2–3.2) (Perreault et al., 2007), high Arctic permafrost (H′ = 1.8–3.6) (B. Steven and L.G. Whyte, unpubl. data), Antarctic mineral soils (H′ = 1.2–1.6) (Smith et al., 2006), and Arctic and Antarctic sea ice (H′ = 0.8–1.3) (Brinkmeyer et al., 2003). The relatively complex DGGE banding patterns of the Arctic microbial
Fig. 5. Phylogenetic analysis of bacterial 16S rRNA gene sequences from clone libraries and cultured representatives of the Markham (MIS)
and Ward Hunt (WIS) not grouping with the Proteobacteria. Sequences sharing> 95% sequence identity to each other were grouped as a phylotype. Sequences were either unclassified (X) or grouped within the phyla Gemmatimonadetes (G), Verrucomicrobia (V), Fibrobacteres (F), Bacteroidetes (B), Firmicutes (M) or Actinobacteria (A). Phylogenetic relationships were constructed by neighbour joining analysis of 414 positions of homologous sequence, and rooted to the outgroup Aquifex pyrophilus strain Kol5A (M83548). Bootstrap values above 50% are shown as a percentage of 1000 replicates. Sequences obtained in this study are in bold type, and parentheses denote the site from which each isolate was obtained for cultured representatives and the percentage in which each sequence was found in each clone library for cloned representatives. The scale represents the number of mutations per nucleotide position.
Fig. 6. Phylogenetic grouping of an archaeal 16S rRNA gene sequence obtained from clone libraries of the Markham and Ward Hunt ice
shelves analysed in this study. A single archaeal clone sequence, identified by bold type, was found in analysis of the two libraries, and this sequence was found to be common to both libraries. Phylogenetic relationships were constructed by neighbour joining analysis of 680 positions of homologous sequence, and rooted to the outgroup Aquifex pyrophilus strain Kol5A (M83548). Bootstrap values above 50% are shown as a percentage of 1000 replicates. The scale represents the number of mutations per nucleotide position.
Prokaryotic diversity of arctic ice shelf microbial mats 959
© 2008 The Authors
mats also indicate a greater diversity than we have observed in other high Arctic samples including cold saline springs (Perreault et al., 2007) and permafrost/ ground ice (B. Steven and L.G. Whyte, unpubl. data). The higher diversity observed in the Markham library com-pared with the Ward Hunt library was not unexpected, as macroscopically, the mat communities of the Markham Ice Shelf appear to be more extensive and highly developed than those found on the Ward Hunt Ice Shelf (Vincent et al., 2004).
Despite the apparent differences in the two communi-ties at the species level, as indicated by the statistical analyses of the clone libraries, the sequences of both bacterial clone libraries and the sequences from all iso-lates were found to group predominantly within three phyla: Proteobacteria, Bacteroidetes and Actinobacteria. Although the abundances in which individual sequences are observed in clone library analyses do not necessarily reflect their abundances in an environmental sample (Achenbach and Coates, 2000), the finding that the domi-nant sequences in the clone libraries grouped within the same three phyla that were uncovered in the cultured communities suggests the importance of the members of these phyla to the mat ecosystems. Members of these three phyla also represent a substantial proportion of the phyla detected in diversity studies of microbial mats present in Antarctic lakes (Brambilla et al., 2001; Van Trappen et al., 2002). The presence of similar phyla in both the Markham Ice Shelf and Ward Hunt Ice Shelf communities was expected, as these two systems appear to face many of the same environmental conditions and selective pressures. Furthermore, the similar surrounding habitats may act as a source of inoculation of the two ice shelves, due to the close proximity of these two ice shelves to one another.
The closest cultured BLAST matches to many of the isolates recovered in this study were bacteria first
char-acterized from other cold temperature ecosystems, including sea ice, glaciers, snow cover and Antarctic microbial mats. While many of the isolates from these mats showed high sequence identity to previously cul-tured bacteria, ~33% of the isolates showed less than 97% sequence identity to their closest cultured BLAST
match indicating that a considerable proportion of the bacteria isolated may represent novel species.
In contrast to theBLASTmatches of isolates recovered in this study, few common trends were noticed in the envi-ronmental origins of the closest BLAST matches in the NCBI database for sequences obtained in analyses of either bacterial clone library. Environmental origins of
BLAST matches sharing greater than 97% identity with sequences in the clone libraries included marine and freshwater environments, polar sea ice, agricultural soils, legume nodules and uranium mining waste. Interestingly, there was nearly equal representation of the a- and b-Proteobacteria within both libraries. a-Proteobacteria are of widespread occurrence in the marine plankton, including within Arctic communities, while b-Proteo-bacteria are generally more important in freshwater envi-ronments (Garneau et al., 2005). The marine influence of the basal sea ice in these meltwater pools was previously noted (Vincent et al., 2004), and the distribution of these two proteobacterial classes in the bacterial clone libraries further underscores the unique nature of these ecosystems.
While many of the sequences in the two bacterial librar-ies grouped closely to previously reported sequences, most did not group to previously characterized cultured bacteria. As such, it is difficult to infer the characteristics or metabolic activity of the bacteria represented in the clone libraries. With this in mind, the phyla observed in this study could provide a number of metabolic activities important to the mat communities as a whole. The Pro-teobacteria represented may be responsible for a diverse
Fig. 7. Metabolic activity of microbial mat
communities from the Markham (MIS) and Ward Hunt (WIS) ice shelves. Abiotic control (Cont) and experimental replicate (Rep) microcosms (5 g of mat material) supplemented with 14-C-labelled glucose were incubated at 5°C,-5°C and -10°C. The amount of radioactive CO2recovered in a 1 M
KOH trap was recorded as a percentage of the total activity initially added to the microcosm. Each point represents the mean cumulative mineralization from triplicate mat microcosms with the error bars representing standard deviation of the mean.
suite of aerobic and anaerobic metabolic activities (Madigan et al., 2000). Of particular interest to sulfur cycling processes in these microbial systems is the pres-ence of d-Proteobacteria sequences, found to group within the orders Desulfobacterales in both libraries and Desulfuromonales in the Markham Ice Shelf library; these are orders characterized by members of sulfate-reducing or sulfur-reducing bacteria (SRBs) (Madigan et al., 2000). The presence of SRBs in the Arctic mats would be consistent with the high sulfate concentrations (177–169 mg l-1) previously reported in the pond water overlaying the mats (Mueller et al., 2005), although we detected no strong smell of H2S during sampling.
That no cyanobacterial sequences were detected in the clone libraries was surprising, considering that cyanobacteria are reported to dominate the algal com-munities in mats from the Markham Ice Shelf (Vincent et al., 2004), as in many other polar habitats (Vincent, 2007). The lack of cyanobacterial sequences in the bac-terial clone libraries and the similar DGGE patterns observed between the two layers may be explained by primer bias as it is well documented that cyanobacterial 16S rRNA genes are not efficiently amplified by domain-specific polymerase chain reaction (PCR) primers (Taton et al., 2003; Waleron et al., 2006). It is also possible that the proportion of cyanobacterial cells in these systems represents a small proportion of the total prokaryotic community. For example, 62–73% of the cyanobacteria/ algal phototrophs in Markham Ice Shelf mats exist in the top 100–500mm of the mats that can be several centimetres in total depth (Vincent et al., 2004). Much of the rest of the mat may be composed of decaying phototroph-derived organic matter (including fluorescing degradation pigments), and the associated bacterial communities responsible for its decomposition.
An interesting finding of this study was the apparent lack of archaeal diversity, and a novel archaeal phylotype in these two mat ecosystems. Archaea can be abundant and diverse in cold ecosystems, where they play an important role in biogeochemical cycling (DeLong et al., 2002; Cavicchioli, 2006; Steven et al., 2006; Perreault et al., 2007). However, microbial mats in Lake Fryxell in Antarctica also showed low archaeal diversity, with only two archaeal phylotypes detected in analyses of archaeal 16S rRNA gene clone libraries: one being distantly related to the methanogen Methanoculleus palmolei and the other sequence closely related to an Antarctic clone sequence (Brambilla et al., 2001). The archaeal sequence uncovered in this study does not group closely with any other reported archaeal sequences and groups very distantly from any cultured archaea, and it will be of great interest in the future to determine the biogeochemical role of the species repre-sented by this sequence.
Microbial mat activity at subzero temperatures
The detection of metabolic activity at subzero tempera-tures in these microbial mats augments recent reports of similar activity from a number of other cryo-ecosystems (e.g. Carpenter et al., 2000; Bakermans et al., 2003; Junge et al., 2004) and is also consistent with the obser-vation that a number of isolates obtained in this study were capable of growth at -5°C. The subzero activity potential demonstrated in the microcosm analyses sug-gests that these communities are metabolically active during both the summer melt season and during the ~10 months of the year when the ambient temperatures are< 0°C.
In summary, this work underscores the importance of the Canadian High Arctic ice shelves as rich sites of polar microbial diversity. These ecosystems are vulnerable to the ongoing effects of global warming, but may have served as refugia and sites of microbial growth and evolution during periods of extensive ice cover, such as glaciations during the Proterozoic. The genetic diversity discovered in the present study suggests that such com-munities may also provide an inoculum of taxonomically and functionally diverse microbiota to colonize other habi-tats during warmer periods.
Experimental procedures
Study sites and sampling
Microbial mat samples were collected aseptically from the Ward Hunt Ice Shelf and Markham Ice Shelf during two field seasons in August 2005 and June 2006. In 2005, mat samples and core samples were collected from two indepen-dent meltwater pools on the Ward Hunt Ice Shelf (83°04. 93′N, 74°25.70′W) and two sites within the same meltwater pool on the Markham Ice Shelf (83°01.90′N, 71°27.15′W and 83°01.93′N, 71°29.72′W). In 2006, frozen mat samples were collected from beneath the snow at approximately the same locations as were sampled in 2005 on both the Ward Hunt Ice Shelf (83°04.87′N, 74°25.84′W) and the Markham Ice Shelf (83°01.92′N, 71°29.27′W). In both seasons, mat samples were placed on ice immediately after collection and trans-ported to the Ward Hunt Island field camp. Samples were maintained on ice from the time of sampling for up to 9 days before being frozen at -20°C and maintained frozen until further analyses. In 2005, temperature, pH and conductivity measurements were recorded for the meltwater pools from which the samples were collected using an Oakton pH/CON 10 multiparameter meter equipped with a multisensor probe (Oakton Instruments, Vernon Hills, IL).
Microscopy
Direct microscopic counts were performed on 2005 and 2006 samples collected from both ice shelves after being stained with the LIVE/DEAD BacLight Bacterial Viability Kit
(Invitro-Prokaryotic diversity of arctic ice shelf microbial mats 961
© 2008 The Authors
gen Corporation, Carlsbad, CA). Mat samples 2.0–5.0 g were transferred to 20 ml dilution tubes containing 2.5 g of sterile 3-mm-diameter glass beads (Fisher Scientific, Waltham, MA) and three times the sample weight of cold, sterile, dilution buffer [0.1% w/v Na4P2O710H2O (pH 7.0 ⫾ 0.2)]. Samples were vortexed at maximum speed for 2 min and subse-quently used to prepare serial dilutions used for microscopic analyses. An aliquot of 0.5 ml of each diluted sample was stained for 15 min, as described by the manufacturer, and filtered through 25-mm-diameter, 0.2-mm-poresize, black polycarbonate membrane filters (Poretics, Livermore, CA), backed with 25-mm-diameter, 0.2-mm-poresize, white poly-carbonate membrane filters (Poretics, Livermore, CA). Filters were dried, mounted on glass microscope slides with one drop of BacLight mounting oil and covered with a glass coverslip. Filters were viewed using a Nikon Eclipse E600 microscope, equipped with a super high-pressure mercury lamp at 1000¥ magnification through a Texas Red filter. Cells were counted in a minimum of 10 fields of view for each sample and results are reported as mean counts with stan-dard errors calculated from counts of individual samples.
Bacterial cultivation and characterization
Heterotrophic plate counts were prepared in the field in 2005 within 12 h of sample collection by spread plating 100ml aliquots of 10-3, 10-4and 10-5serial dilutions of samples on R2A agar (Becton, Dickson and Company, Sparks, MD) Plates were incubated at ambient temperatures (~5–10°C) for up to 10 days before incubation at 5°C for 2 months upon return to Montreal, Canada. Heterotrophic plate counts were prepared in the laboratory from the same samples on R2A agar plates supplemented with 0%, 1.0%, 2.5% or 5.0% w/v NaCl and incubated at 5°C, 25°C and 37°C. Subzero medium (R2A agar supplemented with 50 g l-1NaCl and 50 ml l-1 glyc-erol) was also spread plated and incubated at-10°C, -5°C and 5°C. All plating was performed in triplicate or quadrupli-cate and results are reported as mean counts with standard error. Colonies with different macroscopic morphologies were isolated from plates prepared in the field and the laboratory from each ice shelf after 2 months of incubation at 5°C. Colonies were streaked for isolation on fresh medium of the same type from which they were isolated and incubated at 5°C. Isolates were re-streaked a minimum of two times before being subcultured with sterile toothpicks on to medium to determine salt and temperature tolerances and before genetic analyses of isolates were performed. DNA was extracted from isolates by boiling lysis (Sambrooke and Russell, 2001) or using the DNeasy Tissue Kit (Qiagen, Mis-sissauga, ON) according to the manufacturer’s method for purification of genomic DNA from Gram-positive bacteria.
Community DNA extractions and 16S rRNA gene amplification
All community DNA extractions were completed using the UltraClean Soil DNA Isolation Kit (MO BIO Laboratories, Solana Beach, CA), as described in the alternative protocol of the manufacturer’s instructions. Total community DNA extrac-tions were completed within 12 h of sample collection at the
Ward Hunt Island field camp. Extractions from layers of core samples were completed in the laboratory in Montreal, Canada. The cores from the Markham and Ward Hunt ice shelves were each 2.2 cm in length and were split equally into 1.1 cm top and bottom halves using a sterile hot razor to cut through the frozen mat material. All community DNA extractions were purified using polyvinylpolypyrrolidone (PVPP) columns as previously described (Berthelet et al., 1996).
Bacterial isolate 16S rRNA genes were amplified by PCR using the primer pair 27F (AGA GTT TGA TCC TGG CTC AG) (Lane, 1991) and 758R (CTA CCA GGG TAT CTA ATC C) (Woese, 1987; Lee et al., 1993): thermocycling conditions consisted of 3 min at 95°C; 30 cycles of 1 min at 94°C, 1 min at 55°C and 1 min at 72°C; and a final extension of 7 min at 72°C. The primer pair 341F (CCT ACG GGA GGC AGC AG) (Muyzer et al., 1996) with a 5′-GC clamp (GCG GGC GGG GCG GGG GCA CGC GGG GCG CGG CGG GCG) and 758R was used for amplification of bacterial 16S rRNA genes for DGGE analyses: thermocycling conditions consisted of 5 min at 96°C, followed by 10 touchdown cycles (68–59°C), and a further 15 cycles at 59°C for 45 s, followed by 72°C for 1 min 30 s and a final extension of 5 min at 72°C. The primer pair 341F and 758R was also used for amplification of bac-terial 16S rRNA genes for clone library production: thermocy-cling conditions consisted of 5 min at 96°C, followed by 15 touchdown cycles (65–59°C), and a further 15 cycles at 59°C for 30 s, followed by 72°C for 1 min 30 s, and a final exten-sion of 5 min at 72°C. Archaeal 16S rRNA genes were ampli-fied using the primers 109F (ACK GCT CAG TAA CAC GT) (Whitehead and Cotta, 1999) and 915R (GTG CTC CCC CGC CAA TTC CT) (DasSarma and Fleischmann, 1995): thermocycling conditions consisted of 5 min at 94°C; 20 touchdown cycles (62–52°C), and a further 15 cycles at 52°C for 30 s, followed by 72°C for 1 min 30 s; and a final exten-sion of 5 min at 72°C.
Polymerase chain reaction reagents and their final concen-trations in a 50ml reaction mixture were as follows: 1.5 U of
Taq polymerase (Invitrogen Canada, Burlington ON), 1¥ PCR buffer, 3.5 mM MgCl2 (both supplied with the Taq poly-merase), 0.2 mM of each deoxynucleotide triphosphate, 1mM of each primer and 5 ml of DNA extract. All PCR mix-tures for the amplification of community DNA were prepared as stated, but additionally contained 12.5mg of BSA.
DGGE analyses
Denaturing gradient gel electrophoresis was used to compare the bacterial communities present between the two ice shelves, between different samples collected from within the same ice shelf, and between different layers in the vertical profile of individual mat samples. DGGE was performed using a DCode Universal Mutation Detection System as described in the manufacturer’s instructions (Bio-Rad Labo-ratories, Hercules, CA). An 8% acrylamide gel with a gradient of urea and formamide from 35% to 65% was prepared and each lane was loaded with approximately 800 ng of PCR product. Samples were run for 16 h at 80 V in 1¥ TAE buffer at 60°C. Gels were stained for 30 min in a solution of 0.01% v/v Vistra Green (Amersham Biosciences, Fairfield, CT) pre-pared in 1¥ TAE buffer, and destained for 30 min in 1¥ TAE
buffer. Gels were viewed on a Bio-Rad Molecular Imager FX equipped with an External Laser Imager FX (Bio-Rad Labo-ratories, Hercules, CA). DGGE runs were completed in rep-licate to ensure reproducibility of results. DGGE results were analysed using Quantity One imaging software version 4.2.1 (Bio-Rad Laboratories, Hercules, CA) to compare banding patterns between samples. Bands in each lane were com-pared based on position and a neighbour joining distance-based tree was constructed.
16S rRNA gene clone library construction
Total community DNA from total mat samples collected in 2005 from the Markham and Ward Hunt ice shelves were used for clone library construction. A total of four clone librar-ies were produced to analyse the bacterial and archaeal communities at the two ice shelves. Polymerase chain reaction-amplified community 16S rRNA gene fragments of ~417 bp for bacterial libraries and ~806 bp for archaeal librar-ies were cloned into the pGEM-T Easy Vector System I using the manufacturer’s instructions (Promega Corporation, Madison, WI) and transformed into Escherichia coli strain DH5a by a standard protocol (Sambrooke and Russell, 2001). Clones of interest were selected by blue/white screen-ing on LB/amp plates spread with 100ml of 40 mM isopropyl-b-D-thiogalactopyranoside (IPTG) and 100ml of 2% w/v 5-bromo-4-chloro-3-indolyl-b-D-galactopyranoside (X-Gal) prepared in N,N-dimethyl formamide 30 min prior to inoculation. DNA was extracted from clones by boiling lysis (Sambrooke and Russell, 2001) and cloned inserts were amplified from the pGEM-T Easy vector by PCR using the pGEM-T-targeted primers T7 and SP6 (Promega Corpora-tion, Madison, WI). The PCR reaction mixtures were pre-pared with reagent concentrations as described above. Thermocycling conditions consisted of 5 min at 95°C; 30 cycles of 45 s at 94°C, 30 s at 57°C and 1 min at 72°C; and a final extension of 5 min at 72°C. RFLP analyses, essentially as described by Steven and colleagues (2007a), were used to group clones within individual clone libraries and to group isolates with similar morphologies. Sequences with identical RFLP patterns were grouped together as similar sequences and representatives of each group were chosen for sequence analyses. For clone libraries that showed high diversity in RFLP results, the DNA from each clone was sequenced. All sequencing was undertaken by Genome Quebec, based at McGill University, Montreal, Quebec.
Nucleotide accession numbers
These sequence data have been submitted to the GenBank database under Accession No. EU044919–EU045213.
Phylogenetic and statistical analyses
16S rRNA sequences of clones and isolates were compared with known sequences in the NCBI database using the
BLASTNalgorithm (Altscul et al., 1990) and grouped for phy-logenetic analyses using the RDP Classifier function of the Ribosomal Database Project-II release 9 with a confidence threshold of 80% (Cole et al., 2005). Potential chimeras
iden-tified at 99.9% in Mallard version 1.02 (Ashelford et al., 2006) were analysed in Pintail version 1.1 (Ashelford et al., 2005), and those identified as chimeras were deleted from the clone libraries. Distance matrices of clone sequences were con-structed fromCLUSTALWalignments using the DNADIST func-tion, with the Jukes Cantor correcfunc-tion, in thePHYLIPprogram version 3.65 (Felsenstein, 2005).CLUSTALWalignments com-pared 430 bp of homologous sequence in analyses of bac-terial sequences grouping most closely with the phylum
Proteobacteria, 414 bp of homologous sequence in analyses
of bacterial sequences not grouping within the phylum
Pro-teobacteria, and 680 bp of homologous sequence in
analy-ses of archaeal sequences. Distance matrices were used in order to complete clone library analyses in the programs
DOTUR (Schloss and Handelsman, 2005) and WEBLIBSHUFF
version 0.96 (Singleton et al., 2001).WEBLIBSHUFFwas used to compare the two libraries, in order to determine if their compositions were statistically different from one another. TheDOTURoutput files were used as a basis for comparisons of richness, diversity and library composition, as well as to assess library coverage. Two indices were used to measure phylotype richness, the Chao1 richness estimator (Chao, 1984) and the ACE richness estimator (Chao et al., 1993), and two indices were used to measure species diversity, the Shannon’s diversity index (H′) (Shannon and Weaver, 1949) and the reciprocal of the Simpson’s diversity index (1/D) (Simpson, 1949), which were calculated directly by theDOTUR
program for both bacterial libraries. Phylotype composition in each of the libraries was calculated by the Sorenson index (Magurran, 1988) and library coverage was calculated according to Good (1953). Phylogenetic trees were con-structed from theCLUSTALWalignments of clone and isolate 16S rRNA gene sequences in the programMACVECTOR7.0. Neighbour joining best trees were constructed using the Jukes Cantor correction and the reliability of the tree branch points was assessed by bootstrap analysis of 1000 replicates.
Microbial mat community activity at subzero temperatures
Microbial activity at 5°C and subzero temperatures was detected and quantified by measuring14CO
2evolved during mineralization of [2-14C] glucose in microbial mat microcosms employing a specialized 14CO
2 trap solution that would not freeze, maintained sufficient CO2trapping efficiency and did not interfere with liquid scintillation counting at subzero tem-peratures (Steven et al., 2007b). Mat samples collected in spring 2006 from the Markham and Ward Hunt ice shelves were used to perform these analyses essentially as described (Steven et al., 2007b). All microcosms were pre-pared in triplicate by aseptically dispensing 5.0 g of mat material into sterile 30 ml serum bottles on ice. A 20ml aliquot of14C-labelled glucose solution (Dupont, Boston, MA), con-taining 0.5 mg of glucose and with an activity of 115 940 disintegrations per minute (dpm), was dispensed into each microcosm with a Hamilton syringe, yielding a final glucose concentration of 0.1 mg per gram of mat in each microcosm. Microcosms were sealed, vortexed briefly and immediately placed at their final incubation temperature for 1 h. Micro-cosms were then briefly removed from their incubators on ice,
Prokaryotic diversity of arctic ice shelf microbial mats 963
© 2008 The Authors
and a sterile 8 mm¥ 40 mm culture tube (Fisher Scientific, Waltham, MA) containing 0.5 ml of trap solution (1 M KOH and 20% ethylene glycol) was aseptically placed inside the serum bottle. Microcosms were resealed and incubated at 5°C,-5°C or -10°C without shaking in Fisherbrand Isotemp Refrigerated Incubators (Fisher Scientific). Sterile negative control microcosms were prepared in triplicate by the same methods used for preparation of the experimental micro-cosms; however, prior to the addition of the radioactive glucose, the serum bottles containing sample were auto-claved twice, 24 h apart, at 121°C and 15 pounds per square inch (103 kPa) for 30 min. The amount of radioactivity trapped in the microcosms over a 12-week period was deter-mined by liquid scintillation spectrometry using a LS 6500 multipurpose scintillation counter and supplied software (Beckman Coulter, Fullerton, CA) (Steven et al., 2007b). All manipulations of the microcosms were performed on ice to maintain subzero temperatures and the microcosms were outside of the incubator for less than 5 min; thawing of the samples during14CO
2sampling was never observed.
Acknowledgements
This research was funded by the Natural Sciences and Engineering Research Council of Canada (NSERC), the Canadian Foundation for Innovation, the Canada Research Chair Program, the Network of Centres of Excellence programme ArcticNet and the Department of Indian and Northern Affairs – Northern Scientific Training Program. Logistic support was provided by the Canadian Polar Conti-nental Shelf Project. We thank Anne Jungblut for her com-ments on the manuscript.
References
Achenbach, L.A., and Coates, A.J. (2000) Disparity between bacterial phylogeny and physiology. ASM News 66: 714– 715.
Altscul, S., Gish, W., Miller, W., Myers, E.W., and Lipman, D.J. (1990) Basic local alignment search tool. J Mol Biol 215: 403–410.
Ashelford, K.E., Chuzhanova, N.A., Fry, J.C., Jones, A.J., and Weightman, A.J. (2005) At least 1 in 20, 16S rRNA sequence records currently held in public repositories is estimated to contain substantial anomalies. Appl Environ
Microbiol 71: 7724–7736.
Ashelford, K.E., Chuzhanova, N.A., Fry, J.C., Jones, A.J., and Weightman, A.J. (2006) New screening software shows that most recent large 16S rRNA gene clone librar-ies contain chimeras. Appl Environ Microbiol 72: 5734– 5741.
Bakermans, C., Tsapin, A.I., Souza-Egipsy, V., Gilichinsky, D.A., and Nealson, K.H. (2003) Reproduction and metabo-lism at-10 degrees C of bacteria isolated from Siberian permafrost. Environ Microbiol 5: 321–326.
Berthelet, M., Whyte, L.G., and Greer, C.W. (1996) Rapid, direct extraction of DNA from soils for PCR analysis using polyvinylpolypyrrolidone spin columns. FEMS Microbiol
Lett 138: 17–22.
Brambilla, E., Hippe, H., Hagelstein, A., Tindall, B.J., and
Stackebrandt, E. (2001) 16S rDNA diversity of cultured and uncultured prokaryotes of a mat sample from Lake Fryxell, McMurdo Dry Valleys, Antarctica. Extremophiles 5: 23–33. Brinkmeyer, R., Knittel, K., Jurgens, J., Weyland, H., Amann, R., and Helmke, E. (2003) Diversity and structure of bacterial communities in Arctic versus Antarctic pack ice.
Appl Environ Microbiol 69: 6610–6619.
Brown, M.V., and Bowman, J.P. (2001) A molecular phyloge-netic survey of sea-ice microbial communities (SIMCO).
FEMS Microbiol Ecol 35: 267–275.
Carpenter, E.J., Lin, S., and Capone, D.G. (2000) Bacterial activity in South Pole snow. Appl Environ Microbiol 66: 4514–4517.
Cavicchioli, R. (2006) Cold-adapted archaea. Nat Rev
Micro-biol 4: 331–343.
Chao, A. (1984) Non-parametric estimation of the number of classes in a population. Scand J Stat 11: 265–270. Chao, A., Ma, M.C., and Yang, M.C.K. (1993) Stopping rules
and estimation for recapture debugging with unequal failure rates. Biometrika 80: 193–201.
Christner, B.C., Kvitko, B.H., 2nd, and Reeve, J.N. (2003) Molecular identification of bacteria and Eukarya inhabiting an Antarctic cryoconite hole. Extremophiles 7: 177–183. Cole, J.R., Chai, B., Farris, R.J., Wang, Q., Kulam, S.A.,
McGarrell, D.M., et al. (2005) The Ribosomal Database Project (RDP-II): sequences and tools for high-throughput rRNA analysis. Nucleic Acids Res 33: D294–D296. DasSarma, S., and Fleischmann, E.F. (1995) Archaea: A
Laboratory Manual – Halophiles. Cold Spring Harbor, NY,
USA: Cold Spring Harbor Laboratory Press.
DeLong, E.F., Wu, K.Y., Prezelin, B.B., and Jovine, R.V.M. (2002) High abundance of Archaea in Antarctic marine picoplankton. Nature 371: 695–697.
Deming, J.W. (2002) Psychrophiles and polar regions. Curr
Opin Microbiol 5: 301–309.
Felsenstein, J. (2005) PHYLIP (Phylogeny Inference Package), Version 3.65. Seattle, WA, USA: Department of
Genome Sciences, University of Washington.
Garneau, M.-E., Vincent, W.F., Alonso-Saez, L., Gratton, Y., and Lovejoy, C. (2005) Prokaryotic community structure and heterotrophic production in a river-influenced coastal arctic ecosystem. Aquat Microb Ecol 42: 27–40.
Gerday, C., Aittaleb, M., Bentahir, M., Chessa, J., Claverie, P., Collins, T., et al. (2000) Cold-adapted enzymes: from fundamentals to biotechnology. Tibtech 18: 103–107. Good, I. (1953) The population frequencies of species and
the estimation of population parameters. Biometrika 40: 237–264.
Jakosky, B.M., Nealson, K.H., Bakermans, C., Ley, R.E., and Mellon, M.T. (2003) Subfreezing activity of microorganisms and the potential habitability of Mars’ polar regions.
Astrobiology 3: 343–350.
Jungblut, A.D., Hawes, I., Mountfort, D., Hitzfeld, B., Dietrich, D.R., Burns, B.P., and Neilan, B.A. (2005) Diversity within cyanobacterial mat communities in variable salinity melt-water ponds of McMurdo Ice Shelf, Antarctica. Environ
Microbiol 7: 519–529.
Junge, K., Eicken, H., and Deming, J.W. (2004) Bacterial activity at-2 to -20 degrees C in Arctic wintertime sea ice.
Appl Environ Microbiol 70: 550–557.
Kivelson, M.G., Khurana, K.K., Russell, C.T., Volwerk, M.,