Publisher’s version / Version de l'éditeur:
Technical Report, 2013-04-04
READ THESE TERMS AND CONDITIONS CAREFULLY BEFORE USING THIS WEBSITE.
https://nrc-publications.canada.ca/eng/copyright
Vous avez des questions? Nous pouvons vous aider. Pour communiquer directement avec un auteur, consultez la première page de la revue dans laquelle son article a été publié afin de trouver ses coordonnées. Si vous n’arrivez pas à les repérer, communiquez avec nous à [email protected].
Questions? Contact the NRC Publications Archive team at
[email protected]. If you wish to email the authors directly, please see the first page of the publication for their contact information.
NRC Publications Archive
Archives des publications du CNRC
For the publisher’s version, please access the DOI link below./ Pour consulter la version de l’éditeur, utilisez le lien DOI ci-dessous.
https://doi.org/10.4224/21270314
Access and use of this website and the material on it are subject to the Terms and Conditions set forth at
Blade Runners concept preliminary test program results
Gagnon, R.
https://publications-cnrc.canada.ca/fra/droits
L’accès à ce site Web et l’utilisation de son contenu sont assujettis aux conditions présentées dans le site LISEZ CES CONDITIONS ATTENTIVEMENT AVANT D’UTILISER CE SITE WEB.
NRC Publications Record / Notice d'Archives des publications de CNRC:
https://nrc-publications.canada.ca/eng/view/object/?id=3b9c5da9-f776-4376-9071-b8b5b906de87 https://publications-cnrc.canada.ca/fra/voir/objet/?id=3b9c5da9-f776-4376-9071-b8b5b906de87
Page 1 of 20
NATIONAL RESEARCH COUNCIL CANADA OCEAN, COASTAL AND RIVER ENGINEERING
Blade Runners Concept Preliminary Test
Program Results
Technical Report - Unclassified
OCRE-TR-2013-038
R. Gagnon
National Research Council Conseil national de recherches Canada Canada Ocean, Coastal and River Génie océanique, côtier et fluvial Engineering
Blade Runners Concept Preliminary Test Program Results
Technical Report
UNCLASSIFIED
OCRE-TR-2013-038
R. Gagnon
Blade Runners Concept Preliminary Test Program Results
R. Gagnon, April 4, 2013
Test Program Description and Results
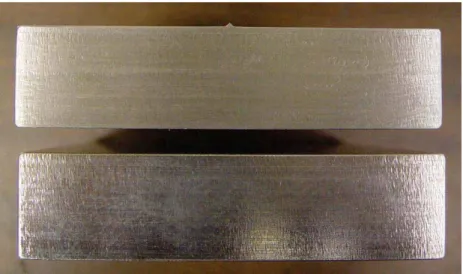
To test the Blade Runners concept a simple stationary configuration of a single blade on a flat metal plate was chosen for ice crushing tests in NRC/OCRE’s Cold Room facility. The idea was to crush five samples of ice against a plate with a blade on it and compare those results with those from another five crushing experiments using a flat plate without a blade. The two plates were made of aluminum and had identical characteristics other than that one of the plates had a blade on it. Details of the plate with the blade on it are shown in Fig. 1. Fig. 2 is a photo of the ends of the two plates. The profile of the small triangular-shaped blade is visible on the top of the upper plate.
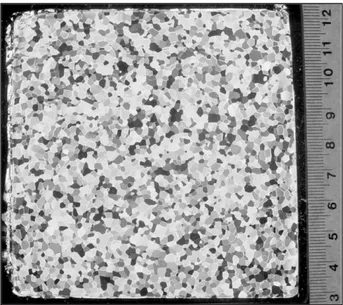
A columnar-grained freshwater ice sheet, from which ice specimens were cut, was grown in a basin in a NRC/OCRE cold room. Columnar freshwater ice was chosen for the tests because it is fairly easy to grow and shape, and furthermore the ice in sea ice sheets is also columnar-grained. The grain structure of the ice is shown in Figs. 3 and 4. The test setup is shown in Fig. 5. The ice samples were confined at their bases by freezing them into the ice holders. The bottoms of the holders were made of acrylic to permit viewing of the ice crushing behaviour at the contact zone through the reasonably transparent bulk of the ice samples. Figs. 6 and 7 show ice samples mounted in holders just prior to when the crushing plate was pushed against the ice at a constant rate. Note that Fig. 7 shows the plate with the blade on it, visible directly below the ice specimen. Fig. 6 shows the plate that did not have a blade on it. Tests were conducted at -10oC and the nominal crushing plate displacement rate was 10 mm/s. The ice was crushed to a depth of approximately 3.4 cm for all tests. The ice samples were initially brick-shaped, as viewed from above, when cut from the ice sheet. Each sample was mounted on edge and lengthwise in its holder. The edge of the brick-shape that projected out of the ice holders was given a rounded wedge shape. In Fig. 7 the columnar ice grains that make up the sample are oriented horizontally and their long axes are perpendicular to the direction of view.
A key aspect of this technology is that for a blade to be effective it must be positioned in the hard zone region of ice contact. High speed imaging observations of the ice contact zone, as viewed through the ice samples themselves, showed that for three of the tests where the plate with the blade was used, the hard zone region of the ice contact zone was not at the location of the blade, that is, the hard zone was for most of the test duration somewhere to either side of the blade and was therefore not influenced by the blade. This was caused by the high degree of unrealistic confinement of the ice attributable to the ice holder that would not be the case if, for example, the edge of an ice sheet was crushed against the plate. In that case the hard zone would have stayed quite localized in the mid region of the sheet thickness, as has been shown in real ice edge crushing experiments (e.g. Frederking, 2004; Määttänen et al., 2011; Sodhi et al., 2001; Takeuchi et al., 1997). Fortunately, for two of the present tests the video
records showed that the hard zone of the ice contact was in the blade region and consequently the load record was affected. The nature of the effect is best described by viewing the load record from a typical test (Test #1) without the blade and a load record from one of the tests with the blade where it was well-positioned relative to the hard zone of the ice contact (Test #4).
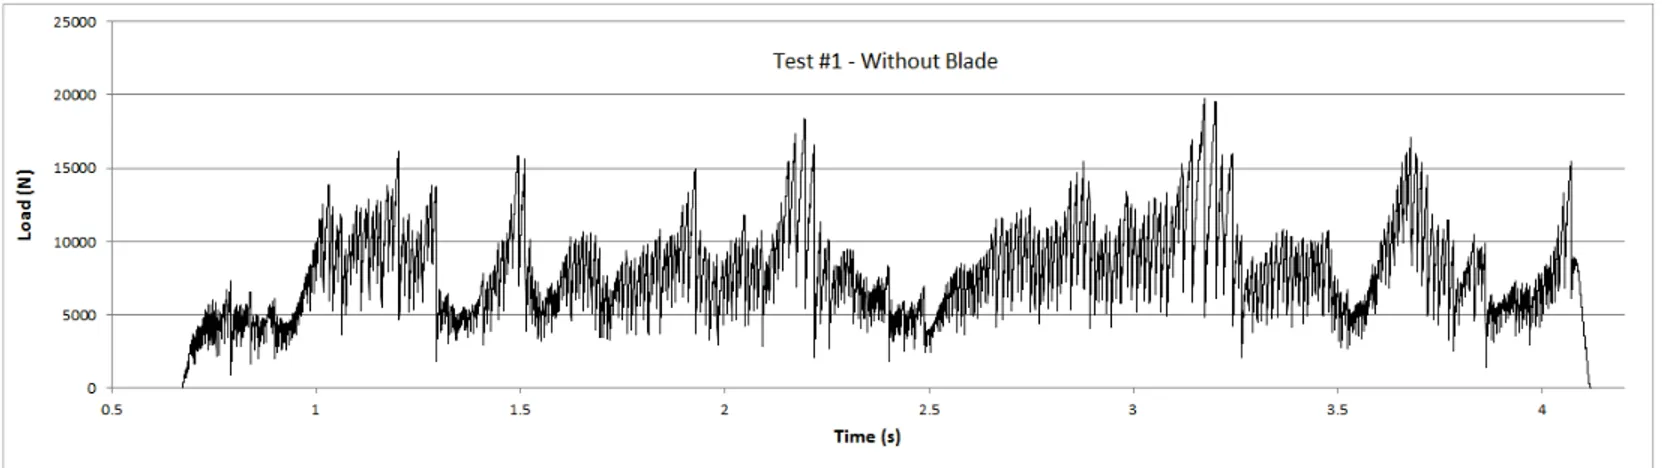
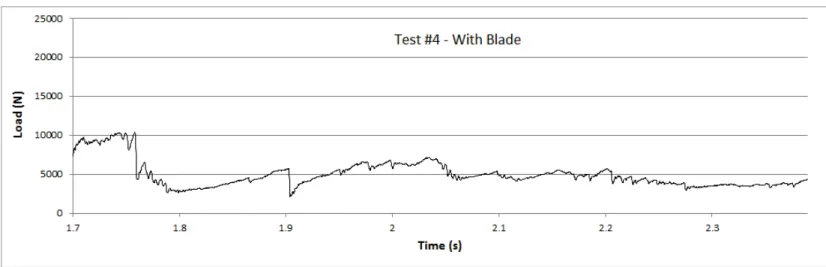
Figs. 8 and 9 show the complete load time series for the cases where the blade was present and when it was not. The two records are distinctly different in that there are a large number of sawtooth oscillations in the record corresponding to the ‘no blade’ case, whereas the ‘blade’ case shows relatively few sawtooth oscillations. Figs. 10 and 11 show expanded views of segments from the two load records so that the presence and absence of the sawtooth episodes is more clearly visible.
The physical behaviour of the ice during the crushing is responsible for the load record characteristics in both cases. The key thing to note is that an ice spalling event is responsible for the sharp drop in load associated with any particular load sawtooth. A spalling event generally refers to what happens when a portion of relatively intact ice, a hard zone, rapidly separates from the ice contact region and shatters, leading to a sudden drop in load. The shattered spalls have properties of crushed ice, that is capable of supporting low pressure, whereas the remaining hard-zone ice will be relatively intact and is capable of supporting high pressure. In the case where no blade is present the spacing of the load sawteeth is such that there is significant buildup of elastic stress in the ice/apparatus system between spalling events, hence the load sawteeth have high amplitudes. In the case where the blade is present there are still spalling events occurring, and associated load sawteeth, however the frequency of the sawtooth pattern is much higher than in the previous case and there is consequently much less elastic stress build up in the ice/apparatus between the events. Hence the amplitudes of the sawteeth are very small and barely discernible compared to the ‘no-blade’ case. The effect of the blade is to initiate many more spalling events than would have occurred with a bladeless crushing plate. From previous experiments (Gagnon, 2008) it was observed that spalling events initiate from the central region of the hard zones during ice crushing. In the present tests the blade accelerates the initiation of spalling events dramatically.
Statistics from the present tests indicated that the average loads over the durations of the tests were roughly the same regardless of the presence or absence of the blade. The effect of the blade is to dramatically increase the frequency of spalling events and in so doing reduce the size of the spalls and the associated amplitudes of the load sawteeth. The second trace overlying the actual load data in Fig. 11 is a running average of the actual data to roughly illustrate the anticipated effect on the load trace that a blade would have had in that particular test.
In summary, the blade effectively mitigates large-amplitude sawtooth loading by increasing the spalling rate and consequently reducing the sawtooth load amplitude. Note that the main characteristics of ice crushing behaviour apply to a wide range of scale size (Gagnon, 1999). Hence the type of blade effect observed in the present tests would be very beneficial in the case of a large offshore structure against which an ice sheet is moving and crushing, such as occurred with the Molikpaq structure in the Beaufort Sea in 1986. Very large oscillations of the structure occurred as the result of the sawtooth load pattern that developed as the ice sheet advanced (Gagnon, 2012). We would expect that had there been a
stationary blade, appropriately scaled, horizontally-oriented, spanning the width of the structure and positioned in the middle of the ice sheet thickness that the large and dangerous spalling-induced oscillations of the structure would not have occurred. Fig. 12 shows actual sawtooth load data from the May 12, 1986 Molikpaq event. The second data trace on the chart is simply a linear fit to the load data that roughly approximates the anticipated load trace that would have resulted if a stationary blade had been installed on the north face of the Molikpaq structure.
References
Frederking, R., 2004. Ice Pressure Variations during Indentation. Proc. IAHR Symposium on Ice, St. Petersburg, Russia, pp. 307̽314.
Gagnon, R.E., 1999. Consistent observations of ice crushing in laboratory tests and field experiments covering three orders of magnitude in scale. Proc. POAC-99, Helsinki, Finland, 2, pp. 858̽869.
Gagnon, R.E., 2008. High-speed imaging of mechanisms responsible for sawtooth cyclic loading during ice crushing. Proceedings of IAHR 2008, Vancouver, Canada, volume 2, pp. 983̽991.
Gagnon, R., 2012. An Explanation for the Molikpaq May 12, 1986 Event. Cold Regions Science and Technology 82 (2012) 75-93.
Määttänen, M., Marjavaara, P., Saarinen, S., 2011. Ice crushing pressure distribution against a compliant stiffened panel. Proc. 21st Int. Conf. On Port and Ocean Engineering under Arctic Conditions, Montreal, Canada, POAC 2011, paper #038.
Sodhi, D.S., Takeuchi, T., Nakazawa, N., Kawamura, S.A.M., 2001. Measurements of ice force and interfacial pressure during medium-scale indentation tests in Japan. Proc. 16th International Conference on Port and Ocean Engineering under Arctic Conditions, Ottawa, Ontario, Canada, pp. 617̽626.
Takeuchi, T., Masaki, T., Akagawa, S., Kawamura, M., Nakazawa, N., Terashima, T., Honda, H., Saeki, H., Hirayama, K., 1997. Medium-scale field indentation tests (MSFIT)̾ice failure characteristics in ice/structure interactions. Proc. of the 7th Int. Offshore and Polar Engineering Conference, Honolulu, USA, vol. II, pp. 376̽382.
Fig. 1. Schematic of the crushing plate that had a small triangular-shaped blade on its top surface.
Fig. 2. End views of the two aluminum plates used in the ice crushing experiments. The small triangular profile of the blade is visible on the top of the upper plate. The lower plate was bladeless.
Fig. 3. Thin section of the ice viewed through cross-polarized filters showing the columnar grain structure. The unit on the scale at the right is cm.
Fig. 4. Thin section of the ice viewed through cross-polarized filters showing an end-on view of the columnar grain structure near the top of the ice sheet. The unit on the scale at the right is cm.
Fig. 5. Test setup. (A) Strong housing for the viewing mirror. (B) Acrylic and steel Ice holder. (C) Ice sample. (D) Aluminum crushing plate.
Fig. 6. Side view of an ice sample mounted in an ice holder positioned above a bladeless crushing plate just prior to a crushing test.
Fig. 7. End view of an ice sample mounted in an ice holder positioned above a crushing plate that has a blade just prior to a crushing test. The small triangular-shaped blade is visible directly below the ice specimen.
Fig. 8. Load time series for Test #4 where the crushing plate had a blade on it.
Fig. 9. Load time series for Test #1 where the crushing plate did not have a blade on it.
Fig. 10. Expanded view of a segment of data from the load time series in Fig. 8.
Fig. 11. Expanded view of a segment of data from the load time series in Fig. 9. The second trace overlying the actual load data is a running average of the real data that roughly illustrates the anticipated effect on the load trace that a blade would have had.
Fig. 12. Actual sawtooth load data from the May 12, 1986 Molikpaq event. The dashed-line trace on the chart is a linear fit to the load data that roughly approximates the anticipated load trace that would have resulted had a stationary horizontally-oriented blade been installed on the north face of the Molikpaq structure.