EUROPEAN ORGANIZATION FOR NUCLEAR RESEARCH (CERN)
CERN-PH-EP-2015-301 LHCb-PAPER-2015-049 February 3, 2016
Measurement of forward W and Z
boson production in pp collisions
at
√
s = 8 TeV
The LHCb collaboration†
Abstract
Measurements are presented of electroweak boson production using data from pp
collisions at a centre-of-mass energy of √s = 8 TeV. The analysis is based on an
integrated luminosity of 2.0 fb−1 recorded with the LHCb detector. The bosons are
identified in the W → µν and Z → µ+µ− decay channels. The cross-sections are
measured for muons in the pseudorapidity range 2.0 < η < 4.5, with transverse
momenta pT > 20 GeV/c and, in the case of the Z boson, a dimuon mass within
60 < Mµ+µ−< 120 GeV/c2. The results are
σW+→µ+ν = 1093.6 ± 2.1 ± 7.2 ± 10.9 ± 12.7 pb ,
σW−→µ−ν = 818.4 ± 1.9 ± 5.0 ± 7.0 ± 9.5 pb ,
σZ→µ+µ−= 95.0 ± 0.3 ± 0.7 ± 1.1 ± 1.1 pb ,
where the first uncertainties are statistical, the second are systematic, the third are due to the knowledge of the LHC beam energy and the fourth are due to the luminosity determination. The evolution of the W and Z boson cross-sections with centre-of-mass energy is studied using previously reported measurements with
1.0 fb−1 of data at 7 TeV. Differential distributions are also presented. Results are
in good agreement with theoretical predictions at next-to-next-to-leading order in perturbative quantum chromodynamics.
Published in JHEP 01 (2016) 155 c
CERN on behalf of the LHCb collaboration, licence CC-BY-4.0. †Authors are listed at the end of this paper.
1
Introduction
Measurements of W and Z boson production cross-sections at hadron colliders constitute important tests of the Standard Model (SM).1 Theoretical predictions for these cross-sections are available at next-to-next-to-leading order (NNLO) in perturbative quantum chromodynamics [1–5]. The dominant uncertainty on these predictions reflects the uncer-tainties on the parton density functions (PDFs). The forward acceptance of the LHCb detector allows the PDFs to be constrained at Bjorken-x values down to 10−4 [6]. Ratios of the W and Z cross-sections provide precise tests of the SM as the sensitivity to the PDFs in the theoretical calculations is reduced and many of the experimental uncertainties cancel.
During LHC Run 1, data were collected at centre-of-mass energies, √s, of 7 TeV and 8 TeV, providing two distinct samples for measurements of the electroweak boson production cross-sections. The evolution of the cross-sections, and cross-section ratios, may be used to infer the existence of physics beyond the Standard Model (BSM) [7].
LHCb has measured the W boson production cross-section at√s = 7 TeV using the muon channel [8], and that of Z bosons decaying to muon [9], electron [10] and tau lepton [11] pairs, using a data set of 1.0 fb−1. The Z boson production cross-section at √s = 8 TeV has also been measured using decays to electron pairs [12]. Similar measurements have also been performed by the ATLAS [13] and CMS [14–16] collaborations, although in different kinematic regions.
The measurements of inclusive W and Z boson cross-sections at √s = 8 TeV de-scribed here are performed following the same procedure as detailed in Refs. [8, 9]. The cross-sections are defined for muons with transverse momentum pT > 20 GeV/c and
pseudo-rapidity in the range 2.0 < η < 4.5. In the case of the Z boson measurements, the invariant mass of the two muons is required to be in the range 60 < Mµµ < 120 GeV/c2. These
kinematic requirements define the fiducial region of the measurement and are referred to as the fiducial requirements in this article. Total cross-sections are presented, as well as differential cross-sections as functions of η of the muons, and of the Z boson rapidity, yZ,
transverse momentum, pT,Z, and φ∗η [17]. Here φ ∗
η is defined as2
φ∗η ≡ tan (φacop/2)
cosh (∆η/2) , (1)
where the angle φacop = π − |∆φ| depends on the difference ∆φ in azimuthal angle between
the two muon momenta, while the difference between their pseudorapidities is denoted by ∆η. Differential cross-section ratios and the muon charge asymmetry, arising from the W production charge asymmetry, are also determined as a function of the muon pseudorapidity.
This article is organised as follows: Section 2 describes the LHCb detector; Section 3 details the selection of W and Z boson candidate samples; Section 4 defines the W and Z
1Throughout this article Z is used to denote the Z/γ∗ contributions. 2The φ∗
boson cross-sections and summarises the relevant sources of systematic uncertainty, as well as their estimation; Section 5 presents the results and Section 6 concludes the article. Appendices A and B provide tables of differential cross-sections and correlations between these measurements.
2
Detector and data set
The LHCb detector [18,19] is a single-arm forward spectrometer covering the pseudorapidity range 2 < η < 5, designed for the study of particles containing b or c quarks. The detector includes a high-precision tracking system consisting of a silicon-strip vertex detector surrounding the pp interaction region, a large-area silicon-strip detector located upstream of a dipole magnet with a bending power of about 4 Tm, and three stations of silicon-strip detectors and straw drift tubes placed downstream of the magnet. The tracking system provides a measurement of momentum, p, of charged particles with a relative uncertainty that varies from 0.5% at low momentum to 1.0% at 200 GeV/c. The minimum distance of a track to a primary vertex, the impact parameter (IP), is measured with a resolution of (15 + 29/pT) µm, where pT is the component of the momentum transverse to the beam,
in GeV/c. Different types of charged hadrons are distinguished using information from two ring-imaging Cherenkov detectors. Photons, electrons and hadrons are identified by a calorimeter system consisting of a scintillating-pad detector (SPD), preshower detectors, an electromagnetic calorimeter and a hadronic calorimeter. Muons are identified by a system composed of alternating layers of iron and multiwire proportional chambers. The online event selection is performed by a trigger [20], which consists of a hardware stage, based on information from the calorimeter and muon systems, followed by a software stage, which applies a full event reconstruction. A requirement that prevents events with high occupancy from dominating the processing time of the software trigger is also applied. This is referred to in this article as the global event cut (GEC).
The measurements presented here are based on pp collision data collected at a centre-of-mass energy of 8 TeV, the integrated luminosity amounting to 1978 ± 23 pb−1. The absolute luminosity scale was measured during dedicated data-taking periods, using both van der Meer scans [21] and beam-gas imaging methods [22]. Both methods give consistent results, which are combined to give the final luminosity estimate with an uncertainty of 1.16% [23].
Several samples of simulated events are produced to estimate contributions from background processes, to verify efficiencies and to correct data for detector-related effects. In the simulation, pp collisions are generated using Pythia 8 [24, 25] with a specific LHCb configuration [26]. Decays of hadronic particles are described by EvtGen [27], in which final-state radiation is generated using Photos [28]. The interaction of the generated particles with the detector, and its response, are implemented using the Geant4 toolkit [29, 30] as described in Ref. [31].
The W boson yields are determined from fits to the data using signal templates produced with the ResBos [32–34] generator configured with the CT14 [35] PDF set. The ResBos
generator includes an approximate NNLO calculation, plus a next-to-next-to-leading logarithm approximation for the resummation of the soft gluon radiation.
The results of the analysis are compared to theoretical predictions calculated with the Fewz [36, 37] generator at NNLO for the PDF sets ABM12 [38], CT10 [39], CT14, HERA1.5 [40], MMHT14 [41] and NNPDF3.0 [42]. All calculations are performed with the renormalisation and factorisation scales set to the electroweak boson mass. Scale uncertainties are estimated by varying these scales by factors of two around the boson mass [43]. Total uncertainties correspond to those coming from the PDF and the strong force coupling strength, αs, both at 68.3% confidence level (CL), added in quadrature with
the scale uncertainties.
3
Event yield
Events for this analysis must satisfy the selection criteria detailed in Refs. [8, 9]. The trigger requires a single muon with pT > 1.5 GeV/c at the hardware stage, and includes
an upper threshold of 600 hits in the SPD to prevent high-particle multiplicity events from dominating the processing time. A muon with pT > 10 GeV/c is required at the
software stage. In the offline analysis, particles are required to be well-reconstructed, to be identified as muons, and also to pass the fiducial requirements.
Additional selection criteria are applied to the W boson candidates to reduce the contributions of various sources of background. Muons from decays of W bosons are generally isolated from other particles. To define a degree of isolation, a cone with radius R =p∆η2+ ∆φ2 = 0.5 is constructed around the direction of the muon track. Excluding
the candidate muon momentum, requiring that there are small amounts of transverse momentum (pcone
T < 2 GeV/c) and transverse energy (ETcone< 2 GeV) in the cone reduces
background originating from generic QCD events. Requiring the transverse momentum of all other muons in the event to be less than 2 GeV/c reduces the contamination from Z → µ+µ− events. An upper limit on the IP of 40 µm removes candidates in which
the muon is not consistent with originating from the primary vertex. Such candidates could be due to electroweak boson decays to tau leptons, which in turn decay to muons, or semileptonic decays of heavy flavour hadrons. Genuine muons are expected to leave low-energy deposits in the electromagnetic and hadronic calorimeters. An upper limit of 4% on the amount of energy that is deposited in the calorimeters relative to the momentum of the track (Ecalo/pc) reduces the background from energetic pions and kaons punching
through the calorimeters to the muon stations. A total of 1 733 327 W → µν candidates are identified.
The W± sample purity (ρW±), defined as the ratio of signal to candidate event yield,
is determined with a template fit to the positively and negatively charged muon pT
distributions in eight bins of muon pseudorapidity using the method of extended maximum likelihood. Only muons with pT smaller than 70 GeV/c are considered. The W± boson
signal and the Z → µ+µ− background templates are based on distributions predicted by
simulation. The overall fraction of the electroweak background (Z → µ+µ−, Z → τ+τ− and W → τ ν decays) in the W boson candidate sample is determined using a data-driven method to be (10.84 ± 0.21)%. A template for backgrounds due to misidentified hadrons is taken from data using a sample of randomly triggered pions and kaons that are weighted by their probability to be misidentified as muons. This component is left free to vary in the fit, and is determined to account for about 9.6% of the total candidates. Finally, a template of heavy-flavour decays is obtained from data using muons with an IP of more than 100 µm. The fraction of this background is determined from a fit to the muon IP distribution and is found to be (1.31 ± 0.09)% of the W boson candidate sample. The momentum calibration for high-pT muons is performed using the data-driven technique
outlined in Ref. [44]. A more detailed description of the fit implementation is given in Ref. [8]. The fit result in the full ηµrange is presented in Fig. 1 (left), where the normalised
residuals show an imperfect description of the data by the adopted templates, similar to the 7 TeV analysis. The effect of this discrepancy on the signal yield is at the few per mille level. The overall purities are ρW+
= (78.91 ± 0.15)% and ρW− = (77.49 ± 0.18)%.
The invariant mass distribution of dimuon pairs passing the Z candidate requirements is shown in Fig. 1 (right). In total, 136 702 Z → µ+µ− candidates are selected. The
background contamination is low. Five background sources are considered: decays of heavy flavour hadrons, hadron misidentification, Z → τ+τ− decays, tt and W W production. The largest sources of background are due to decays of heavy flavour hadrons and hadron misidentification. These backgrounds are determined from data using the techniques discussed in Ref. [9]. The heavy-flavour background is estimated from a subset of the candidate sample by placing additional requirements on muon isolation and dimuon vertex quality. The background due to hadron misidentification is estimated using pairs of hadrons from randomly triggered data. These are weighted by the momentum-dependent probabilities for hadrons to be misidentified as muons. The other backgrounds are determined using simulation and the purity is measured to be ρZ = (99.3 ± 0.2)%.
4
Cross-section measurement
Cross-sections are determined in the specified kinematic ranges and are corrected for quan-tum electrodynamic (QED) final-state radiation (FSR) in order to compare measurements of electroweak boson production in different decay modes and to provide a consistent comparison with next-to-leading order and NNLO QCD predictions. No corrections are applied for initial-state radiation or for electroweak effects and their interplay with QED effects.
The W boson cross-sections are measured as a function of ηµ using the equation
σW±→µ±ν(i) = ρW±(i) L · fFSRW±(i) εGEC(i)· NW±(i) εW± (i) εW± sel (i) AW ± (i), (2)
where all quantities except for the integrated luminosity, L, are determined in each bin i of ηµ. The number of observed W± boson candidates is denoted by NW±(i). The correction
] c [GeV/ µ T p ) c Candidates / (1 GeV/20000 40000 60000 = 8 TeV s LHCb µ+ 2.0 < ηµ < 4.5 µ− Data QCD Fit Electroweak ν µ → W Heavy flavour ] c [GeV/ µ T p Data/Fit 0.80.9 1 1.1 1.2 20 30 40 50 60 70 20 30 40 50 60 70 ] 2 [GeV/c µ µ M 60 80 100 120 ) 2 Candidates / (0.5 GeV/c 0 1000 2000 3000 4000 5000 6000 7000 8000 9000 LHCb s = 8 TeV
Figure 1: (left) Template fit to the (left panel) positive and (right panel) negative muon pT
spectra in the full ηµ range for W candidates. Data are compared to fitted contributions from
W → µν signal and QCD, electroweak and heavy flavour backgrounds. (right) Invariant mass distribution of dimuon pairs in the Z candidate sample.
factors for QED final-state radiation are given by fW±
FSR and the efficiency of the requirement
on the number of SPD hits in the hardware trigger is represented by εGEC. The total muon reconstruction efficiency is denoted by εW± while the efficiency of the selection criteria is
given by εW±
sel . The acceptance correction, AW ±
, accounts for the 70 GeV/c experimental upper bound in the fit to the muon pT.
The Z boson cross-sections are measured in bins of yZ, pT,Z, φ∗η and ηµ, by integrating
over all but one of these variables. To account for bin migration effects, the cross-section in bin i is determined from the number of events in all bins j with an unfolding matrix U , as follows σZ→µ+µ−(i) = ρZ L · fZ FSR(i) εGEC(i)· X j U (i, j) X k 1 εZ(ηµ+ k , η µ− k ) ! j . (3)
In this expression the index k runs over all candidates contributing to bin j and εZ is the
pseudorapidity-dependent muon-reconstruction efficiency for event k. The matrix U is determined from simulated data, as described in Section 4.6. The QED final-state radiation corrections are denoted by fZ
FSR. The components that are common with the W boson
cross-sections defined in Eq. 2 are the luminosity and the individual muon reconstruction efficiencies.
Although the beam energy does not enter in Eqs. 2 and 3, a related uncertainty is assigned to all cross-sections. More details on these individual components are given below.
4.1
Muon reconstruction efficiencies
The data are corrected for inefficiencies associated with track reconstruction, muon identification, and trigger requirements. All efficiencies are determined from data using the techniques detailed in Refs. [8, 9], where the track reconstruction, muon identification, and muon trigger efficiencies are obtained using tag-and-probe methods applied to the Z candidates. The tag and the probe tracks are required to satisfy the fiducial requirements. The tag must be identified as a muon and be consistent with triggering the event, while the probe is defined so that it is unbiased with respect to the requirement for which the efficiency is being measured. The efficiency is studied as a function of several variables, which include both the muon momenta and the detector occupancy. In this analysis, reconstruction, identification and trigger efficiencies are applied as a function of the muon pseudorapidity. The efficiency in each bin of ηµ is defined as the fraction of tag-and-probe candidates where the probe satisfies the corresponding track reconstruction, identification or trigger requirement. All efficiencies are observed to be independent of the muon charge.
The tracking efficiency is determined using probe tracks that are reconstructed by combining hits from the muon stations and the large-area silicon-strip detector. The muon identification efficiency is determined using probe tracks that are reconstructed without using the muon system. The single-muon trigger efficiency is determined using reconstructed muons as probes.
4.2
GEC efficiency
The efficiency of the SPD multiplicity limit at 600 hits in the muon trigger is evaluated from data using two independent methods. The first exploits the fact that the SPD multiplicities of single pp interactions involving a Z boson are rarely above the 600 hit threshold. The expected SPD multiplicity distribution of signal events is constructed by adding the multiplicities of signal events in single pp interactions to the multiplicities of randomly triggered events, as in Ref. [45]. The convolution of the distributions extends to values above 600 hits, and the fraction of events that the trigger rejects can be determined. The second method consists of fitting the SPD multiplicity distribution and extrapolating the fit function to determine the fraction of events that are rejected, as in Ref. [9]. Both methods give consistent results and εGEC = (93.00 ± 0.32)% is used in this analysis as the overall efficiency. This efficiency depends linearly on yZ and ηµ, with about 2%
variation across the full range. This is accounted for by applying a bin-dependent efficiency correction.
4.3
Final-state radiation
The FSR correction is taken to be the mean of the corrections calculated with Herwig++ [46] and Pythia 8. The corrections are tabulated in Appendix A and are about 2.5% on average.
4.4
Selection efficiencies
The efficiency of the additional selection requirements for the W boson candidate samples is evaluated using a sample of Z bosons from data, where one of the muons is excluded to mimic a W → µν decay [8]. However, this introduces a bias because the pT distribution of
muons from Z bosons is harder than those from W bosons. Simulation is used to correct for this bias and for the fact that the Z boson sample requires two muons in the LHCb acceptance.
4.5
Acceptance
Only muons with pTsmaller than 70 GeV/c are considered for the extraction of the W boson
signal. A kinematic acceptance correction is required in order to measure cross-sections without this restriction on muon pT. This correction is evaluated using the ResBos
simulated sample.
4.6
Unfolding the detector response
To correct for detector resolution effects, an unfolding is performed (matrix U of Eq. 3) using LHCb simulation and the RooUnfold [47] software package. Only the pT,Z and φ∗η
distributions are unfolded. Since yZ and ηµ are well measured, no unfolding is performed.
The momentum resolution in the simulation is calibrated to the data. The data are then unfolded using the iterative Bayesian approach proposed in Ref. [48]. Other unfolding techniques [49, 50] give similar results. Additionally, all unfolding methods are tested for model dependence using underlying distributions from order Pythia 8, leading-order Herwig++, as well as next-to-leading leading-order Powheg [51–53] showered with both Pythia 8 and Herwig++ using the Powheg matching scheme. The corrections are between 0.5–8.0% as a function of pT,Z, and between 0.1–7.0% as a function of φ∗η.
4.7
Systematic uncertainties
Sources of systematic uncertainty and their effects on the total cross-section measurements from the √s = 8 TeV data set are summarised in Table 1. The uncertainty due to the momentum correction is negligible. Uncertainties from external input, e.g. the beam energy and luminosity determinations, are quoted separately from the other contributions.
For the W boson samples, the systematic uncertainty on the purity is estimated by considering different shapes and normalisations of the templates, refitting, and summing in quadrature the largest observed deviation in the results corresponding to each source [8]. The uncertainty on the ResBos signal template shape includes the effects of the PDF, the factorisation scale and the renormalisation scale. An alternative definition for the QCD background template, potential mismodelling of the lepton pT shape in Pythia
for events that contain jets, and the normalisations of the background templates are accounted for with additional uncertainties. The total uncertainties on the W+ and W−
Table 1: Summary of the relative uncertainties on the W+, W− and Z boson cross-sections. Source Uncertainty [%] σW+→µ+ν σW−→µ−ν σZ→µ+µ− Statistical 0.19 0.23 0.27 Purity 0.28 0.21 0.21 Tracking 0.26 0.24 0.48 Identification 0.11 0.11 0.21 Trigger 0.14 0.13 0.05 GEC 0.40 0.41 0.34 Selection 0.24 0.24 — Acceptance and FSR 0.16 0.14 0.13 Systematic 0.65 0.61 0.67 Beam energy 1.00 0.86 1.15 Luminosity 1.16 1.16 1.16 Total 1.67 1.59 1.79
sample, the systematic uncertainty on the purity is determined by considering alternative definitions of the heavy-flavour background samples, and by varying by their uncertainties the probabilities for hadrons to be misidentified as muons. In addition, an uncertainty accounting for the assumption that the purity is the same for all variables and bins of the analysis is evaluated by comparing to cross-section measurements using a binned purity, rather than a global one. The uncertainties on the differential cross-section measurements due to variations in purity are typically less than 1%.
The systematic uncertainty associated with the trigger, identification and tracking efficiencies is determined by re-evaluating all cross-sections with the values of the individual efficiencies increased or decreased by one standard deviation. The full covariance matrix of the differential cross-section measurements is evaluated in this way for each source of uncertainty. The covariance matrices for each source are added and the diagonal elements of the result determine the total systematic uncertainty due to reconstruction efficiencies. The total uncertainties on the W+, W− and Z boson integrated cross-sections due to reconstruction efficiencies are 0.32%, 0.29% and 0.53%.
The GEC efficiency for events containing a Z boson is εZ
GEC = (93.00 ± 0.32)%.
Differences between this efficiency and those for events containing a W+ or W− boson are expected to be small, and are thus accounted for with additional systematic uncertainties, as explained in Ref. [9]. The values used for the measurements of W boson cross-sections are εWGEC+ = (93.00 ± 0.37)% and εWGEC− = (93.00 ± 0.38)%.
The uncertainties due to W boson selection efficiencies result in uncertainties on the W+ and W−integrated cross-sections of 0.24% and 0.23%. These include the uncertainties
that arise due to the difference in W and Z boson muon pT spectra and the correction
in the Z boson data sample.
As an estimate of the uncertainty due to the acceptance correction, half the difference between the corrections evaluated using the ResBos generators and Pythia 8 is taken. This results in uncertainties on the W+ and W− integrated cross-sections of 0.06% and 0.09%.
The systematic uncertainty on the FSR correction is the quadratic sum of two com-ponents. The first is due to the statistical precision of the Pythia 8 and Herwig++ estimates and the second is half of the difference between their central values, where the latter dominates.
The measurements are specified at a pp centre-of-mass energy of√s = 8 TeV. The beam energy, and consequently the centre-of-mass energy, is known to 0.65% [54]. The sensitivity of the cross-section to the centre-of-mass energy is studied with the DYNNLO [55] generator at NNLO. Cross-sections are calculated at 1 TeV intervals in centre-of-mass energy and a functional form for the cross-section is determined from a spline interpolation. A 0.65% uncertainty on the centre-of-mass energy induces relative uncertainties of 1.00%, 0.86% and 1.15% on the expected W+, W− and Z cross-sections.
The uncertainty on the luminosity determination is 1.16% [23], which represents the largest contribution to the total uncertainty.
5
Results
5.1
Cross-sections at
√
s = 8 TeV
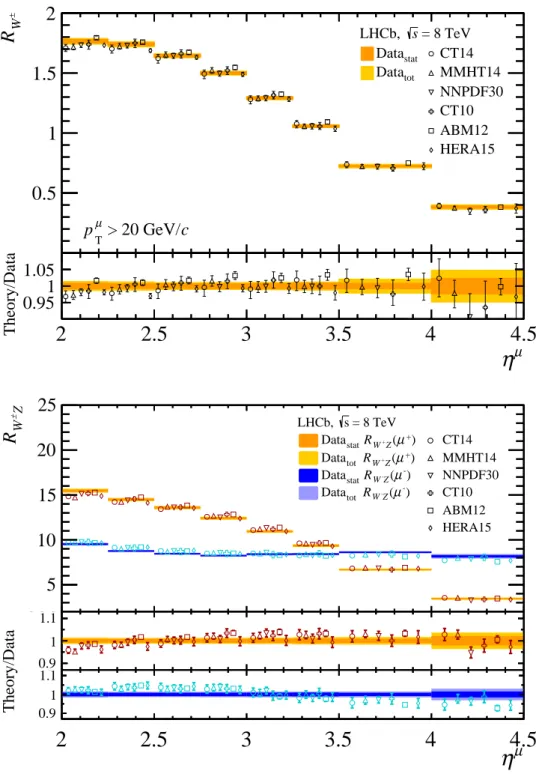
The measured cross-section as a function of muon pseudorapidity in W boson decays is shown in Fig. 2 (top). Good agreement with the predictions of the Fewz generator, with six different PDF sets, is observed. Similar conclusions can be drawn from the comparisons of Z boson cross-section measurements with predictions as a function of rapidity, as shown in Fig. 2 (bottom). All differential cross-sections are detailed in Tables 4, 5, 6, 7 and 8 of Appendix A.
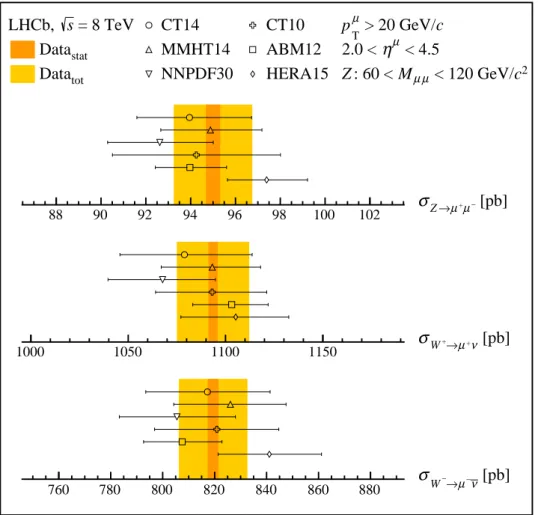
The total cross-sections are measured to be
σW+→µ+ν = 1093.6 ± 2.1 ± 7.2 ± 10.9 ± 12.7 pb ,
σW−→µ−ν = 818.4 ± 1.9 ± 5.0 ± 7.0 ± 9.5 pb ,
σZ→µ+µ− = 95.0 ± 0.3 ± 0.7 ± 1.1 ± 1.1 pb ,
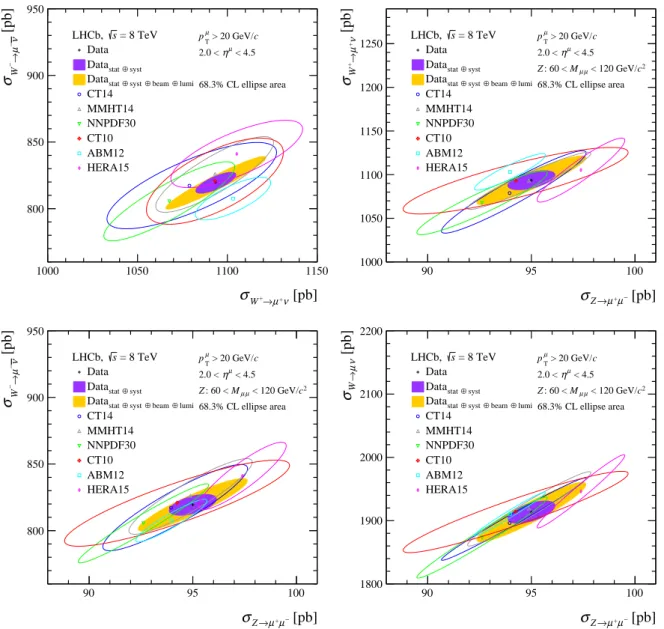
where the first uncertainties are statistical, the second are systematic, the third are due to the knowledge of the LHC beam energy and the fourth are due to the luminosity measurement. The agreement of the measurements with NNLO predictions given by the Fewz generator configured with various PDF sets is illustrated in Fig. 3. Two-dimensional plots of electroweak boson cross-sections are shown in Fig. 4, where the ellipses correspond to 68.3% CL coverage.
A best linear unbiased estimator [56] is used to combine the Z boson production cross-section at √s = 8 TeV measured with the muon and the electron [12] channels. The
µ η
[pb]
µη
/d
νµ → Wσ
d
200 400 600 800 1000 = 8 TeV s LHCb, ) + W ( stat Data CT14 ) + W ( tot Data MMHT14 ) − W ( stat Data NNPDF30 ) − W ( tot Data CT10 ABM12 HERA15 c > 20 GeV/ µ T p µη
2
2.5
3
3.5
4
4.5
Theory/Data µ η 0.91 1.1 µ η 0.91 1.1 Zy
2
2.5
3
3.5
4
4.5
[pb]
Z
y
/d
µµ
→
Z
σ
d
0
20
40
60
80
100
Z y 2 2.5 3 3.5 4 4.5[pb]
Zy
/d
µµ → Zσ
d
0 20 40 60 80 100 = 8 TeV s LHCb, ) Z ( stat Data CT14 ) Z ( tot Data MMHT14 NNPDF30 CT10 ABM12 HERA15 Theory/Data 0.6 0.8 1 1.2 1.4 1.6Figure 2: (top) Differential W+ and W− boson production cross-section in bins of muon
pseudorapidity. (bottom) Differential Z boson production cross-section in bins of boson rapidity. Measurements, represented as bands, are compared to (markers, displaced horizontally for presentation) NNLO predictions with different parameterisations of the PDFs.
= 8 TeV s LHCb, stat Data tot Data CT14 MMHT14 NNPDF30 CT10 ABM12 HERA15 c > 20 GeV/ µ T p < 4.5 µ η 2.0 < 2 c < 120 GeV/ µ µ M : 60 < Z 88 90 92 94 96 98 100 102 [pb] − µ + µ → Z σ 1000 1050 1100 1150 →µ+ν [pb] + W σ 760 780 800 820 840 860 880 [pb] ν − µ → − W σ
Figure 3: Summary of the W and Z cross-sections. Measurements, represented as bands, are compared to (markers) NNLO predictions with different parameterisations of the PDFs.
combined result is
σZ→`+`− = 94.9 ± 0.2 ± 0.6 ± 1.1 ± 1.1 pb .
Uncertainties due to the GEC, the LHC beam energy and the luminosity measurement are assumed to be fully correlated, while the other uncertainties are assumed to be uncorrelated.
[pb] ν + µ → + W σ 1000 1050 1100 1150 [pb] ν −µ → − W σ 800 850 900 950 = 8 TeV s LHCb, Data syst ⊕ stat Data lumi ⊕ beam ⊕ syst ⊕ stat Data CT14 MMHT14 NNPDF30 CT10 ABM12 HERA15 c > 20 GeV/ µ T p < 4.5 µ η 2.0 < 68.3% CL ellipse area [pb] − µ + µ → Z σ 90 95 100 [pb]ν + µ → + W σ 1000 1050 1100 1150 1200 1250 LHCb, s = 8 TeV Data syst ⊕ stat Data lumi ⊕ beam ⊕ syst ⊕ stat Data CT14 MMHT14 NNPDF30 CT10 ABM12 HERA15 c > 20 GeV/ µ T p < 4.5 µ η 2.0 < 2 c < 120 GeV/ µ µ M : 60 < Z 68.3% CL ellipse area [pb] − µ + µ → Z σ 90 95 100 [pb] ν −µ → − W σ 800 850 900 950 = 8 TeV s LHCb, Data syst ⊕ stat Data lumi ⊕ beam ⊕ syst ⊕ stat Data CT14 MMHT14 NNPDF30 CT10 ABM12 HERA15 c > 20 GeV/ µ T p < 4.5 µ η 2.0 < 2 c < 120 GeV/ µ µ M : 60 < Z 68.3% CL ellipse area [pb] − µ + µ → Z σ 90 95 100 [pb]ν µ → W σ 1800 1900 2000 2100 2200 = 8 TeV s LHCb, Data syst ⊕ stat Data lumi ⊕ beam ⊕ syst ⊕ stat Data CT14 MMHT14 NNPDF30 CT10 ABM12 HERA15 c > 20 GeV/ µ T p < 4.5 µ η 2.0 < 2 c < 120 GeV/ µ µ M : 60 < Z 68.3% CL ellipse area
Figure 4: Two-dimensional plots of electroweak boson cross-sections compared to NNLO predic-tions for various parameterisapredic-tions of the PDFs. The uncertainties on the theoretical predicpredic-tions correspond to the PDF uncertainty only. All ellipses correspond to uncertainties at 68.3% CL.
5.2
Ratios of cross-sections at
√
s = 8 TeV
The ratios of electroweak boson production cross-sections are defined as RW± = σW+→µ+ν σW−→µ−ν , (4) RW+Z = σW+→µ+ν σZ→µ+µ− , (5) RW−Z = σW−→µ−ν σZ→µ+µ− , (6) RW Z = σW+→µ+ν + σW−→µ−ν σZ→µ+µ− , (7)
and the muon charge asymmetry as a function of the muon pseudorapidity is defined as
Aµ(ηi) =
σW+→µ+ν(ηi) − σW−→µ−ν(ηi)
σW+→µ+ν(ηi) + σW−→µ−ν(ηi)
. (8)
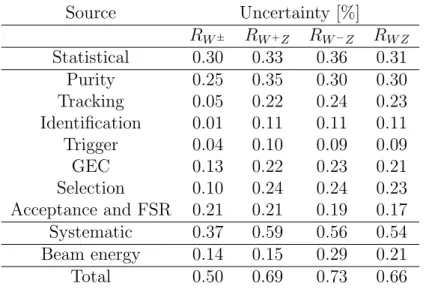
The sources of uncertainties contributing to the determination of the ratios are sum-marised in Table 2. With respect to the systematic uncertainties on the cross-sections, many sources cancel or are reduced. The luminosity uncertainty completely cancels in the ratios, as do the correlated components of the GEC efficiency uncertainty. The trigger used to select both samples is identical and most of the uncertainty on the determination of the trigger efficiency cancels. The uncertainties on the tracking and muon identification efficiencies partially cancel in the ratios of W and Z boson cross-sections, as do the uncertainties due to the proton beam energies. The uncertainties on the purities of the W and Z boson selections are uncorrelated and the FSR uncertainties are taken to be uncorrelated. The dominant uncertainties on the ratios are due to the purity and the size of the samples. The correlation coefficients used in the uncertainty calculations are given in Tables 15–21 in Appendix B.
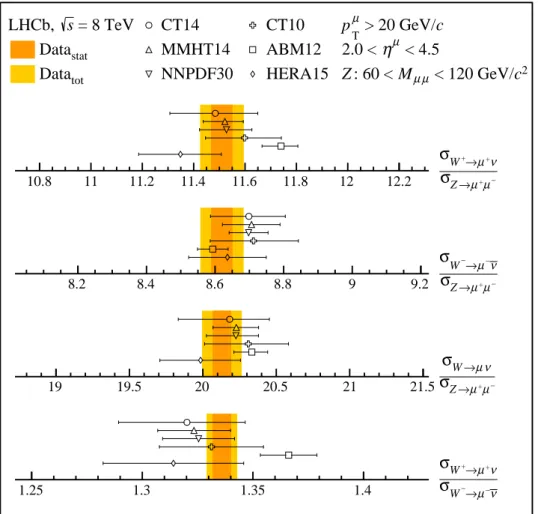
The W boson cross-section ratio is measured as
RW± = 1.336 ± 0.004 ± 0.005 ± 0.002 ,
where the first uncertainty is statistical, the second is systematic and the third is due to the knowledge of the LHC beam energy. The W to Z boson production ratios are found to be
RW+Z = 11.51 ± 0.04 ± 0.07 ± 0.02 ,
RW−Z = 8.62 ± 0.03 ± 0.05 ± 0.02 ,
RW Z = 20.13 ± 0.06 ± 0.11 ± 0.04 .
These measurements, as well as their predictions, are displayed in Fig. 5. The data are well described by all PDF sets. The W+ to W− boson ratio, the charged W to Z boson ratios,
and the muon charge asymmetry are determined differentially as a function of muon η, and displayed in Figs. 6 and 7. Good agreement between measured and predicted values is observed. All differential results are listed in Tables 9, 10 and 11 of Appendix A.
Table 2: Summary of the relative uncertainties on the RW±, RW+Z, RW−Z and RW Z cross-section ratios. Source Uncertainty [%] RW± RW+Z RW−Z RW Z Statistical 0.30 0.33 0.36 0.31 Purity 0.25 0.35 0.30 0.30 Tracking 0.05 0.22 0.24 0.23 Identification 0.01 0.11 0.11 0.11 Trigger 0.04 0.10 0.09 0.09 GEC 0.13 0.22 0.23 0.21 Selection 0.10 0.24 0.24 0.23 Acceptance and FSR 0.21 0.21 0.19 0.17 Systematic 0.37 0.59 0.56 0.54 Beam energy 0.14 0.15 0.29 0.21 Total 0.50 0.69 0.73 0.66
5.3
Ratios of cross-sections at different centre-of-mass energies
The cross-section measurements detailed in the previous sections were also performed using 1.0 fb−1 of data at 7 TeV [9]. The two sets of measurements are used to make measurements of ratios of quantities at different centre-of-mass energies. The ratios of cross-sections are defined as R8/7W+ = σ8 TeVW+→µ+ν σ7 TeV W+→µ+ν , (9) RW8/7− = σ8 TeVW−→µ−ν σ7 TeV W−→µ−ν , (10) R8/7Z = σ 8 TeV Z→µ+µ− σ7 TeV Z→µ+µ− , (11)and the double ratios of cross-sections are defined as
RR8/7 W ± = σ8 TeV W+→µ+ν σ7 TeV W+→µ+ν σ7 TeV W−→µ−ν σ8 TeV W−→µ−ν , (12) R8/7R W +Z = σ8 TeV W+→µ+ν σ7 TeV W+→µ+ν σ7 TeV Z→µ+µ− σ8 TeV Z→µ+µ− , (13) RR8/7 W −Z = σW8 TeV−→µ−ν σ7 TeV W−→µ−ν σZ→µ7 TeV+µ− σ8 TeV Z→µ+µ− , (14) R8/7RW Z = σ 8 TeV W→µν σ7 TeV W→µν σZ→µ7 TeV+µ− σ8 TeV Z→µ+µ− . (15)
= 8 TeV s LHCb, stat Data tot Data CT14 MMHT14 NNPDF30 CT10 ABM12 HERA15 c > 20 GeV/ µ T p < 4.5 µ η 2.0 < 2 c < 120 GeV/ µ µ M : 60 < Z 10.8 11 11.2 11.4 11.6 11.8 12 12.2 σZ→µ+µ− ν + µ → + W σ 8.2 8.4 8.6 8.8 9 9.2 σZ→µ+µ− ν − µ → − W σ 19 19.5 20 20.5 21 21.5σZ→µ+µ− ν µ → W σ 1.25 1.3 1.35 1.4 −→µ−ν W σ ν + µ → + W σ
Figure 5: Summary of the cross-section ratios. Measurements, represented as bands, are compared to (markers) NNLO predictions with different parameterisations of the PDFs.
The following assumptions are made in order to estimate uncertainties on these ratios. • The uncertainties due to statistically independent samples are uncorrelated, e.g. the
uncertainties due to the number of candidates in each measured bin, the uncertainties on the muon reconstruction efficiencies that are uncorrelated between ηµbins, and the
uncertainty that arises from corrections for having two muons inside the acceptance when measuring the selection efficiencies of W bosons and the W boson purity. • The uncertainties reflecting common methods are correlated, e.g. the Z candidate
sample purity estimation, the components of the muon reconstruction efficiencies that are correlated between muon η bins, and the uncertainty that arises when measuring selection efficiencies for W bosons and all aspects of the GEC efficiency. • The uncertainty due to the FSR correction is taken to be correlated in identical
µ η ± W
R
0.5
1
1.5
2
= 8 TeV s LHCb, stat Data CT14 tot Data MMHT14 NNPDF30 CT10 ABM12 HERA15 c > 20 GeV/ µ T p µη
2
2.5
3
3.5
4
4.5
Theory/Data 0.95 1 1.05 µη
2
2.5
3
3.5
4
4.5
Z
±W
R
5
10
15
20
25
µ η 2 2.5 3 3.5 4 4.5 Z ± W R 5 10 15 20 25 = 8 TeV s LHCb, ) + µ ( Z + W R stat Data CT14 ) + µ ( Z + W R tot Data MMHT14 ) -µ ( Z -W R stat Data NNPDF30 ) -µ ( Z -W R tot Data CT10 ABM12 HERA15 2 2.5 3 3.5 4 4.5 0.9 1 1.1 0.9 1 1.1 Theory/DataFigure 6: (top) W+ to W− cross-section ratio in bins of muon pseudorapidity. (bottom) W+
(W−) to Z cross-section ratio in bins of µ+ (µ−) pseudorapidity. Measurements, represented as
bands, are compared to (markers, displaced horizontally for presentation) NNLO predictions with different parameterisations of the PDFs.
µ η µ
A
0.4
−
0.2
−
0
0.2
0.4
= 8 TeV s LHCb, stat Data CT14 tot Data MMHT14 NNPDF30 CT10 ABM12 HERA15 c > 20 GeV/ µ T p µη
2
2.5
3
3.5
4
4.5
Theory-Data 0.04 −0.02 − 0 0.02 0.04Figure 7: W production charge asymmetry in bins of muon pseudorapidity. Measurements, represented as bands, are compared to (markers, displaced horizontally for presentation) NNLO predictions with different parameterisations of the PDFs.
• The beam energy has been directly measured for 4 TeV beams with a precision of 0.65%, but not for 3.5 TeV beams [54]. No additional uncertainty is expected to enter the energy measurement of 3.5 TeV beams, so the relative uncertainty is taken to be the same, and fully correlated between data sets with different centre-of-mass energies.
• The uncertainties (δ
√ s
i ) entering the luminosity estimates are given in Ref. [23]. The
degree of correlation between the luminosity measurements at different centre-of-mass energies is determined by assigning correlation coefficients (ci) of 0, 1, [0,0.5], [0.5,1]
or [0,1], where the last three represent intervals within which the true correlation is expected to lie. Pseudoexperiments are studied using correlation coefficients that are sampled from both uniform and arcsin distributions across these intervals. With this prescription, the total correlation is calculated using
c = P
iciδ8 TeVi δi7 TeV
δ8 TeVδ7 TeV (16)
and estimated to be 0.55 ± 0.06. A correlation coefficient of 0.55 is used.
A summary of the uncertainties on ratios of quantities at different centre-of-mass energies is given in Table 3.
Table 3: Summary of the relative uncertainties on the electroweak boson cross-section ratios at different centre-of-mass energies.
Source Uncertainty [%] R8/7W+ R 8/7 W− R 8/7 Z R 8/7 RW ± R 8/7 RW +Z R 8/7 RW −Z R 8/7 RW Z Statistical 0.30 0.37 0.49 0.48 0.58 0.62 0.55 Purity 0.41 0.45 — 0.65 0.41 0.45 0.29 Tracking 0.33 0.27 0.53 0.09 0.23 0.26 0.24 Identification 0.07 0.07 0.13 0.03 0.07 0.06 0.07 Trigger 0.27 0.25 0.09 0.08 0.19 0.16 0.17 GEC 0.15 0.14 0.09 0.07 0.09 0.09 0.08 Selection 0.17 0.17 — 0.04 0.17 0.17 0.16 Acceptance and FSR 0.05 0.06 0.04 0.08 0.07 0.07 0.06 Systematic 0.64 0.63 0.56 0.66 0.55 0.59 0.46 Beam energy 0.06 0.05 0.10 — 0.04 0.05 0.05 Luminosity 1.45 1.45 1.45 — — — — Total 1.61 1.62 1.63 0.82 0.80 0.86 0.72
The cross-section ratios at different centre-of-mass energies, measured for the same kinematic range as the total cross-sections, are
R8/7W+ = 1.245 ± 0.004 ± 0.008 ± 0.001 ± 0.018 ,
R8/7W− = 1.187 ± 0.004 ± 0.007 ± 0.001 ± 0.017 ,
R8/7Z = 1.250 ± 0.006 ± 0.007 ± 0.001 ± 0.018 ,
where the first uncertainties are statistical, the second are systematic, the third are due to the knowledge of the LHC beam energy and the fourth are due to the luminosity measurement. The measurements and predictions are in agreement, as shown in Fig. 8. Compared to Fig. 3, the variation in the predictions is small. This indicates that the uncertainty due to the PDF is very much reduced, which is also reflected in the calculated uncertainties on the individual PDF predictions.
Even more precise tests can be obtained through the following double ratios of cross-sections, which are independent of the luminosities of either data set. These double ratios are defined and measured as
RR8/7 W ± = 1.049 ± 0.005 ± 0.007 , R8/7R W +Z = 0.996 ± 0.006 ± 0.005 , R8/7R W −Z = 0.950 ± 0.006 ± 0.006 , R8/7RW Z = 0.976 ± 0.005 ± 0.004 ,
LHCb stat Data tot Data CT14 MMHT14 NNPDF30 CT10 ABM12 HERA15 c > 20 GeV/ µ T p < 4.5 µ η 2.0 < 2 c < 120 GeV/ µ µ M : 60 < Z 1.15 1.2 1.25 1.3 1.35 σ7TeVZ→µ+µ− 8TeV − µ + µ → Z σ 1.15 1.2 1.25 1.3 1.35 7TeV ν + µ → + W σ 8TeV ν + µ → + W σ 1.1 1.15 1.2 1.25 1.3 7TeV ν − µ → − W σ 8TeV ν − µ → − W σ
Figure 8: Summary of the W and Z cross-section ratios at different centre-of-mass energies. Measurements, represented as bands, are compared to (markers) NNLO predictions with different parameterisations of the PDFs.
where the first uncertainties are statistical and the second are systematic. The largest source of systematic uncertainty on these ratios is due to the evaluation of the purity of the W boson sample, which ranges between 0.3% and 0.7%. The double ratios are shown in Fig. 9, where the uncertainties on the predictions due to the PDF, scale, αs and numerical
integration are of similar magnitude. Taking the uncertainty on the SM prediction to be reflected by the spread of the PDF predictions, the maximal deviation between the measured results and the theory is at the level of about 2 standard deviations.
The ratios R8/7R
W +Z, R 8/7
RW −Z are also measured differentially as a function of muon η.
These measurements are displayed in Fig. 10, where only uncertainties due to PDFs are included on the predictions. Good agreement between measurement and prediction is observed, especially for the R8/7R
W −Z ratio. The R 8/7
RW +Z ratio increases as a function of η µ,
while the R8/7R
W −Z ratio decreases as a function of η
LHCb stat Data tot Data CT14 MMHT14 NNPDF30 CT10 ABM12 HERA15 c > 20 GeV/ µ T p < 4.5 µ η 2.0 < 2 c < 120 GeV/ µ µ M : 60 < Z 0.94 0.96 0.98 1 1.02 1.04 8TeV − µ + µ → Z σ 7TeV − µ + µ → Z σ 7TeV ν + µ → + W σ 8TeV ν + µ → + W σ 0.9 0.92 0.94 0.96 0.98 1 8TeV − µ + µ → Z σ 7TeV − µ + µ → Z σ 7TeV ν − µ → − W σ 8TeV ν − µ → − W σ 0.92 0.94 0.96 0.98 1 1.02 σ8TeVZ→µ+µ− 7TeV − µ + µ → Z σ 7TeV ν µ → W σ 8TeV ν µ → W σ 1 1.02 1.04 1.06 1.08 1.1 8TeV ν − µ → − W σ 7TeV ν − µ → − W σ 7TeV ν + µ → + W σ 8TeV ν + µ → + W σ
Figure 9: Summary of the cross-section double ratios at different centre-of-mass energies. Mea-surements, represented as bands, are compared to (markers) NNLO predictions with different parameterisations of the PDFs.
the RR8/7
W +Z ratio at high pseudorapidity, suggesting that these measurements can improve
the determination of the PDFs in this region. Differential measurements are reported in Table 12 of Appendix A, along with new differential measurements that were not published in Ref. [9] that are required for this analysis (Tables 13 and 14).
6
Conclusions
Measurements of forward electroweak boson production at √s = 8 TeV are presented and found to be in agreement with NNLO calculations in perturbative quantum chromody-namics. The large degree of correlation between the uncertainties allows for sub-percent determination of the cross-section ratios. These represent the most precise determinations to date of electroweak boson production at the LHC. Using previous results from the
µ
η
2
2.5
3
3.5
4
4.5
8/7
Z
±W
R
0.6
0.8
1
1.2
1.4
1.6
1.8
2
µ η 2 2.5 3 3.5 4 4.5 8/7 Z ± W R 0.6 0.8 1 1.2 1.4 1.6 1.8 2 ) + µ ( 8/7 Z + W R stat Data ) + µ ( 8/7 Z + W R tot Data ) -µ ( 8/7 Z -W R stat Data ) -µ ( 8/7 Z -W R tot Data CT14 MMHT14 NNPDF30 CT10 ABM12 HERA15 2 2.5 3 3.5 4 4.5 0.9 1 1.1 0.91 1.1 Theory/DataFigure 10: Double ratios of cross-sections at different centre-of-mass energies as a function of muon pseudorapidity. Measurements, represented as bands, are compared to (markers, displaced horizontally for presentation) NNLO predictions with different parameterisations of the PDFs.
√
s = 7 TeV data set, the evolution with the centre-of-mass energy is studied. Good agree-ment between measured and predicted cross-section ratios is observed. The experiagree-mental uncertainties are dominated by luminosity uncertainties of about 1.5%. Double ratios of cross-sections at different centre-of-mass energies are independent of the luminosity and are thus a more precise class of observables, determined with precision of between 0.7% and 0.9%. In the cross-section ratios, the predictions deviate slightly from the measurements. Such deviations can be expected in BSM extensions that feature new sources of W and Z production. This motivates the extension of this analysis to higher energies, as will be possible with future data.
Acknowledgements
We express our gratitude to our colleagues in the CERN accelerator departments for the excellent performance of the LHC. We thank the technical and administrative staff at the LHCb institutes. We acknowledge support from CERN and from the national agencies: CAPES, CNPq, FAPERJ and FINEP (Brazil); NSFC (China); CNRS/IN2P3 (France); BMBF, DFG and MPG (Germany); INFN (Italy); FOM and NWO (The Netherlands); MNiSW and NCN (Poland); MEN/IFA (Romania); MinES and FANO (Russia); MinECo (Spain); SNSF and SER (Switzerland); NASU (Ukraine); STFC (United Kingdom); NSF (USA). We acknowledge the computing resources that are provided by CERN, IN2P3
(France), KIT and DESY (Germany), INFN (Italy), SURF (The Netherlands), PIC (Spain), GridPP (United Kingdom), RRCKI (Russia), CSCS (Switzerland), IFIN-HH (Romania), CBPF (Brazil), PL-GRID (Poland) and OSC (USA). We are indebted to the communities behind the multiple open source software packages on which we depend. We are also thankful for the computing resources and the access to software R&D tools provided by Yandex LLC (Russia). Individual groups or members have received support from AvH Foundation (Germany), EPLANET, Marie Sk lodowska-Curie Actions and ERC (European Union), Conseil G´en´eral de Haute-Savoie, Labex ENIGMASS and OCEVU, R´egion Auvergne (France), RFBR (Russia), GVA, XuntaGal and GENCAT (Spain), The Royal Society and Royal Commission for the Exhibition of 1851 (United Kingdom).
Appendices
A
Differential measurements
Differential production cross-section measurements as functions of the pseudorapidities of the muons from the decay of the Z boson were not included in the previous publication that describes the analysis of the √s = 7 TeV data set [9]. They are provided in this appendix in Table 13, along with the related measurements of the differential W to Z boson cross-section ratios in Table 14.
Table 4: Cross-section for (top) W+ and (bottom) W− boson production in bins of muon
pseudorapidity. The first uncertainties are statistical, the second are systematic, the third are due to the knowledge of the LHC beam energy and the fourth are due to the luminosity measurement. The last column lists the final-state radiation correction.
ηµ σW+→µ+ν [ pb ] fW + FSR 2.00 – 2.25 236.5 ± 1.2 ± 3.2 ± 2.4 ± 2.7 1.0188 ± 0.0047 2.25 – 2.50 208.4 ± 0.9 ± 2.2 ± 2.1 ± 2.4 1.0163 ± 0.0028 2.50 – 2.75 182.0 ± 0.8 ± 1.8 ± 1.8 ± 2.1 1.0158 ± 0.0025 2.75 – 3.00 153.3 ± 0.7 ± 1.6 ± 1.5 ± 1.8 1.0148 ± 0.0028 3.00 – 3.25 119.5 ± 0.6 ± 1.3 ± 1.2 ± 1.4 1.0152 ± 0.0032 3.25 – 3.50 84.4 ± 0.5 ± 1.0 ± 0.8 ± 1.0 1.0150 ± 0.0046 3.50 – 4.00 86.4 ± 0.5 ± 1.2 ± 0.9 ± 1.0 1.0175 ± 0.0045 4.00 – 4.50 23.0 ± 0.4 ± 0.7 ± 0.2 ± 0.3 1.0211 ± 0.0087 ηµ σ W−→µ−ν [ pb ] fW − FSR 2.00 – 2.25 134.0 ± 0.9 ± 1.8 ± 1.2 ± 1.6 1.0172 ± 0.0026 2.25 – 2.50 119.8 ± 0.7 ± 1.4 ± 1.0 ± 1.4 1.0155 ± 0.0027 2.50 – 2.75 110.6 ± 0.6 ± 1.2 ± 1.0 ± 1.3 1.0153 ± 0.0028 2.75 – 3.00 102.4 ± 0.6 ± 1.2 ± 0.9 ± 1.2 1.0162 ± 0.0030 3.00 – 3.25 92.5 ± 0.6 ± 1.1 ± 0.8 ± 1.1 1.0160 ± 0.0031 3.25 – 3.50 79.9 ± 0.5 ± 0.9 ± 0.7 ± 0.9 1.0176 ± 0.0033 3.50 – 4.00 119.3 ± 0.6 ± 1.5 ± 1.0 ± 1.4 1.0200 ± 0.0033 4.00 – 4.50 60.0 ± 0.7 ± 1.6 ± 0.5 ± 0.7 1.0243 ± 0.0053
Table 5: Cross-section for Z boson production in bins of boson rapidity. The first uncertainties are statistical, the second are systematic, the third are due to the knowledge of the LHC beam energy and the fourth are due to the luminosity measurement. The last column lists the final-state radiation correction. yZ σZ→µ+µ− [ pb ] fZ FSR 2.000 – 2.125 1.223 ± 0.033 ± 0.055 ± 0.014 ± 0.014 1.0466 ± 0.0395 2.125 – 2.250 3.263 ± 0.051 ± 0.060 ± 0.038 ± 0.038 1.0305 ± 0.0119 2.250 – 2.375 4.983 ± 0.062 ± 0.064 ± 0.057 ± 0.058 1.0277 ± 0.0069 2.375 – 2.500 6.719 ± 0.070 ± 0.072 ± 0.077 ± 0.078 1.0252 ± 0.0061 2.500 – 2.625 8.051 ± 0.076 ± 0.074 ± 0.093 ± 0.094 1.0264 ± 0.0048 2.625 – 2.750 8.967 ± 0.079 ± 0.074 ± 0.103 ± 0.105 1.0257 ± 0.0032 2.750 – 2.875 9.561 ± 0.081 ± 0.076 ± 0.110 ± 0.112 1.0258 ± 0.0038 2.875 – 3.000 9.822 ± 0.082 ± 0.071 ± 0.113 ± 0.115 1.0252 ± 0.0027 3.000 – 3.125 9.721 ± 0.081 ± 0.074 ± 0.112 ± 0.114 1.0282 ± 0.0035 3.125 – 3.250 9.030 ± 0.078 ± 0.071 ± 0.104 ± 0.105 1.0264 ± 0.0030 3.250 – 3.375 7.748 ± 0.072 ± 0.074 ± 0.089 ± 0.090 1.0261 ± 0.0066 3.375 – 3.500 6.059 ± 0.063 ± 0.051 ± 0.070 ± 0.071 1.0248 ± 0.0040 3.500 – 3.625 4.385 ± 0.054 ± 0.041 ± 0.050 ± 0.051 1.0258 ± 0.0060 3.625 – 3.750 2.724 ± 0.042 ± 0.027 ± 0.031 ± 0.032 1.0228 ± 0.0053 3.750 – 3.875 1.584 ± 0.032 ± 0.020 ± 0.018 ± 0.019 1.0180 ± 0.0079 3.875 – 4.000 0.749 ± 0.022 ± 0.012 ± 0.009 ± 0.009 1.0207 ± 0.0100 4.000 – 4.250 0.383 ± 0.016 ± 0.008 ± 0.004 ± 0.004 1.0183 ± 0.0140 4.250 – 4.500 0.011 ± 0.003 ± 0.001 ± 0.000 ± 0.000 1.0177 ± 0.0761
Table 6: Cross-section for Z boson production in bins of boson transverse momentum. The first uncertainties are statistical, the second are systematic, the third are due to the knowledge of the LHC beam energy and the fourth are due to the luminosity measurement. The last column lists the final-state radiation correction.
pT,Z [ GeV/c ] σZ→µ+µ− [ pb ] fZ FSR 0.0 – 2.2 7.903 ± 0.082± 0.130 ± 0.091 ± 0.092 1.0962 ± 0.0045 2.2 – 3.4 7.705 ± 0.080± 0.108 ± 0.089 ± 0.090 1.0788 ± 0.0055 3.4 – 4.6 7.609 ± 0.078± 0.080 ± 0.088 ± 0.089 1.0620 ± 0.0039 4.6 – 5.8 7.073 ± 0.075± 0.078 ± 0.081 ± 0.083 1.0472 ± 0.0035 5.8 – 7.2 7.379 ± 0.078± 0.069 ± 0.085 ± 0.086 1.0290 ± 0.0044 7.2 – 8.7 6.813 ± 0.076± 0.074 ± 0.078 ± 0.080 1.0165 ± 0.0060 8.7 – 10.5 6.751 ± 0.075± 0.064 ± 0.078 ± 0.079 1.0044 ± 0.0037 10.5 – 12.8 7.204 ± 0.078± 0.073 ± 0.083 ± 0.084 0.9953 ± 0.0060 12.8 – 15.4 6.270 ± 0.073± 0.053 ± 0.072 ± 0.073 0.9852 ± 0.0035 15.4 – 19.0 6.534 ± 0.072± 0.064 ± 0.075 ± 0.076 0.9830 ± 0.0042 19.0 – 24.5 6.953 ± 0.071± 0.066 ± 0.080 ± 0.081 0.9853 ± 0.0044 24.5 – 34.0 6.999 ± 0.069± 0.062 ± 0.080 ± 0.082 1.0109 ± 0.0031 34.0 – 63.0 7.602 ± 0.070± 0.072 ± 0.087 ± 0.089 1.0380 ± 0.0034 63.0 – 270.0 2.176 ± 0.037± 0.025 ± 0.025 ± 0.025 1.0604 ± 0.0059
Table 7: Cross-section for Z boson production in bins of boson φ∗η. The first uncertainties are statistical, the second are systematic, the third are due to the knowledge of the LHC beam energy and the fourth are due to the luminosity measurement. The last column lists the final-state radiation correction. φ∗η σZ→µ+µ− [ pb ] fZ FSR 0.00 – 0.01 10.442 ± 0.077 ± 0.118 ± 0.120 ± 0.122 1.0367 ± 0.0028 0.01 – 0.02 9.704 ± 0.076 ± 0.116 ± 0.112 ± 0.113 1.0346 ± 0.0031 0.02 – 0.03 8.510 ± 0.071 ± 0.130 ± 0.098 ± 0.099 1.0323 ± 0.0031 0.03 – 0.05 13.749 ± 0.089 ± 0.151 ± 0.158 ± 0.161 1.0288 ± 0.0024 0.05 – 0.07 10.085 ± 0.076 ± 0.119 ± 0.116 ± 0.118 1.0254 ± 0.0036 0.07 – 0.10 10.662 ± 0.077 ± 0.159 ± 0.123 ± 0.125 1.0211 ± 0.0030 0.10 – 0.15 10.575 ± 0.077 ± 0.133 ± 0.122 ± 0.123 1.0196 ± 0.0029 0.15 – 0.20 6.322 ± 0.059 ± 0.074 ± 0.073 ± 0.074 1.0177 ± 0.0034 0.20 – 0.30 6.681 ± 0.061 ± 0.085 ± 0.077 ± 0.078 1.0188 ± 0.0039 0.30 – 0.40 3.213 ± 0.042 ± 0.064 ± 0.037 ± 0.038 1.0210 ± 0.0064 0.40 – 0.60 2.837 ± 0.040 ± 0.055 ± 0.033 ± 0.033 1.0251 ± 0.0065 0.60 – 0.80 1.030 ± 0.024 ± 0.027 ± 0.012 ± 0.012 1.0258 ± 0.0114 0.80 – 1.20 0.670 ± 0.020 ± 0.030 ± 0.008 ± 0.008 1.0269 ± 0.0110 1.20 – 2.00 0.263 ± 0.013 ± 0.022 ± 0.003 ± 0.003 1.0276 ± 0.0210 2.00 – 4.00 0.094 ± 0.008 ± 0.023 ± 0.001 ± 0.001 1.0345 ± 0.0396
Table 8: Cross-section for Z boson production in bins of muon pseudorapidity. The first uncertainties are statistical, the second are systematic, the third are due to the knowledge of the LHC beam energy and the fourth are due to the luminosity measurement. The last column lists the final-state radiation correction.
ηµ σ Z→µ+µ−(ηµ + ) [ pb ] fZ FSR 2.00 – 2.25 15.28 ± 0.11 ± 0.18 ± 0.18 ± 0.18 1.0293 ± 0.0036 2.25 – 2.50 14.39 ± 0.10 ± 0.13 ± 0.17 ± 0.17 1.0250 ± 0.0027 2.50 – 2.75 13.39 ± 0.10 ± 0.11 ± 0.15 ± 0.16 1.0244 ± 0.0044 2.75 – 3.00 12.37 ± 0.09 ± 0.10 ± 0.14 ± 0.14 1.0240 ± 0.0033 3.00 – 3.25 10.93 ± 0.09 ± 0.09 ± 0.13 ± 0.13 1.0234 ± 0.0037 3.25 – 3.50 9.02 ± 0.08 ± 0.08 ± 0.10 ± 0.11 1.0246 ± 0.0046 3.50 – 4.00 12.94 ± 0.09 ± 0.10 ± 0.15 ± 0.15 1.0269 ± 0.0033 4.00 – 4.50 6.67 ± 0.07 ± 0.07 ± 0.08 ± 0.08 1.0365 ± 0.0038 ηµ σ Z→µ+µ−(ηµ − ) [ pb ] fZ FSR 2.00 – 2.25 14.07 ± 0.10 ± 0.18 ± 0.16 ± 0.16 1.0291 ± 0.0056 2.25 – 2.50 13.68 ± 0.10 ± 0.13 ± 0.16 ± 0.16 1.0254 ± 0.0028 2.50 – 2.75 13.09 ± 0.10 ± 0.10 ± 0.15 ± 0.15 1.0251 ± 0.0028 2.75 – 3.00 12.43 ± 0.09 ± 0.11 ± 0.14 ± 0.15 1.0239 ± 0.0033 3.00 – 3.25 11.01 ± 0.09 ± 0.10 ± 0.13 ± 0.13 1.0227 ± 0.0041 3.25 – 3.50 9.49 ± 0.08 ± 0.08 ± 0.11 ± 0.11 1.0246 ± 0.0042 3.50 – 4.00 13.85 ± 0.10 ± 0.11 ± 0.16 ± 0.16 1.0268 ± 0.0036 4.00 – 4.50 7.35 ± 0.07 ± 0.07 ± 0.09 ± 0.09 1.0353 ± 0.0055
Table 9: (Top) W+ and (bottom) W− to Z cross-section ratios in bins of muon pseudorapidity. The first uncertainties are statistical, the second are systematic, the third are due to the knowledge of the LHC beam energy and the fourth are due to the luminosity measurement.
ηµ+ R W+Z 2.00 – 2.25 15.478 ± 0.134 ± 0.174 ± 0.024 ± 0.001 2.25 – 2.50 14.490 ± 0.119 ± 0.136 ± 0.022 ± 0.001 2.50 – 2.75 13.593 ± 0.112 ± 0.137 ± 0.020 ± 0.001 2.75 – 3.00 12.406 ± 0.108 ± 0.126 ± 0.019 ± 0.001 3.00 – 3.25 10.937 ± 0.102 ± 0.115 ± 0.016 ± 0.001 3.25 – 3.50 9.353 ± 0.097 ± 0.114 ± 0.015 ± 0.001 3.50 – 4.00 6.677 ± 0.063 ± 0.093 ± 0.010 ± 0.001 4.00 – 4.50 3.444 ± 0.072 ± 0.103 ± 0.005 ± 0.000 ηµ− RW−Z 2.00 – 2.25 9.521 ± 0.095 ± 0.117 ± 0.028 ± 0.001 2.25 – 2.50 8.754 ± 0.080 ± 0.090 ± 0.025 ± 0.001 2.50 – 2.75 8.449 ± 0.076 ± 0.086 ± 0.025 ± 0.001 2.75 – 3.00 8.235 ± 0.077 ± 0.089 ± 0.024 ± 0.000 3.00 – 3.25 8.400 ± 0.082 ± 0.096 ± 0.024 ± 0.001 3.25 – 3.50 8.414 ± 0.088 ± 0.096 ± 0.024 ± 0.000 3.50 – 4.00 8.615 ± 0.075 ± 0.107 ± 0.025 ± 0.001 4.00 – 4.50 8.166 ± 0.130 ± 0.215 ± 0.023 ± 0.000
Table 10: W+ to W− cross-section ratio in bins of muon pseudorapidity. The first uncertainties are statistical, the second are systematic and the third are due to the knowledge of the LHC beam energy. ηµ RW± 2.00 – 2.25 1.765 ± 0.015 ± 0.018 ± 0.003 2.25 – 2.50 1.740 ± 0.012 ± 0.018 ± 0.002 2.50 – 2.75 1.645 ± 0.011 ± 0.013 ± 0.002 2.75 – 3.00 1.499 ± 0.011 ± 0.011 ± 0.002 3.00 – 3.25 1.292 ± 0.010 ± 0.010 ± 0.002 3.25 – 3.50 1.057 ± 0.009 ± 0.009 ± 0.002 3.50 – 4.00 0.724 ± 0.006 ± 0.014 ± 0.001 4.00 – 4.50 0.383 ± 0.009 ± 0.016 ± 0.001
Table 11: Lepton charge asymmetry in bins of muon pseudorapidity. The first uncertainties are statistical, the second are systematic and the third are due to the knowledge of the LHC beam energy. ηµ A µ (%) 2.00 – 2.25 27.67 ± 0.39 ± 0.48 ± 0.07 2.25 – 2.50 27.02 ± 0.33 ± 0.47 ± 0.07 2.50 – 2.75 24.39 ± 0.32 ± 0.37 ± 0.07 2.75 – 3.00 19.96 ± 0.35 ± 0.34 ± 0.07 3.00 – 3.25 12.74 ± 0.38 ± 0.37 ± 0.07 3.25 – 3.50 2.75 ± 0.43 ± 0.42 ± 0.07 3.50 – 4.00 −15.99 ± 0.39 ± 0.96 ± 0.07 4.00 – 4.50 −44.63 ± 0.89 ± 1.64 ± 0.06
Table 12: Ratios of (top) W+ and (bottom) W− to Z cross-section ratios at different centre-of-mass energies in bins of muon pseudorapidity. The first uncertainty is statistical and the second is systematic. ηµ+ RR8/7 W +Z 2.00 – 2.25 1.022 ± 0.015 ± 0.016 2.25 – 2.50 0.997 ± 0.014 ± 0.016 2.50 – 2.75 0.993 ± 0.014 ± 0.013 2.75 – 3.00 1.027 ± 0.016 ± 0.013 3.00 – 3.25 0.981 ± 0.017 ± 0.014 3.25 – 3.50 1.085 ± 0.020 ± 0.017 3.50 – 4.00 1.055 ± 0.018 ± 0.016 4.00 – 4.50 1.077 ± 0.041 ± 0.043 ηµ− R8/7 RW −Z 2.00 – 2.25 1.022 ± 0.017 ± 0.018 2.25 – 2.50 0.969 ± 0.015 ± 0.017 2.50 – 2.75 0.977 ± 0.015 ± 0.013 2.75 – 3.00 0.925 ± 0.015 ± 0.017 3.00 – 3.25 0.928 ± 0.016 ± 0.016 3.25 – 3.50 0.906 ± 0.017 ± 0.020 3.50 – 4.00 0.912 ± 0.014 ± 0.014 4.00 – 4.50 0.922 ± 0.026 ± 0.033
Table 13: Cross-section for Z boson production in bins of muon pseudorapidity at√s = 7 TeV. The first uncertainties are statistical, the second are systematic, the third are due to the knowledge of the LHC beam energy and the fourth are due to the luminosity measurement. The last column lists the final-state radiation correction.
ηµ σ Z→µ+µ−(ηµ + ) [ pb ] fZ FSR 2.00 – 2.25 12.69 ± 0.13 ± 0.16 ± 0.16 ± 0.22 1.0290 ± 0.0038 2.25 – 2.50 12.31 ± 0.13 ± 0.13 ± 0.15 ± 0.21 1.0246 ± 0.0031 2.50 – 2.75 11.27 ± 0.12 ± 0.10 ± 0.14 ± 0.19 1.0237 ± 0.0040 2.75 – 3.00 10.16 ± 0.11 ± 0.10 ± 0.13 ± 0.18 1.0242 ± 0.0044 3.00 – 3.25 8.44 ± 0.10 ± 0.08 ± 0.11 ± 0.15 1.0235 ± 0.0033 3.25 – 3.50 7.15 ± 0.10 ± 0.07 ± 0.09 ± 0.12 1.0258 ± 0.0045 3.50 – 4.00 9.48 ± 0.11 ± 0.08 ± 0.12 ± 0.16 1.0286 ± 0.0032 4.00 – 4.50 4.49 ± 0.08 ± 0.05 ± 0.06 ± 0.08 1.0386 ± 0.0044 ηµ σ Z→µ+µ−(ηµ − ) [ pb ] fZ FSR 2.00 – 2.25 11.93 ± 0.13 ± 0.19 ± 0.15 ± 0.21 1.0294 ± 0.0047 2.25 – 2.50 11.61 ± 0.12 ± 0.14 ± 0.15 ± 0.20 1.0251 ± 0.0026 2.50 – 2.75 11.12 ± 0.12 ± 0.12 ± 0.14 ± 0.19 1.0245 ± 0.0030 2.75 – 3.00 9.93 ± 0.11 ± 0.10 ± 0.12 ± 0.17 1.0238 ± 0.0031 3.00 – 3.25 8.91 ± 0.11 ± 0.11 ± 0.11 ± 0.15 1.0236 ± 0.0044 3.25 – 3.50 7.39 ± 0.10 ± 0.08 ± 0.09 ± 0.13 1.0253 ± 0.0048 3.50 – 4.00 10.16 ± 0.11 ± 0.11 ± 0.13 ± 0.18 1.0269 ± 0.0047 4.00 – 4.50 4.95 ± 0.08 ± 0.09 ± 0.06 ± 0.09 1.0376 ± 0.0055
Table 14: (Top) W+ and (bottom) W− to Z cross-section ratios in bins of muon pseudorapidity
at√s = 7 TeV. The first uncertainties are statistical, the second are systematic, the third are due
to the knowledge of the LHC beam energy and the fourth are due to the luminosity measurement. ηµ+ RW+Z 2.00 – 2.25 15.152 ± 0.182 ± 0.231 ± 0.029 ± 0.001 2.25 – 2.50 14.529 ± 0.167 ± 0.230 ± 0.028 ± 0.001 2.50 – 2.75 13.689 ± 0.164 ± 0.176 ± 0.026 ± 0.001 2.75 – 3.00 12.079 ± 0.153 ± 0.153 ± 0.023 ± 0.001 3.00 – 3.25 11.176 ± 0.157 ± 0.151 ± 0.021 ± 0.001 3.25 – 3.50 8.623 ± 0.134 ± 0.132 ± 0.016 ± 0.001 3.50 – 4.00 6.330 ± 0.091 ± 0.076 ± 0.012 ± 0.001 4.00 – 4.50 3.198 ± 0.101 ± 0.093 ± 0.006 ± 0.000 ηµ− R W−Z 2.00 – 2.25 9.314 ± 0.126 ± 0.162 ± 0.032 ± 0.001 2.25 – 2.50 9.030 ± 0.115 ± 0.151 ± 0.031 ± 0.001 2.50 – 2.75 8.647 ± 0.112 ± 0.112 ± 0.029 ± 0.001 2.75 – 3.00 8.907 ± 0.121 ± 0.150 ± 0.030 ± 0.001 3.00 – 3.25 9.054 ± 0.129 ± 0.156 ± 0.031 ± 0.001 3.25 – 3.50 9.285 ± 0.143 ± 0.202 ± 0.032 ± 0.001 3.50 – 4.00 9.443 ± 0.124 ± 0.126 ± 0.032 ± 0.001 4.00 – 4.50 8.858 ± 0.212 ± 0.243 ± 0.030 ± 0.001
T able 15: Correlation co efficien ts b et w een the differen tial W + and W − cross-sections in bins of m uon η . The LHC b eam energy and luminosit y uncertain ties, whic h are fully correlated b et w een cross-section me asur e men ts, are e xclu ded. η µ 2–2.25 2.25–2.5 2.5–2.75 2.75–3 3–3.25 3.25–3.5 3.5–4 4–4.5 2–2.25 1 W + 0.67 1 W − 2.25–2.5 0.20 0.10 1 W + 0.07 0.21 0.54 1 W − 2.5–2.75 0.13 0.24 0.12 0.23 1 W + 0.05 0.18 0.03 0.22 0.64 1 W − 2.75–3 0.06 0.22 0.03 0.28 0.26 0.27 1 W + 0.04 0.21 0.00 0.25 0.25 0.31 0.70 1 W − 3–3.25 0.07 0.22 0.03 0.28 0.25 0.26 0.33 0.30 1 W + 0.06 0.22 0.03 0.28 0.26 0.27 0.32 0.32 0 .68 1 W − 3.25–3.5 0.03 0.23 − 0.01 0.28 0.28 0.27 0.35 0.33 0.34 0.32 1 W + 0.07 0.23 0.04 0.23 0.30 0.29 0.28 0.32 0 .27 0.28 0.63 1 W − 3.5–4 − 0.00 0.26 − 0.06 0.33 0.31 0.32 0.41 0.39 0.40 0.38 0.45 0.36 1 W + 0.14 − 0.06 0.20 − 0.04 − 0.13 − 0.04 − 0.08 − 0.11 − 0.07 − 0.07 − 0.17 − 0.19 − 0.04 1 W − 4–4.5 − 0.07 0.14 − 0.14 0.24 0.14 0.23 0.32 0.29 0.32 0.26 0.35 0.22 0.45 − 0.15 1 W + 0.12 − 0.09 0.17 − 0.11 − 0.18 − 0.14 − 0.17 − 0.19 − 0.15 − 0.18 − 0.23 − 0.24 − 0.31 0.48 0.05 1 W − W + W − W + W − W + W − W + W − W + W − W + W − W + W − W + W −
T able 16: Correlation co efficien ts b et w een the differen tial Z cross-section in bins of yZ . The LHC b eam energy and luminosit y uncertain ties, whic h are fully corr e lated b et w een c ros s-section measuremen ts, are excluded. yZ 2–2.125 2.125–2.25 2.25 –2.375 2.375–2.5 2.5–2.625 2.625–2.75 2.75–2 .8 75 2.875–3 3–3.125 3.125–3.25 3.25–3.375 3.375–3.5 3.5–3.625 3.625–3.75 3.75–3.875 3.87 5–4 4–4.25 4.25–4.5 2–2.125 1 2.125–2.25 0.19 1 2.25–2.375 0.17 0 .27 1 2.375–2.5 0.16 0 .26 0.28 1 2.5–2.625 0.16 0 .25 0.28 0.29 1 2.625–2.75 0.15 0 .24 0.27 0.29 0 .30 1 2.75–2.875 0.14 0 .23 0.26 0.28 0 .29 0 .30 1 2.875–3 0.14 0 .21 0.25 0.27 0 .29 0 .30 0.30 1 3–3.125 0.13 0 .20 0.23 0.25 0 .27 0 .28 0.29 0.29 1 3.125–3.25 0.11 0 .17 0.20 0.23 0 .25 0 .26 0.27 0.28 0.27 1 3.25–3.375 0.09 0 .14 0.16 0.18 0 .20 0 .22 0.22 0.23 0.23 0.23 1 3.375–3.5 0.08 0 .12 0.15 0.17 0 .19 0 .20 0.21 0.22 0.22 0.22 0.20 1 3.5–3.625 0.07 0 .10 0.12 0.14 0 .16 0 .17 0.18 0.19 0.19 0.20 0.18 0.19 1 3.625–3.75 0.06 0 .08 0.10 0.11 0 .13 0 .14 0.15 0.16 0.16 0.17 0.16 0.16 0.15 1 3.75–3.875 0.05 0 .07 0.08 0.09 0 .10 0 .11 0.11 0.12 0.13 0.13 0.12 0.13 0.12 0.11 1 3.875–4 0.03 0 .05 0.06 0.06 0 .07 0 .08 0.08 0.09 0.09 0.10 0.09 0.10 0.09 0.08 0.07 1 4–4.25 0.03 0 .04 0.04 0.05 0 .05 0 .06 0.06 0.06 0.07 0.07 0.07 0.08 0.07 0.07 0.06 0.05 1 4.25–4.5 0.01 0 .01 0.01 0.01 0 .01 0 .01 0.01 0.01 0.01 0.01 0.01 0.02 0.02 0.01 0.01 0.01 0.01 1
T able 17: Correlation co efficien ts b et w een the differen tial Z cross-section in bins of pT ,Z . Th e LHC b eam energy and luminosit y uncertain ties, whic h are fully corr e lated b et w een c ros s-section measuremen ts, are excluded. pT ,Z [GeV/c] 0.0–2.2 2.2–3.4 3.4–4.6 4.6–5.8 5 .8 –7.2 7.2–8.7 8.7–10.5 10.5–12.8 12.8–15.4 15.4–1 9 19–24.5 24.5–34 34–63 63–270 0.0–2.2 1 2.2–3.4 0.06 1 3.4–4.6 0.08 0.1 6 1 4.6–5.8 0.13 0.0 9 0.20 1 5.8–7.2 0.15 0.1 6 0.12 0.19 1 7.2–8.7 0.14 0.1 6 0.18 0.11 0.17 1 8.7–10.5 0.14 0.1 6 0.20 0.19 0.14 0.15 1 10.5–12.8 0.14 0.1 6 0.19 0.19 0.21 0.14 0.12 1 12.8–15.4 0.15 0.1 7 0.20 0.19 0.22 0.20 0.17 0.11 1 15.4–19 0.14 0.1 6 0.20 0.19 0.21 0.19 0.21 0.18 0.11 1 19–24.5 0.15 0.1 7 0.21 0.20 0.22 0.20 0.21 0.21 0.21 0.13 1 24.5–34 0.16 0.1 8 0.22 0.21 0.23 0.21 0.22 0.22 0.23 0.22 0.17 1 34–63 0.16 0.1 8 0.22 0.21 0.23 0.21 0.22 0.22 0.23 0.22 0.23 0.21 1 63–270 0.11 0.1 2 0.15 0.14 0.16 0.15 0.15 0.15 0.16 0.15 0.16 0.17 0.15 1
T able 18: Correlation c o efficien ts b et w een th e differen tial Z cross-section in bins of φ ∗ η. The LHC b eam energy and luminosit y uncertain ties, whic h are fully corr e lated b et w een c ros s-section measuremen ts, are excluded. φ ∗ η 0.00–0.01 0.01–0.02 0.02– 0.03 0.03–0.05 0.05–0.07 0.07–0.10 0.10–0.15 0 .1 5–0.20 0.20–0.30 0.30–0.40 0.40–0.60 0.60–0.80 0.80–1.20 1.20–2.00 2.00–4.00 0.00–0.01 1 0.01–0.02 0.50 1 0.02–0.03 0.42 0.39 1 0.03–0.05 0.57 0.55 0.44 1 0.05–0.07 0.52 0.50 0.41 0.55 1 0.07–0.10 0.44 0.42 0.34 0.47 0.42 1 0.10–0.15 0.50 0.48 0.40 0.54 0.49 0.41 1 0.15–0.20 0.49 0.47 0.38 0.52 0.48 0.40 0.46 1 0.20–0.30 0.47 0.45 0.37 0.50 0.45 0.39 0.44 0.43 1 0.30–0.40 0.31 0.30 0.24 0.33 0.30 0.26 0.29 0.29 0.27 1 0.40–0.60 0.31 0.29 0.24 0.33 0.30 0.25 0.29 0.28 0.27 0.18 1 0.60–0.80 0.21 0.20 0.16 0.23 0.20 0.17 0.20 0.19 0.19 0.12 0.12 1 0.80–1.20 0.13 0.13 0.10 0.14 0.13 0.11 0.13 0.12 0.12 0.08 0.08 0.05 1 1.20–2.00 0.07 0.07 0.06 0.08 0.07 0.06 0.07 0.07 0.06 0.04 0.04 0.03 0.02 1 2.00–4.00 0.02 0.02 0.02 0.02 0.02 0.02 0.02 0.02 0.02 0.01 0.01 0.01 0.01 0.00 1
T able 19: Correlation co efficien ts b et w een differen tial W and Z cross-sections in bins of m uon η and yZ , resp ectiv ely . The LHC b eam energy and luminosit y uncertain ties, whic h are fully correlated b et w een cross-section measuremen ts, are excluded. yZ 2–2.125 2.125–2.25 2 .2 5–2.375 2.375–2.5 2.5–2.625 2.625–2.75 2.75– 2.875 2.875–3 3–3.125 3.125–3.25 3.25–3.37 5 3.375–3.5 3.5–3.625 3.625–3.75 3.75–3.875 3 .8 75–4 4–4.25 4.25–4.5 η µ 2–2.25 0.23 0.30 0.28 0.27 0.26 0.25 0.24 0.23 0.21 0.18 0.15 0.13 0.11 0.10 0.07 0.05 0.04 0.0 1 W + 0.21 0.28 0.26 0.25 0.24 0.24 0.22 0.21 0.20 0.17 0.14 0.12 0.11 0.09 0.07 0.05 0.04 0.0 1 W − 2.25–2.5 0.05 0.15 0.21 0.20 0.20 0.20 0.20 0.19 0.18 0.16 0.14 0.12 0.10 0.08 0.06 0.04 0.03 0.0 1 W + 0.04 0.14 0.19 0.18 0.18 0.18 0.18 0.17 0.16 0.15 0.12 0.11 0.09 0.07 0.05 0.04 0.03 0.0 0 W − 2.5–2.75 0.04 0.07 0.12 0.15 0.16 0.17 0.17 0.17 0.16 0.15 0.13 0.13 0.11 0.08 0.06 0.05 0.03 0.0 1 W + 0.04 0.07 0.11 0.14 0.15 0.15 0.15 0.15 0.15 0.14 0.12 0.12 0.10 0.08 0.06 0.04 0.03 0.0 1 W − 2.75–3 0.05 0.08 0.10 0.13 0.16 0.17 0.17 0.17 0.16 0.16 0.14 0.13 0.12 0.09 0.07 0.05 0.03 0.0 1 W + 0.05 0.07 0.09 0.12 0.14 0.15 0.15 0.16 0.15 0.14 0.12 0.12 0.11 0.08 0.06 0.04 0.03 0.0 1 W − 3–3.25 0.06 0.08 0.10 0.11 0.14 0.16 0.17 0.17 0.16 0.16 0.14 0.14 0.12 0.10 0.07 0.05 0.03 0.0 1 W + 0.05 0.08 0.09 0.10 0.13 0.15 0.15 0.16 0.15 0.15 0.13 0.13 0.11 0.09 0.07 0.05 0.03 0.0 1 W − 3.25–3.5 0.04 0.06 0.07 0.09 0.10 0.11 0.12 0.13 0.13 0.12 0.11 0.11 0.09 0.08 0.06 0.04 0.03 0.0 0 W + 0.04 0.06 0.08 0.09 0.10 0.12 0.13 0.13 0.13 0.13 0.11 0.11 0.10 0.08 0.06 0.04 0.03 0.0 0 W − 3.5–4 0.04 0.06 0.07 0.08 0.09 0.10 0.11 0.12 0.12 0.12 0.11 0.11 0.10 0.09 0.07 0.05 0.04 0.0 0 W + 0.04 0.06 0.08 0.09 0.10 0.11 0.12 0.13 0.14 0.14 0.12 0.12 0.11 0.10 0.08 0.06 0.04 0.0 1 W − 4–4.5 0.02 0.03 0.04 0.04 0.04 0.04 0.05 0.05 0.06 0.06 0.06 0.07 0.06 0.06 0.05 0.04 0.04 0.0 1 W + 0.03 0.04 0.04 0.05 0.05 0.06 0.06 0.06 0.07 0.07 0.07 0.08 0.08 0.07 0.06 0.05 0.04 0.0 1 W −
Table 20: Correlation coefficients between the differential Z cross-sections in bins of (top) ηµ+ and
(bottom) ηµ−. The LHC beam energy and luminosity uncertainties, which are fully correlated
between cross-section measurements, are excluded. ηµ+ 2.00–2.25 2.25–2.50 2.50–2.75 2.75–3.00 3.00–3.25 3.25–3.50 3.50–4.00 4.00–4.50 2.00–2.25 1 2.25–2.50 0.31 1 2.50–2.75 0.30 0.27 1 2.75–3.00 0.31 0.28 0.26 1 3.00–3.25 0.32 0.28 0.26 0.27 1 3.25–3.50 0.27 0.25 0.23 0.23 0.23 1 3.50–4.00 0.33 0.30 0.28 0.28 0.28 0.25 1 4.00–4.50 0.28 0.25 0.23 0.24 0.23 0.20 0.23 1 ηµ− 2.00–2.25 2.25–2.50 2.50–2.75 2.75–3.00 3.00–3.25 3.25–3.50 3.50–4.00 4.00–4.50 2.00–2.25 1 2.25–2.50 0.29 1 2.50–2.75 0.30 0.29 1 2.75–3.00 0.30 0.28 0.28 1 3.00–3.25 0.30 0.27 0.27 0.27 1 3.25–3.50 0.27 0.25 0.25 0.24 0.24 1 3.50–4.00 0.31 0.29 0.29 0.28 0.28 0.25 1 4.00–4.50 0.28 0.25 0.25 0.24 0.24 0.21 0.24 1