An expression atlas of variant ionotropic glutamate
receptors identi
fies a molecular basis of
carbonation sensing
Juan Antonio Sánchez-Alcañiz
1
, Ana Florencia Silbering
1
, Vincent Croset
1,5
, Giovanna Zappia
1
,
Anantha Krishna Sivasubramaniam
1
, Liliane Abuin
1
, Saumya Yashmohini Sahai
2
, Daniel Münch
3
, Kathrin Steck
3
,
Thomas O. Auer
1
, Steeve Cruchet
1
, G. Larisa Neagu-Maier
4
, Simon G. Sprecher
4
, Carlos Ribeiro
3
,
Nilay Yapici
2
& Richard Benton
1
Through analysis of the Drosophila ionotropic receptors (IRs), a family of variant ionotropic
glutamate receptors, we reveal that most IRs are expressed in peripheral neuron populations
in diverse gustatory organs in larvae and adults. We characterise IR56d, which de
fines two
anatomically-distinct neuron classes in the proboscis: one responds to carbonated solutions
and fatty acids while the other represents a subset of sugar- and fatty acid-sensing cells.
Mutational analysis indicates that IR56d, together with the broadly-expressed co-receptors
IR25a and IR76b, is essential for physiological responses to carbonation and fatty acids, but
not sugars. We further demonstrate that carbonation and fatty acids both promote
IR56d-dependent attraction of
flies, but through different behavioural outputs. Our work provides a
toolkit for investigating taste functions of IRs, defines a subset of these receptors required for
carbonation sensing, and illustrates how the gustatory system uses combinatorial expression
of sensory molecules in distinct neurons to coordinate behaviour.
DOI: 10.1038/s41467-018-06453-1
OPEN
1Center for Integrative Genomics, Faculty of Biology and Medicine, University of Lausanne, Génopode Building, Lausanne CH-1015, Switzerland.2Department
of Neurobiology and Behavior, Cornell University, W153 Mudd Hall, Ithaca, NY 14853, USA.3Champalimaud Centre for the Unknown, Lisbon 1400-038, Portugal.4Department of Biology, Institute of Zoology, University of Fribourg, Chemin du Musée 10, Fribourg CH-1700, Switzerland.5Present address: Centre
for Neural Circuits and Behaviour, University of Oxford, Tinsley Building, Mansfield Road, Oxford OX1 3SR, United Kingdom. These authors contributed equally: Ana Florencia Silbering, Vincent Croset, Giovanna Zappia. Correspondence and requests for materials should be addressed to
R.B. (email:[email protected])
123456789
C
lassic models of gustatory perception in mammals
high-light the existence of a small number of taste classes
sig-nalling nutritive content (e.g. sugars and amino acids) or
toxicity (e.g. bitter) that determine—through activation of
hard-wired neural circuits—behavioural acceptance or rejection of
food
1,2. Different classes of tastants are recognised by discrete
sensory channels that express distinct, and relatively small,
receptor families. For example, detection of all sugars depends
upon a single heterodimeric G protein-coupled receptor (GPCR)
complex, T1R2/T1R3, while bitter cells—which detect an
enor-mous diversity of noxious compounds—co-express a few dozen
GPCRs of the T2R family
1,2.
Such models have been pervasive in interpreting how gustatory
perception occurs in other animals, including insects, where
analogous segregated sensory pathways for sweet and bitter
compounds have been defined
3–6. However, in contrast to
mammals, where taste—mediated by lingual taste buds—informs
only feeding decisions, insect gustation occurs in multiple sensory
appendages, including the proboscis, legs, wings and sexual
organs, and controls diverse behaviours, such as foraging, feeding,
sexual/social recognition and oviposition
3–6. In addition to
ste-reotyped appetitive and aversive feeding responses to sweet and
bitter compounds, respectively, insects display behavioural
reac-tions to many other types of chemicals, including salt
7, water
8,
carbonation (i.e. aqueous CO
2)
9, organic and inorganic acids
10,11,
and pheromonal cuticular hydrocarbons
12.
The wide-ranging roles of the insect gustatory system are
reflected in the molecular receptors that mediate peripheral
sensory detection. The best-characterised taste receptor repertoire
is the Gustatory Receptor (GR) family, which are a divergent
set of presumed heptahelical ion channels that function in
the detection of sugars, bitter compounds and certain sex
pheromones
3,13. A second large repertoire of receptors implicated
in insect gustation is the Ionotropic Receptor (IR) family, which
are ligand-gated ion channels that have derived from synaptic
ionotropic glutamate receptors (iGluRs)
14–17. Unlike iGluRs, IRs
display enormous diversification both in the size of the repertoire
across insects (ranging from tens to several hundreds
15,16,18),
and in their protein sequences (with as little as 10% amino acid
identity between pairs of receptors). IRs are best-characterised
in the vinegar
fly, Drosophila melanogaster, which possesses 60
intact Ir genes. Of these, the most thoroughly understood are the
17 receptors expressed in the adult antenna. Thirteen of these are
expressed in discrete populations of sensory neurons, and
func-tion as olfactory receptors for volatile acids, aldehydes and
amines
16,19,20or in humidity detection
21–24. The remaining four
(IR8a, IR25a, IR76b and IR93a) are expressed in multiple, distinct
neuron populations and function, in various combinations, as
co-receptors with the selectively-expressed tuning IRs
21,22,25.
By contrast, little is known about the sensory functions of the
remaining, large majority of non-antennal IRs. Previous analyses
described the expression of transgenic reporters for subsets of
these receptors in small groups of gustatory sensory neurons
(GSNs) in several different contact chemosensory structures
15,26–28.
While these observations strongly implicate these genes as having
gustatory functions, the evidence linking specific taste ligands to
particular receptors, neurons and behaviours remains sparse. For
example, IR52c and IR52d are expressed in sexually-dimorphic
populations of leg neurons and implicated in male courtship
behaviours
26, although their ligands are unknown. Reporters for
IR60b, IR94f and IR94h are co-expressed in pharyngeal GSNs
that respond to sucrose, which may limit overfeeding
29or
monitor the state of externally digested food
30. IR62a is essential
for behavioural avoidance of high Ca
2+concentrations, but
the precise neuronal expression of this receptor is unclear
31.
As in the olfactory system, these selectively-expressed IRs are
likely to function with the IR25a and/or IR76b co-receptors,
which are broadly-expressed in contact chemosensory organs,
and required for detection of multiple types of tastants, including
polyamines
32, inorganic, carboxylic and amino acids
28,33–35, and
Ca
2+31.
Here we describe a set of transgenic reporters for the entire Ir
repertoire. We use these to survey the expression of this receptor
family in both larval and adult stages. Using this molecular map,
we identify IR56d as a selectively-expressed receptor that acts
with IR25a and IR76b to mediate physiological and attractive
behavioural responses to carbonation, a previously orphan taste
class
9. Furthermore, we extend recent studies
33,36,37to show that
IR56d is also required in sugar-sensing GR neurons to mediate
distinct behavioural responses to fatty acids.
Results
A toolkit of transgenic reporters for IRs. We generated
trans-genic reporters for all non-antennal IRs, comprising 5’ genomic
regions of individual Ir loci placed upstream of Gal4 (Methods
and Supplementary Table 1). Although the location of relevant
gene regulatory sequences is unknown, this strategy has yielded
faithful reporters of endogenous expression patterns for
essen-tially all antennal Irs
14,20,21,38,39. These constructs were integrated
into identical sites in the genome to avoid positional effects on
transgene expression. Such reporters of receptor expression
pro-vide greater sensitivity and spatial resolution than is permitted
by RNA
fluorescent in situ hybridization (FISH), which is
inadequate to reliably detect Ir transcripts outside the antenna
14.
Moreover, when used to drive the membrane-targeted mCD8:
GFP effector, they allow tracing of the innervation of labelled
neurons in the brain and ventral nerve cord.
IR neuronal expression and projections in larvae and adults.
We
first analysed Ir-Gal4 driven mCD8:GFP expression in third
instar larvae (Figs.
1,
2
and Supplementary Fig. 1). In this
ana-lysis, we also included Ir-Gal4 lines that are expressed in the
adult antennae
20, and incorporated our previous observations on
a small subset of the non-antennal IR reporters
15,28. The larva
contains a bilaterally-symmetric olfactory organ (dorsal organ)
and several distinct gustatory organs located on the surface of the
head and the internal lining of the pharynx (Figs.
1,
2)
40. As
described previously
27,28, the drivers for the co-receptors IR25a
and IR76b (but not IR8a) are broadly expressed in all of these
chemosensory organs (Figs.
1,
2). Expression of Gal4 drivers for
only four other antennal IRs was detected in the dorsal organ:
IR21a and IR93a, which act (with IR25a) in cool
temperature-sensing
21,41, IR68a, which functions (with IR25a and IR93a)
in moist air sensing
22,24and IR92a, which mediates olfactory
sensitivity to ammonia
14,42. These observations suggest that the
larval dorsal organ, like the adult antenna, has olfactory,
ther-mosensory and hygrosensory roles.
Most reporters (27/44) of the remaining non-antennal IR
repertoire are detected in bilaterally-symmetric populations of
∼1–3 neurons in one or more larval gustatory organs, including
head sensory neurons in the terminal and ventral organs, and
internal neurons in the dorsal, ventral and posterior pharyngeal
sense organs (Figs
1
and
2). Commensurate with these different
peripheral expression patterns, the labelled neurons display
diverse projection patterns in the primary gustatory centre,
the subesophageal zone (SEZ) (Supplementary Fig. 1). Several
reporters, for IR7d, IR7g, IR10a, IR68b and IR85a, are also
detected in neurons in each segment of the abdomen, which
project to the ventral nerve cord (VNC) (Fig.
1
and
Supplemen-tary Fig. 1).
In adults, analysis of the new Ir-Gal4 drivers did not identify
any additional antennal-expressed IRs (Fig.
1). However, 21
reporters were detected within one or more populations of
sensory neurons in external taste organs, including the taste
bristles that project from the surface of the labellum, the labellar
taste pegs, and the pharyngeal taste organs (Fig.
1
and Fig.
3).
Furthermore, from examination of the central projections of these
neurons to the SEZ and VNC, we surmised their expression in
a variety of other taste organs, including the legs, wings, as
well as neurons that may originate in the abdomen (Fig.
1
and
Supplementary Fig. 2). We noted sexually-dimorphic projection
patterns in only two reporters: Ir52c-Gal4 (similar to that
previously described
26) and Ir94e-Gal4 (Supplementary Fig. 2);
the latter driver also displays expression in a few soma within the
SEZ (Supplementary Fig. 2).
Relating receptor phylogeny, expression and life stage. We
combined these results with information on additional sites of
expression revealed by a distinct set of reporters for a subset of
IRs (the IR20a clade
26, which were built using 5’ genomic regions
of slightly different lengths as well as 3’ sequences) to produce a
global picture of Ir expression (Fig.
1). These data were organised
by IR phylogeny, to examine the relationship between receptor
protein sequences and spatiotemporal expression patterns. For
the 44 non-antennal IRs, 32 reporters were expressed in larvae
and 27 in adults, of which 17 were common to these life stages.
Stage-specific receptors were found throughout the phylogeny
(Fig.
1), rather than being confined to a single clade. Of the
larval-specific IRs, nothing is currently known about their function; the
adult-specific repertoire includes the Ir52a-d clade, some
mem-bers of which control male mating behaviours
26.
In both life stages, drivers for some IRs that are closely-related
in sequence (and often—but not always—encoded by
tandemly-arrayed genes) are expressed in the same contact chemosensory
organ (e.g. IR48b, IR48c, IR60e, IR67b and IR67c). This
observation suggests that these more recently duplicated receptor
genes retain similar cis-regulatory elements. However, this
relationship is not strictly-held, as reporters for other,
recently-diverged receptors can have quite different expression patterns
(e.g. IR10a and IR100a).
IR56d is expressed in labellar taste peg and bristle neurons.
To analyse the gustatory function of the non-antennal IRs, we
focussed on IR56d, due to its unique expression: Ir56d-Gal4 is the
only reporter—apart from the broadly-expressed Ir25a-Gal4 and
Ir76b-Gal4—detected in neurons housed in the taste pegs, a class
of short sensory hairs that lie between cuticular grooves
(pseu-dotracheae) on the inner medial surface of the labellum (Fig.
4a, b).
The driver is also expressed in neurons innervating taste bristles,
which project from the external surface of the labellum (Fig.
4a,
b). As we were unable to validate the expression of the Ir56d-Gal4
transgene by RNA FISH, we used CRISPR/Cas9 genome editing
to replace the endogenous Ir56d locus with Gal4 to generate an
independent driver line (Ir56d
Gal4) in which all relevant genomic
regulatory regions should be present (Supplementary Fig. 3a).
When combined with UAS-mCD8:GFP, Ir56d
Gal4displayed a
highly similar expression pattern to the Ir56d-Gal4 transgene
Adult (combined)
Larva (combined)
Antenna
Labellar taste bristles
Labellar taste pegs
Labral sense organ
Ventral cibarial sense organ
Dorsal cibarial sense organ
Legs Wings/halteres Abdomen Dorsal organ Terminal organ Ventral organ
Dorsal pharyngeal (sense) organ
Ventral pharyngeal sense organ
Posterior pharyngeal sense organ
Abdomen IR25a IR8a IR84a IR64a IR75d IR31a IR75a IR75c IR75b IR93a IR76b IR68a IR40a IR21a IR92a IR41a IR76a IR7d IR7a IR11a IR7b IR7c IR7e IR7g IR7f IR60a IR87a IR100a IR10a IR68b IR85a IR56c IR51b IR56d IR56a IR62a IR56b IR48b IR48c IR60e IR67b IR67c IR67a IR47a IR94a IR94b IR94c IR54a IR94e IR94d IR52d IR52c IR52a IR52b IR60d IR60b IR60c IR94f IR94g IR20a IR94h Adult
Larva Fig. 1 Ir-Gal4 expression patterns and IR phylogeny. Summary of the expression (indicated by dark blue shading) of Gal4 drivers for the entire D. melanogaster IR repertoire in peripheral chemosensory organs in third instar larvae and adultflies (see also Figs2and3). Some lines, in particular antennal-expressed drivers, were previously described15,20–22,25,28,39,
41,74,75. Light blue shading indicates additional expression reported for
independently-generated Ir-Gal4 drivers26,27. We did not distinguish expression in the dorsal pharyngeal organ and dorsal pharyngeal sense organ. The tree on the left shows a cladogram representing the
phylogenetic relationships between D. melanogaster IRs. Protein sequences were aligned with MUSCLE, and the tree was made with RaxML under the WAG model of substitution, with 1000 bootstrap replicates. The columns on the right highlight drivers exhibiting common or stage-specific expression in larvae and adults
(Supplementary Fig. 3b), indicating that the original promoter
reporter faithfully recapitulates endogenous gene expression.
To characterise the identity of the IR56d neurons, we
combined the Ir56d-Gal4 driver (or an equivalent Ir56d-LexA
transgene; see Methods) with reporters for other populations of
labellar neurons. We
first confirmed that IR56d neurons express
IR25a and IR76b (Fig.
4c), suggesting that IR56d may function
with one or both of these co-receptors. Morphological studies
have shown that taste pegs contain one presumed
mechan-osensory and one chemmechan-osensory neuron
43. The mechanosensory
neuron can be visualised with a promoter reporter for the
NOMPC mechanoreceptor (NompC-LexA)
44,45. We observed
that NompC-LexA-labelled neurons paired, but did not overlap,
with Ir56d-Gal4-positive taste peg neurons (Fig.
4d). By contrast,
Ir68a Ir21a Ir92a Ir93a Ir100a Ir92a Ir94g Ir94e Ir7a Ir7b Ir7e Ir94h Ir56c Ir60c Ir7d Ir7g Ir67a Ir100a Ir60d Ir48bIr48c Ir51b Ir60b Ir60c
Ir7a Ir7f Ir7g Ir11a
Ir67b
Ir60e Ir67c Ir92a
Ir94b Ir94g Ir94a Ir7g Ir7b IR25a Ir-Gal4> UAS-GFP Dorsal organ Terminal organ Posterior pharyngeal sense organ Ventral pharyngeal sense organ Dorsal pharyngeal (sense) organ Ventral organ VO + TO
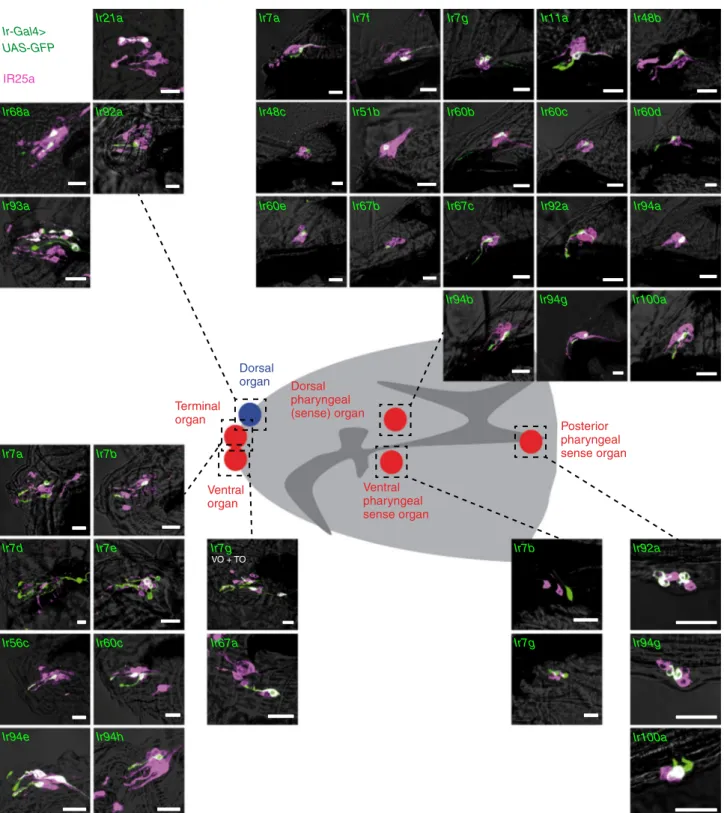
Fig. 2 Expression of Ir-Gal4 drivers in the peripheral nervous system of larval Drosophila. Immunofluorescence with anti-GFP (green) and anti-IR25a (magenta), overlaid on bright-field images, on whole-mount tissue of third instar larvae, revealing the expression of Ir-Gal4 lines in different chemosensory organs (as schematised in the cartoon of the larval head in the centre). Ir7g-Gal4 is expressed in both terminal organ (TO) and ventral organ (VO) neurons; the VO neuron is indicated with an arrow. Images for Ir7b, Ir7e, Ir7g, Ir56c, Ir60c and Ir94e drivers are adapted from28. Genotypes are of the form:
Ir56d-Gal4-expressing cells in the taste pegs co-localised with
those labelled by the E409-Gal4 enhancer trap, which labels at
least a subset of the peg chemosensory neurons
9(Fig.
4e). Taste
bristles house two to four gustatory neurons, including those
tuned to sweet and bitter stimuli, labelled by reporters for Gr64f
and Gr66a, respectively
3,6. Ir56d-Gal4 taste bristle neurons were
completely distinct from Gr66a-positive cells, but overlapped
with a subset of the Gr64f-expressing neurons (Fig.
4f, g).
Consistent with the expression in pegs and bristles, Ir56d-Gal4
neurons project to two distinct regions of the SEZ: the anterior
maxillary sensory zone 1 (AMS1), and the posterior maxillary
sensory zone 4 (PMS4) (Fig.
4h)
46. Co-labelling of these neurons
with the Gr64f reporter demonstrated that the taste bristle
subpopulation innervates PMS4, indicating that the taste peg
neurons project to AMS1 (Fig.
4h), consistent with previous
observations
9,46.
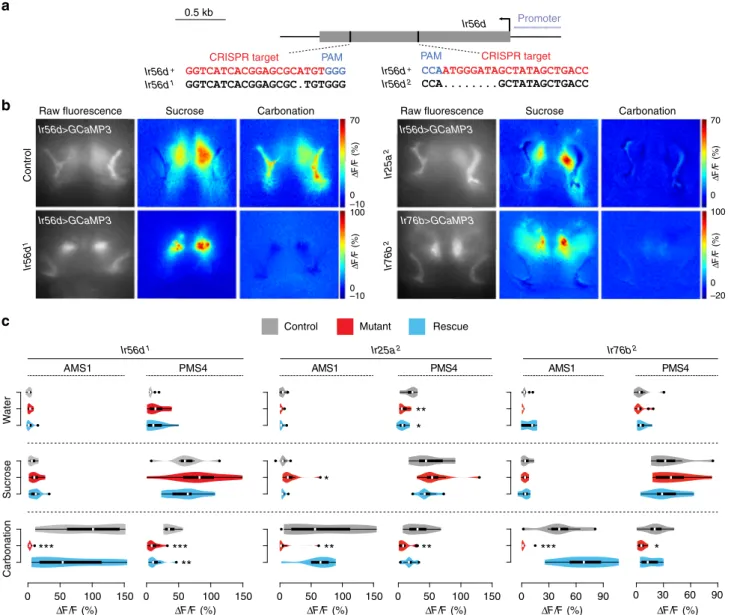
IR56d taste peg neurons are gustatory carbonation sensors. To
determine the physiological specificity of IR56d neurons, we
expressed the
fluorescent calcium indicator GCaMP3 under the
control of Ir56d-Gal4 (Fig.
5a), and measured changes in
fluor-escence in their axon termini in the SEZ upon presentation to the
proboscis of a panel of diverse taste stimuli, including sugars,
bitter compounds, amino and organic acids, high and low NaCl
concentrations, carbonated solutions and buffers of different pH
(Fig.
5b, c). We separately quantified GCaMP3 fluorescence
changes in the AMS1 and PMS4 projections, reflecting activity of
taste peg and taste bristle subpopulations, respectively.
AMS1-innervating neurons responded strongly to carbonated solutions
(Fig.
5c), but not to other tastants in this panel. These data—
together with our co-expression analysis (Fig.
4e)—identify the
Ir56d taste peg neurons as the carbonation-sensing cells that were
previously recognised by their expression of the E409-Gal4
enhancer trap
9.
PMS4-innervating neurons displayed a broader response
profile, showing the largest GCaMP3 fluorescence changes upon
stimulation with sucrose and other sugars, consistent with these
neurons representing a subset of the Gr64f-expressing
sweet-sensing neurons housed in taste bristles (Fig.
4g). We also
detected weaker responses to glycerol, acetic acid, and, somewhat
variably, to carbonated solutions (Fig.
5c). These observations
Ir20aIr10a Ir56a
Ir60c Ir60d Ir67c
Ir94a Ir94e Ir11a Ir20a Ir56a Ir94a Ir94b Ir20a Ir100a Ir7c Ir7a Ir11a
Ir56a Ir56d Ir60c
Ir60d Ir94b Ir94e
Ir-Gal4> UAS-GFP
Dorsal cibarial sense organ
Ventral cibarial sense organ Labral sense organ
Labellum
Ir10a
Ir7a Ir100a
IR25a
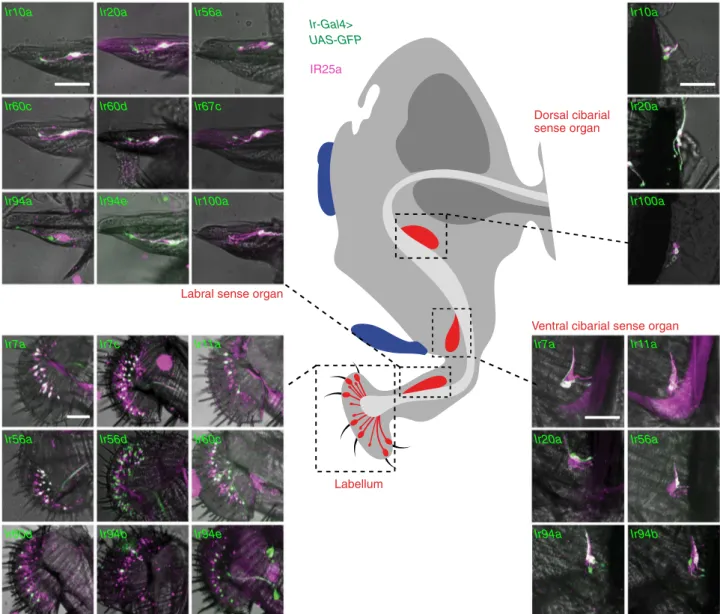
Fig. 3 Expression of Ir-Gal4 drivers in the proboscis of adult Drosophila. Immunofluorescence with anti-GFP (green) and anti-IR25a (magenta), overlaid on bright-field images, on whole-mount proboscides revealing the expression of Ir-Gal4 lines in different adult gustatory organs (as schematised in the cartoon in the centre). Genotypes are of the form: w;UAS-mCD8:GFP;IrX-Gal4. Scale bars: 50μm
indicate that Ir56d subpopulations are both anatomically and
physiologically distinct.
Ir56d-Gal4 is additionally expressed in leg neurons (Fig.
1
and
Supplementary Fig. 2); consistent with previous observations
33,
these cells are also labelled with a Gr64f reporter (Supplementary
Fig. 4a). By calcium imaging in leg tarsi, we found these cells
respond to sucrose but not carbonated solutions (Supplementary
Fig. 4b-c). These results suggest that the legs contain only one
type of IR56d neuron, which is equivalent to that housed in
labellar taste bristles.
IR56d, IR25a and IR76b are required for carbonation sensing.
To address the contribution of IR56d to the sensory responses of
the neurons in which it is expressed, we used CRISPR/Cas9
genome editing to generate two Ir56d mutant alleles; these
con-tain frame-shift generating deletions predicted to truncate the
protein within the presumed ligand-binding domain (Ir56d
1) or
before the ion channel domain (Ir56d
2) (Fig.
6a). We performed
calcium imaging in IR56d neurons in Ir56d mutant
flies using
sucrose and carbonation stimuli, which were the strongest
ago-nists for the taste bristle (PMS4) and taste peg (AMS1)
sub-populations, respectively (Fig.
5c). While responses of the
mutants to sucrose were unaffected compared to control animals,
responses to carbonation were abolished in Ir56d mutants
(Fig.
6b, c). The defect in sensitivity to carbonation was restored
upon selective expression of a wild-type Ir56d cDNA in these
neurons (Fig.
6c).
We next tested the contribution of the two other IRs expressed
in IR56d neurons, IR25a and IR76b. Mutations in each of these
genes produced phenotypes that were very similar to those of
Ir56d mutants: sucrose responses in the PMS4 were unaffected,
while responses to carbonation were completely lost (Fig.
6b, c).
Sensitivity to carbonation could be rescued by expression of
wild-type cDNA transgenes in the corresponding mutant background
(Fig.
6b, c). Together these data suggest that the carbonation
sensor comprises, at least in part, a complex of IR56d with the
co-receptors IR25a and IR76b. The persistent sucrose responses in
a
Taste pegs Taste bristles
b
g
NompC-LexA>LexAop-GFP Ir56d-Gal4>UAS-RFPd
Merge Ir56d-Gal4>UAS-RFP E409-Gal4>UAS-Tomato Ir56d-LexA>LexAop-GFP Mergee
h
Taste pegs Taste bristlesIr56d-LexA>LexAop-GFP IR25a Ir76b-Gal4>UAS-RFP Merge
c
Ir56d-Gal4>UAS-RFP Gr64f-LexA>LexAop-GFP Merge
f
Gr64f-LexA>LexAop-GFP
Ir56d-Gal4>UAS-RFP
Pseudotracheae
Taste pegs: AMS1 Taste bristles: PMS4
Ir56d-Gal4>UAS-RFP Gr66a-LexA>LexAop-GFP Merge
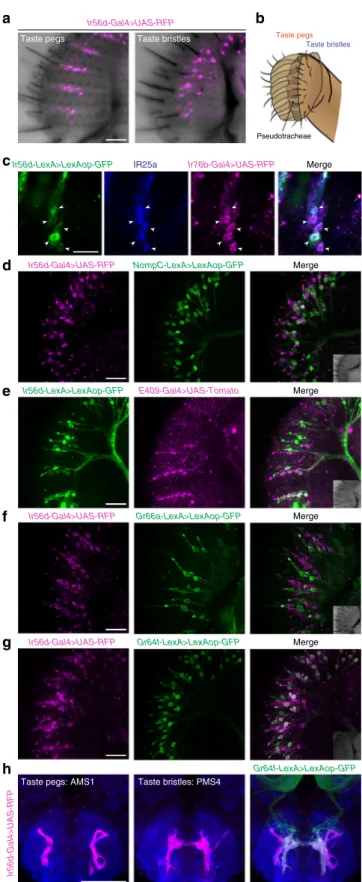
Fig. 4 IR56d is expressed in two populations of neurons in the labellum. a Immunofluorescence with anti-RFP (magenta), overlaid on bright-field images, on a whole-mount proboscis of a w;UAS-mCD8:RFP;Ir56d-Gal4 animal. The left image corresponds to the maximal projection of the inner face of one labellar palp, and the right image corresponds to the surface of one labellar palp. Scale bar: 25μm. b Schematic representing the anatomical location of the taste peg neurons (orange) and taste bristle neurons (blue) in the labellum.c Immunofluorescence with anti-GFP (green), anti-IR25a (blue) and anti-RFP (magenta) on a whole-mount proboscis of a w;LexAop-mCD8:GFP-2A-mCD8:GFP/UAS-mCD8:RFP;Ir56d-LexA/Ir76b-Gal4 animal. The images show a close-up of taste peg neurons (arrowheads) to visualise the co-localisation of the three markers. Scale bar: 25μm. d Immunofluorescence with anti-RFP (magenta) and anti-GFP (green) on a whole-mount proboscis of a w;LexAop-mCD8:GFP-2A-mCD8: GFP/UAS-mCD8:RFP;NompC-LexA/Ir56d-Gal4 animal. The inset in the merged image shows a bright-field view of the imaged tissue (here and in the following panels). Scale bar: 25μm. e Immunofluorescence with anti-RFP (magenta) and anti-GFP (green) on a whole-mount proboscis of a w; LexAop-mCD8:GFP-2A-mCD8:GFP/E409-Gal4;Ir56d-LexA/UASCD4:tdTomato animal. Scale bar: 25μm. f Immunofluorescence with anti-RFP (magenta) and anti-GFP (green) on a whole-mount proboscis of a Gr66a-LexA/+; LexAop-rCD2:GFP/UAS-mCD8:RFP;Ir56d-Gal4/(TM6B or TM2) animal. Scale bar: 25μm. g Immunofluorescence with anti-RFP (magenta) and anti-GFP (green) on a whole-mount proboscis of a w;LexAop-mCD8:GFP-2A-mCD8: GFP/UAS-mCD8:RFP;Gr64f-LexA/Ir56d-Gal4 animal. Scale bar: 25μm. h Immunofluorescence with anti-RFP (magenta), anti-GFP (green) and nc82 (blue) on a whole-mount brain of a w;LexAop-mCD8:GFP-2A-mCD8: GFP/UAS-mCD8:RFP;Gr64f-LexA/Ir56d-Gal4 animal. Both left and middle panels show the expression of only the Ir56d-Gal4 driver. The left panel shows the maximal projection of the anterior SEZ; the middle panel shows the maximal projection of the most posterior optical slices of the SEZ. The right panel shows the overlay of the Ir56d-Gal4- and Gr64f-LexA-expressing populations. AMS1 anterior maxillary sensory zone 1, PMS4 posterior maxillary sensory zone 4. Scale bar: 50μm
Ir56d taste bristle neurons lacking these IRs are consistent with
the well-established role of GRs in sugar sensing in these cells
3,6.
Carbonation induces Ir56d-dependent attraction. Previous
analysis of
flies’ behavioural responses to carbonation indicated
that this stimulus mediates taste-acceptance behaviour
9.
How-ever, the requirement of E409-Gal4-positive labellar neurons was
difficult to determine because the E409-Gal4 enhancer trap is
expressed in many central neurons in addition to the taste pegs
9,
limiting its usefulness for neuronal manipulation experiments.
With our characterisation of IR56d, we were better positioned to
examine more precisely the sensory basis of carbonation-evoked
behaviours.
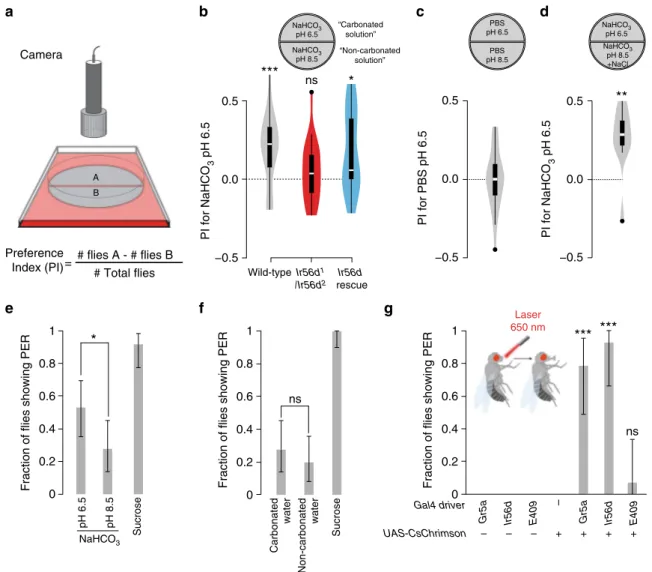
We
first established a two-choice assay in which flies could
freely explore a circular arena containing separate semicircles of
filter paper soaked in carbonated or non-carbonated solutions
(100 mM NaHCO
3pH 6.5 and 100 mM NaHCO
3pH 8.5,
respectively; these ensure a long-lasting source of carbonation
9).
After 90 min, we observed the position of
flies in the arena and
calculated a preference index (Fig.
7a). Wild-type
flies showed a
clear preference for the carbonated solution (Fig.
7b). This
preference was not due to the pH difference of the solutions as
flies did not show preference for phosphate buffered saline (PBS)
pH 6.5 over PBS pH 8.5 (Fig.
7c); similarly, the slightly different
salt concentrations in the carbonated and non-carbonated
solutions (see Methods) could not account for the preference
NaCl [low] NaCl [high] PBS pH 10 PBS pH 7 PBS pH 4 NaH2PO4 Water Taste stimuli Acetic acid CsHCO3 NaHCO3a
c
–10 70Raw fluorescence Water Carbonation Sucrose
0 Glutamic acid Aspartic acid Lysine Histidine Arginine Denatonium Caffeine Sucrose Trehalose Fructose Glycerol
b
Ir56d>GCaMP3 Δ F /F (%) AMS1 PMS4 0 20 40 60 ΔF/F (%) ΔF/F (%) PMS4 (taste bristles) 80 0 20 40 60 80***
**
**
***
***
**
**
*
*
*
*
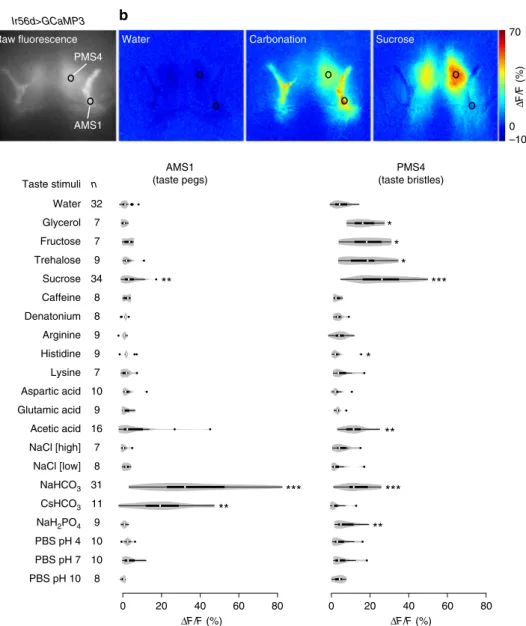
32 7 7 9 34 8 8 9 9 7 10 9 16 7 8 31 11 9 10 10 8 n AMS1 (taste pegs)Fig. 5 IR56d neurons respond to carbonation and sugars. a Rawfluorescence image of IR56d neuron axons innervating the SEZ in a w;UAS-GCaMP3;Ir56d-Gal4 animal. The black circles indicate the approximate position of the regions-of-interest (ROIs) in the AMS1 and PMS4 used for the quantifications in c. b Colour-coded images ofΔF/F (reflecting the maximal GCaMP3 fluorescence intensity changes; scale bar on the far-right) of IR56d neuron responses in the same animal as ina to the application of distilled water, a carbonated solution or sucrose to the labellum. c Quantification of changes in ΔF/F in the ROIs in AMS1 and PMS4 upon application of the indicated taste stimuli to the labellum of w;UAS-GCaMP3;Ir56d-Gal4 animals. Violin plots (in this and all followingfigures) show the density of the data points extending from the minimum to the maximum value. Internal boxplots show the median and the interquartile range of the distribution of responses (IQR;first and third quartile). Whiskers represent 1.5x IQR. Black dots represent outliers. n denotes the number of replicates for each stimulus. Concentrations of each of the taste stimuli are listed in Supplementary Table 2. For the statistical analysis the response data for each stimulus were compared with water; only significant differences are shown: *P < 0.05, **P < 0.01, ***P < 0.001 (Wilcoxon rank sum test)
observed (Fig.
7d). These observations are consistent with those
made using a different positional-preference assay
9, confirming
that carbonation (a product of microbial fermentation) is a
modestly attractive stimulus for Drosophila. Importantly, this
preference was completely abolished in Ir56d mutant
flies (Fig.
7b)
and restored, albeit not to wild-type levels, by expression of Ir56d
cDNA in IR56d neurons (Fig.
7b).
To investigate why
flies display positional preference for
carbonation, we performed additional behavioural assays. The
best-established response of insects to attractive gustatory stimuli
is the proboscis extension reflex (PER), which promotes contact
of the feeding organ with the substrate. While PER is robustly
triggered by sucrose (Fig.
7e), the carbonated solution used in
the two-choice assay (100 mM NaHCO
3pH 6.5) triggered a
small PER response that was only slightly higher than the control
non-carbonated solution (100 mM NaHCO
3pH 8.5) (Fig.
7e).
To eliminate any contribution of salt-evoked PER, we also
performed PER assays with fresh commercial carbonated and
non-carbonated water, which have only trace levels of minerals
(Supplementary Table 2). Here, both stimuli induced similarly
0.5 kb Promoter Ir56da
c
b
Carbonation S ucrose W a terControl Mutant Rescue
PMS4 ΔF/F (%) 0 50 100 150
***
**
AMS1 ΔF/F (%) 0 50 100 150***
Ir56d1 ΔF/F (%) 0 50 100 150 PMS4**
*
**
ΔF/F (%) 0 50 100 150 AMS1**
*
Ir25a2 ΔF/F (%) 0 30 60 90*
PMS4 ΔF/F (%) 0 30 60 90***
AMS1 Ir76b2 Carbonation Sucrose Raw fluorescence Ir56d 1 –10 70 0 Carbonation Sucrose Raw fluorescence Control –10 0 100 Δ F /F (%) Δ F /F (%) Ir56d>GCaMP3 Ir56d>GCaMP3 Ir76b 2 –20 100 0 Δ F /F (%) Ir76b>GCaMP3 Ir25a 2 70 0 Δ F /F (%) Ir56d>GCaMP3 GGTCATCACGGAGCGCATGTGGG GGTCATCACGGAGCGC.TGTGGG Ir56d1 Ir56d+CRISPR target PAM
CCAATGGGATAGCTATAGCTGACC CCA...GCTATAGCTGACC Ir56d2 Ir56d+ CRISPR target PAM
Fig. 6 IR56d, IR25a and IR76b are required for sensory responses to carbonation but not sucrose. a Schematic of the Ir56d locus (single exon in grey), showing the position of the CRISPR target and the sequence of the Ir56d mutant alleles in these regions. PAM protospacer adjacent motif.b Raw fluorescence of GCaMP3 expressed in IR56d neurons, and colour-coded images (reflecting the maximal GCaMP3 fluorescence intensity changes; scale bars for each genotype on the right) in control, Ir56d1, Ir25a2and Ir76b2mutantflies stimulated with 1 M sucrose and a carbonated solution (as in Fig.5c). For genotypes, seec. c Quantification of changes in ΔF/F in the ROIs as shown in Fig.5a, b upon application of the indicated chemicals to the proboscis of the indicated genotypes: IR56d: Control: w;Bl/+; UAS-GCaMP3,Ir56d-Gal4/+ (n = 8); Mutant: w;Ir56d1/Ir56d1; UAS-GCaMP3,Ir56d-Gal4/+ (n = 11); Rescue:
w;Ir56d1,UAS-Ir56d/Ir56d1;UAS-GCaMP3,Ir56d-Gal4/+ (n = 10). IR25a: Control: w;Bl/+; UAS-GCaMP3,Ir56d-Gal4/+ (n = 11); Mutant: w;Ir25a2/Ir25a2
;UAS-GCaMP3,Ir56d-Gal4/+ (n = 11); Rescue: w;Ir25a2,UAS-Ir25a/Ir25a2; UAS-GCaMP3,Ir56d-Gal4/+ (n = 9). IR76b: Control: w;Ir76b-Gal4/CyO;UAS-GCaMP3/
TM6B (n= 8); Mutant: w;Ir76b-Gal4/+; UAS-GCaMP3,Ir76b2/Ir76b2(n= 10); Rescue: w;Ir76b-Gal4,UAS-Ir76b/+;UAS-GCaMP3,Ir76b2/Ir76b2(n= 7). We
used Gal4 in the rescue experiments of the Ir76b mutant due to constraints of the chromosomal location of the relevant transgenes; although Ir76b-Gal4 is more broadly-expressed than Ir56d-Ir76b-Gal4, the AMS1 and PMS4 projections are still easily recognisable. For the statistical analysis the response data for each stimulus were compared with water; only significant differences are shown: *P < 0.05, **P < 0.01, ***P < 0.001 (Wilcoxon rank sum test with Bonferroni correction for multiple comparisons)
low levels of PER (Fig.
7f). Finally, we examined whether PER can
be triggered by optogenetic activation of taste peg neurons using
the red-light sensitive channelrhodopsin CsChrimson (Fig.
7g). In
positive control animals, in which CsChrimson was expressed
under the control of a Gr5a driver or our Ir56d driver (which is
expressed in both taste pegs and sugar-sensing neurons in taste
bristles), exposure of the labellum to red light induced, as
expected, robust PER (Fig.
7g). By contrast, selective activation of
the taste peg neurons (using the E409-Gal4 driver) did not
(Fig.
7g). Together these results suggest that the
carbonation-sensing taste peg neurons do not activate the PER motor circuit.
During the positional preference assay,
flies might also
taste the substrate with their legs. However, direct carbonation
stimulation of legs does not evoke PER (Supplementary Fig. 4d),
which is consistent with the lack of physiological sensitivity
of tarsal neurons to this stimulus (Supplementary Fig. 4b-c).
These observations argue that the IR56d leg neurons are
unlikely to contribute to the behavioural responses to
carbona-tion, and that labellar taste peg neurons are the principal (and
potentially only) carbonation sensors in the animal.
Finally, we asked whether carbonation influences food
ingestion using Expresso, an automated feeding assay that can
a
# flies A - # flies B Camerab
−0.5 0.0 0.5 PI for NaHCO 3 pH 6.5 Wild-type Ir56d1 /Ir56d2 Ir56d rescue*
ns # Total flies Preference Index (PI)***
1 0.8 0.6 0.4 0.2 0 pH 6.5 pH 8.5 Sucrose NaHCO3 1 0.8 0.6 0.4 0.2 0 Carbonated water Non-carbonated water SucroseFraction of flies showing PER Fraction of flies showing PER
e
f
*
−0.5 0.0 0.5 PI for PBS pH 6.5 −0.5 0.0 0.5c
PBS pH 6.5 PBS pH 8.5 NaHCO3 pH 6.5 NaHCO3 pH 8.5 +NaCl**
d
=g
0 0.2 0.4 0.6 0.8 1 UAS-CsChrimson Gal4 driver Gr5a – Ir56d – E409 – + – Gr5a + Ir56d + E409 +Fraction of flies showing PER
“Carbonated solution” “Non-carbonated solution” ns Laser 650 nm ns
***
***
PI for NaHCO 3 pH 6.5 NaHCO3 pH 6.5 NaHCO3 pH 8.5 A BFig. 7 Carbonation promotes IR56d-dependent feeding behaviours: a Schematic of the two-choice positional preference arena assay. Flies can choose to feed from two substrates comprising stacks of blotting paper soaked in different tastant solutions on opposite sides of a 94 mm diameter Petri dish. Fly position was quantified automatically and used to calculate a Preference Index (PI) as indicated below the scheme. b Two-choice assay showing the preference of the indicated genotypes for a carbonated solution (100 mM NaHCO3pH 6.5) over a control non-carbonated solution (100 mM NaHCO3pH
8.5). Genotypes: w1118(n= 21 arenas; 70–80 flies per arena); Ir56d mutant: w;Ir56d1/Ir56d2(n= 21 arenas); Rescue: w;Ir56d1,UAS-Ir56d/Ir56d2;Ir56d-Gal4/
+ (n = 14 arenas). ns non-significant, *P < 0.05, **P < 0.01, ***P < 0.001 (Wilcoxon signed rank test (H0= 0)). c Two-choice assay showing the preference
of w1118flies (n = 24 arenas) for a PBS pH 6.5 solution vs. a PBS pH 8.5 solution. d Two-choice assay showing the preference of w1118flies (n = 10 arenas) for a carbonated solution (100 mM NaHCO3pH 6.5) over a non-carbonated solution (100 mM NaHCO3pH 8.5) that was supplemented with NaCl to
achieve afinal [Na+] of 150 mM. **P < 0.01 (Wilcoxon signed rank test (H0= 0)). e Fraction of w1118flies (n = 36) showing the proboscis extension reflex
(PER) to the tastants indicated (100 mM NaHCO3at pH 6.5 or pH 8.5, 100 mM sucrose). Error bars represent the ±95% binomial confidence intervals;
*P < 0.05 (Fisher exact test).f Fraction of w1118flies (n = 36) showing PER to commercial carbonated water, non-carbonated water and 100 mM sucrose.
Error bars represent the ±95% binomial confidence intervals; ns non-significant (Fisher exact test). g Fraction of flies of the indicated genotypes (n = 14 for all) showing PER upon optogenetic stimulation using red light. Genotypes (left-to-right along the x-axis): (i) w;Bl/CyO;Gr5a-Gal4/TM6B (ii) w;Bl/CyO;Ir56d-Gal4/TM6B (iii) w;Bl/CyO;E409-w;Bl/CyO;Ir56d-Gal4/TM6B (iv) w;UAS-CsChrimson/CyO;TM2/TM6B (v) w;UAS-CsChrimson/CyO;Gr5a-w;Bl/CyO;Ir56d-Gal4/TM6B (vi) w;UAS-CsChrimson/ CyO;Ir56d-Gal4/TM6B (vii) w;UAS-CsChrimson/CyO;E409-Gal4/TM6B. Error bars represent the ±95% binomial confidence intervals; ns non-significant, ***P < 0.001 (Fisher exact test)
measure the number and volume of individual meal-bouts
47.
When comparing feeding of wild-type
flies on carbonated and
control solutions, we found no difference in any of the parameters
measured (Supplementary Fig. 5a). However, we noted that these
stimuli were very poor inducers of feeding, with fewer than half
the
flies consuming very low volumes of solutions. We reasoned
this was due to the lack of a nutritious substance, and repeated
the assays in the presence of a low concentration of sucrose
(5 mM), which is moderately attractive to Drosophila
48. This
sugar supplement greatly increased consumption by the
flies, but
we again did not observe any enhancement of feeding by
carbonation (Supplementary Fig. 5b-c). Thus, the attractiveness
of carbonation to
flies does not appear to be related to an ability
to induce increased consumption, at least in this assay and with
the tested conditions.
Ir56d-dependent hexanoic acid sensing in taste bristles. In the
course of completion of our study, the taste bristle neurons that
co-express Ir56d and sweet-sensing Grs in the labellum and legs
were found to mediate physiological and behavioural responses to
medium chain fatty acids
33,36. We confirmed these observations
by showing that hexanoic acid activates IR56d neurons, noting
that the strongest responses occur in taste peg neurons
(Supple-mentary Fig. 6a-b). Hexanoic acid responses were abolished in
Ir56d mutants (Supplementary Fig. 6a-b), suggesting that IR56d
functions both in carbonation and fatty acid detection. In contrast
to carbonation, however, fatty acids evoke PER, and this
beha-viour is abolished in Ir56d mutants (Supplementary Fig. 6c). As
taste peg neuron activation does not trigger PER (Fig.
7e–g), these
observations suggest that hexanoic acid-evoked activity in taste
bristles is responsible for this behaviour, as proposed
pre-viously
36. Consistent with this hypothesis, RNAi of Ir56d
speci-fically in the sweet-sensing Gr neuron subpopulation eliminates
fatty acid-induced PER
33.
Discussion
This work describes the
first family-wide survey of the expression
of IRs in Drosophila, revealing remarkable diversity in the
neu-ronal expression patterns of members of this repertoire across
all known chemosensory organs in both larvae and adults.
These observations reinforce previous conclusions from analyses
of subsets of these genes
15,26–28that the non-antennal IRs
func-tion to detect a myriad of chemical stimuli to evoke a variety
of behavioural responses. Such properties presumably apply to
the vast, divergent IR repertoires of other insect species
15, for
example, the 455 family members in the German cockroach
Blatella germanica
18, or the 135 IRs in the mosquito Aedes
aegypti
49. Within Drosophila we did not detect obvious
rela-tionships between IR phylogeny and stage- or organ-specific
expression patterns. Phylogenetic proximity may therefore be the
most indicative of functional relationships between IRs, as is
the case for those expressed in the antenna
20. If this hypothesis
is correct, the expression data presented here suggest that
functionally-related clades of receptors act in several types of
chemosensory organ.
An important caveat to the transgenic approach we used to
reveal expression is the faithfulness of these reporters to the
endogenous expression pattern of Ir genes. Although this strategy
has been widely (and successfully) used for antennal IRs and
other chemosensory receptor families, it is impossible to
deter-mine reporter
fidelity without a complementary tool (e.g.
receptor-specific antibodies or tagging of the endogenous
geno-mic locus). We note discrepancies between the expression of
some of our Ir-Gal4 lines and those described previously
26; many
of these probably reflect differences in the length of regulatory
regions used to create these distinct transgenes. Precise
compar-ison of independently-constructed transgenic constructs may in
fact be useful in informing the location of enhancer elements
directing particular temporal or spatial expression patterns.
Moreover, transgenic reporters provide powerful genetic tools for
visualisation and manipulation of specific neuronal populations.
The reagents generated here should therefore provide a valuable
resource for further exploration of the IRs in insect gustation.
Using our atlas, we identified IR56d—together with the
broadly-expressed co-receptors IR25a and IR76b—as essential for
responses of labellar taste peg neurons to carbonation. Such
observations implicate IR56d as the previously unknown tuning
receptor for this stimulus
9. However, these IRs do not appear to
be sufficient for carbonation detection, as their misexpression in
other neurons failed to confer sensitivity to carbonated stimuli
(Supplementary Fig. 7). This observation suggests that additional
molecules or cellular specialisations are required. Such a factor
may be rather specific to taste pegs, given the minimal/absent
responses of Ir56d-expressing taste bristle/leg neurons to
carbo-nation, but does not appear to be another IR, as we have not
identified other IR reporters expressed in this population of cells.
While precise mechanistic insights into carbonation sensing
will require the ability to reconstitute IR56d-dependent
carbo-nation responses in heterologous systems, it is interesting to
compare how insects and mammals detect this stimulus. The
main mammalian gustatory carbonation sensor, the carbonic
anhydrase Car4
50is an enzyme tethered to the extracellular
surface of sour (acid) taste receptor cells in lingual taste buds,
where it is thought to catalyse the conversion of aqueous CO
2into hydrogencarbonate (bicarbonate) ions (HCO
3−) and protons
(H
+). The resulting free protons, but not hydrogencarbonate
ions, provide a relevant signal for the sour-sensing cells
50. By
contrast, IR56d neurons are not responsive to low pH, suggesting
a different chemical mechanism of carbonation detection. Our
observation that IR56d is also essential for sensitivity to hexanoic
acid suggests that IR56d could recognise the common carboxyl
group of hydrogencarbonate and fatty acid ligands. However,
IR56d neurons are not responsive to all organic acids, indicating
that this cannot be the only determinant of ligand recognition.
Our characterisation of IR56d neurons extends previous
reports
33,36,37to reveal an unexpected complexity in the
mole-cular and neuronal basis by which attractive taste stimuli are
encoded. The taste bristle population of IR56d neurons represents
a subset of sugar-sensing cells that are also responsive to fatty
acids, glycerol and, minimally, to carbonation. Although
activa-tion of these neurons promotes PER, we
find that
carbonation-evoked stimulation is insufficient to trigger this behaviour, which
suggests that taste bristles are not a relevant sensory channel for
this stimulus. While members of a specific clade of GRs are
well-established to mediate responses to sugars and glycerol
3,6,37,51,
the detection mechanisms of fatty acids appear to be more
complex. Earlier work demonstrated an important role of a
phospholipase C homologue (encoded by norpA) in labellar fatty
acid responses
10. More recently, GR64e was implicated as a key
transducer of fatty acid-dependent signals, but suggested to act
downstream of NorpA, rather than as a direct fatty acid
recep-tor
37. By contrast, an independent study of the legs showed that
all sugar-sensing Gr genes (including Gr64e) were dispensable for
fatty acid detection, and provided evidence instead for an
important role of IR25a and IR76b in these responses
33. Analysis
of our Ir56d mutants indicates an IR-dependent fatty
acid-detection mechanism also exists in the labellum; future work will
be needed to relate this to the roles of GR64e and NorpA.
The IR56d taste peg population is, by contrast, sensitive to
carbonation and fatty acids (but not sugars or glycerol), and these
responses can be ascribed to IR56d (a Gr64e
LexAreporter is not
expressed in taste peg neurons
52). Although these neurons
mediate taste-acceptance behaviour, they do not appear to
pro-mote proboscis extension or food ingestion. Recent work using
optogenetic neuronal silencing experiments provided evidence
that taste peg neuron activity is important for sustaining, rather
than initiating, feeding on yeast, by controlling the number of sips
an animal makes after proboscis extension
53. These observations
are concordant with the internal location of taste pegs on the
labellum, as they will not come into contact with food until the
proboscis has been extended, and could explain the positional
preference for carbonated substrates that we observed. We have
attempted to determine whether carbonation can influence
sip-ping behaviour using
flyPAD
54. Although these experiments did
not reveal a statistically-significant effect (Supplementary Fig. 8),
interpretation is complicated by the difficulty of providing and
maintaining carbonation stimuli in the solid medium used in
flyPAD assays. Future development of other approaches to
pro-vide this stimulus in feeding assays will be necessary.
Never-theless, our data strengthen the view that carbonation, a
non-nutritious
microbial
fermentation
product,
regulates—via
activation of IR56d taste peg neurons—a distinct motor
pro-gramme to PER as part of a multicomponent behavioural
response.
Methods
Transgene generation. Ir-Gal4 lines were constructed with sequences from the Oregon R strain (OR) using standard methods15,28(Supplementary Table 1) and
inserted into the attP2 landing site55, by normal transformation procedures
(Genetic Services, Inc.). Ir56d-LexA was made by subcloning the same genomic sequence as in Ir56d-Gal4 upstream of LexA:VP16-SV4056in pattB57and
trans-formation into attP2. UAS-Ir56d was made by PCR amplification of the Ir56d (single-exon) ORF from w1118genomic DNA, which was T:A cloned into pGEM-T
Easy and sequenced, before subcloning into pUASTattB57, and transformation into
attP4055. UAS-Ir56dmutcontains a deletion of a single nucleotide at position 1010
of the Ir56d ORF; this frameshift mutation is predicted to cause premature translation termination and a non-functional receptor fragment.
Drosophila strains. Drosophila stocks were maintained on a standard corn flour, yeast and agar medium under a 12 h light:12 h dark cycle at 25 °C; different culture conditions for certain behavioural assays are described below. The wild-type strain was w1118. Other mutant and transgenic strains were: Ir25a214, Ir76b27,
Ir25a-Gal425, Ir76b-Gal4 (insertions on chromosome 2 or 3)20, Gr5a-Gal458,
Gr64f-LexA52, Gr66a-LexA59, Gr66a-Gal448, NompC-LexA44, E409-Gal49, UAS-Ir25a25,
UAS-Ir76b7, UAS-GCaMP360, UAS-mCD8:GFP61, UAS-CD4:tdTomato62,
UAS-mCD8:RFP63, LexAop-mCD8:GFP-2A-mCD8:GFP56, LexAop-rCD2:GFP56,
UAS-CsChrimson64.
CRISPR/Cas9-based genome editing. Ir56d1and Ir56d2: we identified two
CRISPR target sequences within the Ir56d locus using ZiFiT (zifit.partners.org/ ZiFiT/)65that are both unique within the genome and which contain an adjacent 3’
protospacer adjacent motif (PAM) (Fig.6a). We generated DNA templates for synthetic guide RNA synthesis by PCR using standard procedures66using the
following oligonucleotides: CRISPRsgR with either CRISPRsgF-Ir56d1or
CRISPRsgF-Ir56d2(Supplementary Table 3). The template was transcribed in vitro
with T7 polymerase, RNA was microinjected into vas-Cas9flies (expressing Cas9 specifically in the germline67) and mutations in the target sequence region
screened by Genetic Services, Inc. After establishment of homozygous mutant lines, mutations were reconfirmed by Sanger sequencing.
Ir56dGal4: the Gal4 knock-in allele was generated via CRISPR/Cas9 mediated
homologous recombination. Two sgRNAs targeting the Ir56d locus were cloned into pCFD568by Gibson Assembly to generate pCFD5-Ir56dsgRNAs. Homology
arms for the Ir56d locus were fused to the Gal4-hsp70-3’UTR by PCR amplification using genomic DNA and pGal4attB15as templates, respectively. The product was
ligated into pHD-DsRed-attP67after digestion with SapI and AarI (to generate the
donor vector Gal4-DsRed-attP). pCFD5-Ir56dsgRNAs and pHD-Ir56d-Gal4-DsRed-attP were co-injected into Act5C-Cas9,lig4[169]flies69following
standard protocols. Successful integration events were identified by screening for DsRed expression and diagnostic PCR. Subsequently, the DsRed marker was removed by injection of Cre recombinase. The oligonucleotides used are listed in Supplementary Table 3 and Supplementary Fig. 3a depicts a schematic of the Ir56dGal4allele before and after DsRed removal.
Histology. Immunofluorescence on peripheral and central tissues from larvae and adultflies was performed following standard procedures28,45. Primary antibodies:
rabbit anti-IR25a (1:500)14, guinea pig anti-IR25a (1:200)21, mouse anti-GFP
(1:500; Invitrogen), chicken anti-GFP (1:500; Abcam), rabbit anti-RFP (1:500; Abcam) and mouse monoclonal nc82 (1:10; Developmental Studies Hybridoma Bank). Secondary antibodies (all diluted 1:100–200): goat anti-mouse Alexa 488 (Invitrogen), goat anti-rabbit Cy3 (Milan Analytica, AG), goat anti-chicken Alexa488 (Abcam), goat anti-guinea pig Cy5 (Abcam) and goat anti-mouse Cy5 (Jackson ImmunoResearch). Images were collected with a Zeiss LSM 710 inverted laser scanning confocal microscope (Zeiss, Oberkochen, Germany), and processed with ImageJ and Fiji.
Optical imaging. Subesophageal zone imaging: Imaging was performed adapting previous protocols70,71. In brief, a 1–3 week-old fly was cold-anaesthetised and
inserted into a plastic holder glued to a custom Plexiglas chamber. The head and proboscis of the animal were separated by a plastic barrier that prevents contact between the buffer solution applied to the brain, and the tastant solution. The proboscis was extended using a blunted syringe needle (30 g Blunt, Warner Instruments #SN-30) connected to a vacuum pump (KNF Laboport #N86KN.18) and kept extended using UV curing glue (Tetric EvoFlow, A1, Ivoclar Vivadent) solidified using a UV lamp (Bluphase C8, Ivoclar vivadent). Heads were fixed using the same UV glue and covered with Adult Haemolymph like-Saline buffer (in mM: 108 NaCl, 5 KCl, 2 CaCl2, 8.2 MgCl2, 4 NaHCO3, 1 NaH2PO4, 15 Ribose, 5 HEPES;
pH 7.5; 265 mOsm). Brains were exposed by removing the cuticle using a micro-surgical knife (Sharpoint, Surgical Specialties #72-1501). Complete exposure of the subesophageal zone required the removal of the oesophagus. Delivery of the tastants was performed manually upon the emission of an acoustic signal at frame 20 after the onset of the recording, using a blunted 30 g syringe needle place on a 1 ml syringe containing the solution (BD Plastipak #300013) and mounted on a micromanipulator (Narishige).
Images were acquired with a CCD camera (CoolSNAP-HQ2 Digital CameraSystem) mounted on afluorescence microscope (upright fixed stage Carl Zeiss Axio Examiner D1) equipped with a 40x water-immersion objective (W Plan-Apochromat 40× /1,0 VIS-IR DIC). Excitation light of 470 nm was produced with an LED light (Cool LED pE-100, VisiChrome). Binned image size was 1000 × 700 pixels on the chip, corresponding to 250 × 175μm in the preparation. Exposure time was 100 ms. Twenty-secondfilms were recorded with an acquisition rate of 4 Hz. Metafluor software (Visitron) was used to control the camera, light, and data acquisition.
Data were processed using NIH ImageJ and custom programmes in Matlab (v9.0). Time-series images corresponding to one experiment werefirst aligned using StackReg/TurboReg (bigwww.epfl.ch/thevenaz/stackreg/) in NIH ImageJ. Raw images were then segmented into individual 80-frame measurements. Each measurement was bleach-corrected byfitting a double-exponential function to the relative meanfluorescence in the ROI over time, excluding the frames covering 12.5 s after stimulus onset. We then calculated the relative change influorescence (ΔF/F) for each frame of each measurement as (ΔFi− F0)/F0× 100, where F0is the
meanfluorescence value of frames 10–15 (before tastant presentation at frame 20), and Fiis thefluorescence value for the ith frame of the measurement. A circular
ROI (diameter 7 pixels) was used for quantification of all measurements from the same animal. The maximalΔF/F between frames 20 and 60 for each stimulus was used for data representation and statistical analysis.
Foreleg calcium imaging: imaging was performed adapting previous protocols33. A custom-made bottom-glass imaging chamber was built by drilling a
10 mm hole in a 35 mm Petri dish (Falcon #351008) onto which an 18 × 18 mm coverslip (Menzel-Gläser #631-1331) was glued. A 1–3 week-old fly was cold-anaesthetised and the forelegs cut with a razor blade between the femur and the tibia. UV-curing glue was used to seal the cut end of the leg, which was then mounted laterally on the glass surface of the imaging chamber. 1% low melting point agarose (Peqlab #35–2010) was used to cover the leg leaving exposed only the fourth andfifth tarsal segments. The preparation was covered with 150 µl of milliQ filtered water. For the stimulations, 150 µl of the desired chemical were added manually to the preparation. The sample was subsequently washedfive times using milliQfiltered water and left with 150 µl of water for equilibration during 3 min before the next stimulation. Imaging was performed using an inverted confocal microscope (Zeiss LSM 710) using an oil immersion 40x objective (Plan Neofluar 40x Oil immersion DIC objective with a 1.3 NA). 40 frames were taken per stimulation at 250 ms/frame. Different focal planes were used to image the 5b and 5s sensilla neurons. Images were analysed as indicated in the previous section.
Behaviour. Two-choice positional preference assay: assays were performed in 94 mm Petri dishes (Greinier-bio-one #632180; 94 × 16 mm), divided into two halves (A and B) by placing two stacks of three-layered semicircles of blotting paper (Macherey-Nagel #742113) separated by a 3–5 mm gap. Prior to the start of the experiment each semicircle stack was soaked with 3 ml of the desired test solution (see below and Supplementary Table 2). Up to 16 arenas were placed on a methacrylate panel (1.5 cm thickness) elevated 5.5 cm from the light source, which consisted of a 60 × 60 cm LED Panel (Ultraslim LED Panel, 360 Nichia LEDs, Lumitronix) covered with redfilm (106 Primary Red, Showtec). 70–80 flies (mixed sexes; 2–3 days old, starved for 24 h in glass culture tubes with a Kimwipe (Kimtech #7552) soaked with 2 ml of tap water; cold anaesthetised) were introduced into the centre of each arena and the lids replaced. When allflies had recovered mobility,
the assay was started. Pictures were taken (using a USB 3.0 100 CMOS Mono-chrome Camera 2048 × 2048 Pixel and a CCTV Lens for 2/300f:16 mm (iDS)) every 10 min up to 90 min using a custom Matlab code. The distribution of animals in the arena at 90 min (excluding the rareflies that were non-motile or that died during the assay) was quantified using a custom macro in Fiji (code available upon request). Preference indices were calculated as: (#flies in A − # flies in B)/total # flies. For the experiments in Fig.7b, different genotypes were run in parallel, and randomised with respect to arena position.
For carbonation preference tests, in order to ensure a slow but constant production of CO2over the course of the assay, we used solutions of
freshly-prepared 100 mM NaHCO3that were adjusted to pH 6.5 (with 5 M NaH2PO4;
∼1–1.5 ml/100 ml) for the carbonated side and pH 8.5 (with NaOH; <50 μl/100 ml) for the non-carbonated side9. To test for preference due to pH, we use phosphate
buffered saline (7.8 mM NaH2PO4, 12.2 mM Na2HPO4, 153.8 mM NaCl) solutions
at pH 6.5 or 8.5 (Fig.7c). To eliminate the possibility that preference differences were due to Na+imbalance (due to a larger volume of 5 M NaH2PO4required to
set the pH of NaHCO3at pH 6.5 than NaOH to set the pH to 8.5), we
supplemented the NaHCO3pH 8.5 solution with NaCl to achieve an∼150 mM
[Na+] in both test solutions;flies retained the preference for the carbonated solution (Fig.7d).
Proboscis extension reflex (PER) assay: PER in response to labellar stimulation was assessed following a standard protocol72. Individualflies (mixed sexes;
3–5 days old, starved for 24 h) were introduced into yellow pipette tips (Starlabs #S1111.0706), whose narrow end was cut in order that only thefly’s head could protrude from the opening, leaving the rest of the body, including legs, constrained inside the tip. Tastants (Supplementary Table 2) were delivered using a piece of Kimwipe. Eachfly was first tested with water; where this caused PER, water was offered ad libitum, and the animal tested again. Onlyflies that showed negative PER for water were assayed with the other stimuli. Up to sixflies were prepared simultaneously and tastants were randomised across trials.
For leg stimulation-evoked PER we adapted a published protocol33. Groups of
six cold anesthetizedflies (mixed sexes; 3–5 days old, starved for 24 h) were glued on their back on top of 76 × 26 mm microscope slides (Menzel-Gläser; #631–0649) using UV curing glue (Tetric EvoFlow, A1, Ivoclar Vivadent) solidified using a UV lamp (Bluphase C8, Ivoclar vivadent). Up tofive groups of six flies were prepared at the same time and allowed to recover for 30 min in a humidified chamber. Only one group of sixflies were tested at a time for the whole set of stimuli presented using a piece of Kimwipe72. Before the beginning of the stimulations,flies were
allowed to drink water ad libitum. Each stimulus was presented once allowing the flies to touch the Kimwipe with all the legs for 5 s. Only full extensions of the proboscis were considered as positive responses. Between stimuli,flies were allowed to drink water ad libitum and the legs washed with water.
Optogenetic induction of PER:flies were grown on standard food; prior to the experiment 3–5 days old flies were starved for 24 h in tubes containing a Kimwipe soaked in 2 mM all-trans-retinal (Sigma #R2500) in tap water. Flies were cold-anaesthetised and glued on their backs to the external side of a 94 × 16 mm plastic plate using UV curing glue (see above). Groups of 6–8 flies of the same genotype were prepared in a row and tested for PER to stimulation by a 650 nm laser diode (1 mW, Adafruit Industries #1054) aimed at the proboscis with an intensity of 2–2.5 μW/mm2. Only full proboscis extensions were considered as positive.
Expresso food ingestion measurements and analysis:flies were maintained on conventional cornmeal-agar-sucrose medium at 23–25 °C and 60–70% relative humidity (RH), under a 12 h light:12 h dark cycle (lights on at 6 am). Carbonated and non-carbonated control solutions were prepared as described above (either in water or with 5 mM sucrose). Food ingestion was measured in the Expresso device:47individualflies (2–5 days old male w1118flies, starved 24 h) were placed in
the behavioural chamber with the doors in the closed position to prevent access to the liquid food in the calibrated glass capillaries. Expresso data acquisition software was started at which point all doors were opened givingflies synchronised access to liquid food. Each trial lasted ~33 min, and 10flies were tested in parallel in two Expresso sensor banks. For each condition, 20–30 flies were tested. The measurements were performed at Zeitgeber Time 6–10. The Expresso food ingestion data were analysed using a custom programme in Python (available upon request). The change points in the Expresso signal that denote a meal bout and the amount of food ingested were detected using the Pruned Exact Linear Time algorithm. Total ingestion was calculated as the total volume ingested perfly per trial. The latency was calculated as the time before thefirst meal after door opening. When afly did not consume any food, the total meal bout volume was scored as 0 and latency tofirst meal bout was scored as the total time of the assay (i.e. 33 min). All data were analysed in R statistical software.
flyPAD: we assayed mated w1118femaleflies that were reared at 25 °C, 70% RH
on a 12 h light:12 h dark cycle. Flies were reared at standard density and were matched for age and husbandry conditions. Thefly medium contained, per litre, 80 g cane molasses, 22 g sugar beet syrup, 8 g agar, 80 g cornflour, 10 g soya flour, 18 g yeast extract, 8 ml propionic acid, and 12 ml nipagin (15% in ethanol). The day before the assay the fully fedflies were flipped into new vials to ensure a fully fed metabolic state. The starvation state was induced by transferringflies for 24 h before the assay into vials containing a tissue soaked with water.
flyPAD assays53,54were performed using only one well of the arena per assay.
The well wasfilled with a solid substrate comprising 20 mM sucrose made with either non-carbonated or carbonated water (Supplementary Table 2) in 1% agarose.
Flies were individually transferred toflyPAD arenas by mouth aspiration and allowed to feed at 25 °C and 70% RH for 60 min.flyPAD data were acquired using the Bonsai framework73, and analysed in MATLAB using custom-written
software54.
Statistics. Sample size was determined based upon preliminary experiments. Data were analysed and plotted using R (v1.0.153; R Foundation for Statistical Com-puting, Vienna, Austria, 2005; R-project-org) (code available upon request). Except for PER andflyPAD experiments, quantitative data are represented showing their distribution by superimposing a boxplot on top of a violin plot. The violin plot shows the kernel density estimate; for the boxplots the whiskers are calculated as follows: the upper whisker equals the third quartile plus 1.5× the interquartile range (IQR) and the lower whisker equals thefirst quartile minus 1.5× the IQR. Any data points above the superior or below the inferior whisker values are considered as outliers. The outliers were included in the statistical comparisons as we performed non-parametric rank tests. Data were analysed statistically using different variants of the Wilcoxon test, except where indicated. For comparisons between distribu-tions, the Wilcoxon rank sum test was used. When P value correction for multiple comparisons was required, the Bonferroni method was used. For the experiments in Fig.7b–d, we performed a Wilcoxon Signed Rank Test with the null hypothesis
that the median of sampled values differs from zero. For PER results we used the Fisher exact test. For Expresso assay data, pairwise comparisons using the Tukey and Kramer (Nemenyi) test with Tukey-Dist approximation for independent samples were performed.flyPAD results were compared using the Wilcoxon rank-sum test.
Data availability
All relevant data supporting thefindings of this study are available from the corre-sponding author on request.
References
1. Liman, E. R., Zhang, Y. V. & Montell, C. Peripheral coding of taste. Neuron 81, 984–1000 (2014).
2. Yarmolinsky, D. A., Zuker, C. S. & Ryba, N. J. Common sense about taste: from mammals to insects. Cell 139, 234–244 (2009).
3. Freeman, E. G. & Dahanukar, A. Molecular neurobiology of Drosophila taste. Curr. Opin. Neurobiol. 34, 140–148 (2015).
4. Wright, G. A. To feed or not to feed: circuits involved in the control of feeding in insects. Curr. Opin. Neurobiol. 41, 87–91 (2016).
5. Benton, R. The neurobiology of gustation in insect disease vectors: progress and potential. Curr. Opin. Insect Sci. 20, 19–27 (2017).
6. Scott, K. Gustatory processing in Drosophila melanogaster. Annu. Rev. Entomol. 63, 15–30 (2018).
7. Zhang, Y. V., Ni, J. & Montell, C. The molecular basis for attractive salt-taste coding in Drosophila. Science 340, 1334–1338 (2013).
8. Cameron, P., Hiroi, M., Ngai, J. & Scott, K. The molecular basis for water taste in Drosophila. Nature 465, 91–95 (2010).
9. Fischler, W., Kong, P., Marella, S. & Scott, K. The detection of carbonation by the Drosophila gustatory system. Nature 448, 1054–1057 (2007).
10. Masek, P. & Keene, A. C. Drosophila fatty acid taste signals through the PLC pathway in sugar-sensing neurons. PLoS Genet. 9, e1003710 (2013). 11. Charlu, S., Wisotsky, Z., Medina, A. & Dahanukar, A. Acid sensing by sweet
and bitter taste neurons in Drosophila melanogaster. Nat. Commun. 4, 2042 (2013).
12. Ingleby, F. C. Insect cuticular hydrocarbons as dynamic traits in sexual communication. Insects 6, 732–742 (2015).
13. Joseph, R. M. & Carlson, J. R. Drosophila chemoreceptors: a molecular interface between the chemical world and the brain. Trends Genet. 31, 683–695 (2015).
14. Benton, R., Vannice, K. S., Gomez-Diaz, C. & Vosshall, L. B. Variant ionotropic glutamate receptors as chemosensory receptors in Drosophila. Cell 136, 149–162 (2009).
15. Croset, V. et al. Ancient protostome origin of chemosensory ionotropic glutamate receptors and the evolution of insect taste and olfaction. PLoS Genet. 6, e1001064 (2010).
16. Rytz, R., Croset, V. & Benton, R. Ionotropic receptors (IRs): chemosensory ionotropic glutamate receptors in Drosophila and beyond. Insect Biochem. Mol. Biol. 43, 888–897 (2013).
17. van Giesen, L. & Garrity, P. A. More than meets the IR: the expanding roles of variant ionotropic glutamate receptors in sensing odor, taste, temperature and moisture. F1000Res. 6, 1753 (2017).
18. Harrison, M. C. et al. Hemimetabolous genomes reveal molecular basis of termite eusociality. Nat. Ecol. Evol. 2, 557–566 (2018).