XIV. COGNITIVE INFORMATION PROCESSING
Academic and Research Staff M. Eden J. Allen F. F. Lee S. J. Mason W. F. Schreiber D. E. Troxel B. Anderson P. Barnwell III L. Bass A. Blesser E. Bowie E. Filip Gabrielian M. Gilkes E. Greenwood G. Guttmann Prof. T. S. Huang Dr. R. R. Archer Dr. W. L. Black Dr. J. E. Green Dr. K. R. Ingham Dr. O. J. Tretiak F. X. Carroll Graduate Students R. V. Harris III D. W. Hartman A. B. Hayes P. D. Henshaw M. Hubelbank W-H. Lee J. I. Makhoul G. P. Marston III G. F. Pfister C. L. Fontaine E. R. Jensen A. J. Laurino D. M. Ozonoff E. Peper Sandra A. Sommers D. S. Prerau G. M. Robbins S. M. Rose C. L. Seitz D. Sheena W. W. Stallings R. M. Strong Y. D. Willems J. W. Woods I. T. Young
A. PAGE READER FOR A READING MACHINE FOR THE BLIND
1. Introduction
For several years, our group has worked on the development of a reading machine for the blind. The problem involves the transformation of ordinary printed text into a form that can be sensed by a blind person. The first reading machine system, which was demonstrated in the spring of 1966, was capable of reading a single line of text, recognizing the characters and punctuation, and spelling out these symbols aurally. This experimental system was not intended to be a prototype of a practical reading aid, but rather was a real-time research facility for the experimental investigation of human information requirements and human learning capabilities upon which prototype designs must be based. This experimental system has facilitated research on print scanning, character recognition, control by a blind reader, and auditory displays.1-5
One of the crudest features of the initial reading machine system was the opaque scanner, and work commenced immediately to develop an improved scanner and car-riage control that would handle whole pages of print rather than individual lines. During the spring of 1968, funds were made available for the purchase of a PDP-9 computer which was to be used primarily for reading machine development. This computer has
This work was supported principally by the National Institutes of Health (Grants 5 POI GM14940-03 and 5 P01 GM15006-02), and in part by the Joint Services Elec-tronics Programs (U. S. Army, U. S. Navy, and U. S. Air Force) under Contract DA 28-043-AMC-02536(E). Prof.
Prof.
Prof. Prof.Prof.
Prof.
G.
T.
W.
B.
J.
A.
A.
A.
R.
E.
(XIV. COGNITIVE INFORMATION PROCESSING)
formed the nucleus of a second research version of a reading machine for the blind
which, while still not a prototype, has considerably improved capabilities and
repre-sents a significant step toward the eventual realization of a practical machine.
2.
System Description
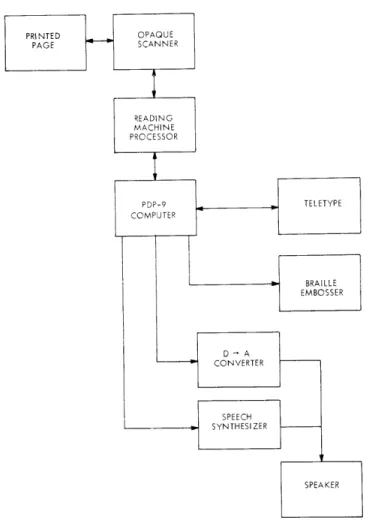
The system diagram for the second version of the reading machine is shown in
Fig. XIV-1.
The transformation of a printed page into Braille, spelled speech, or
synthesized speech has been demonstrated with this system.
Fig. XIV- 1. Reading machine system diagram.
This report is concerned primarily with the page-reading process or the
transfor-mation of the printed page into a sequence of character codes that can be further
pro-cessed to make the information available to a blind person in the form of Grade II
Braille, spelled speech, or synthesized speech. The output of the page-reader portion of
the reading machine can be typed on a teletype so that sighted persons may conveniently
(XIV. COGNITIVE INFORMATION PROCESSING)
monitor the performance of the page-reading procedures.
The printed pages used thus far have been removed from a Fourth Grade reader, entitled "Roads to Everywhere," published by Ginn and Company, Boston, 1964 and printed in 14 point TEXTYPE type. Only those pages that do not contain pictures have been used.
The opaque scanner is a flying-spot scanner in which a dot of light positioned on the face of the cathode-ray tube (CRT) is imaged on the page. The total light reflected from the page is sensed by photomultiplier tubes, the output of which is a function of the white-ness of the particular spot on the page. To achieve the necessary resolution, the face of the CRT is imaged onto approximately 1 sq. in. of the page. Access to the whole area is provided by a carriage that is integral to the opaque scanner and permits both horizontal and vertical motion of the page. Both the carriage and opaque scanner are operated by the reading-machine processor (RMP), which in turn receives directives from the computer. This RMP in effect extends the instruction set of the computer and allows various complex functions to be initiated by the computer and to be performed while the computer is engaged in other calculations. One such directive that is often used is, "Given that the dot of light on the CRT is imaged on the contour of a character, find the next sequential contour point and return its coordinates to the computer." It was deemed necessary to provide these functions in the hardware, rather than to per-form them by computer program, so that recognition rates could approximate human speaking rates.
The recognition of a alphanumeric characters is a modification and extension of procedures developed by Clemens, in which a number or signature is computed from the exterior contour of a character, and the character is "recognized" by finding a
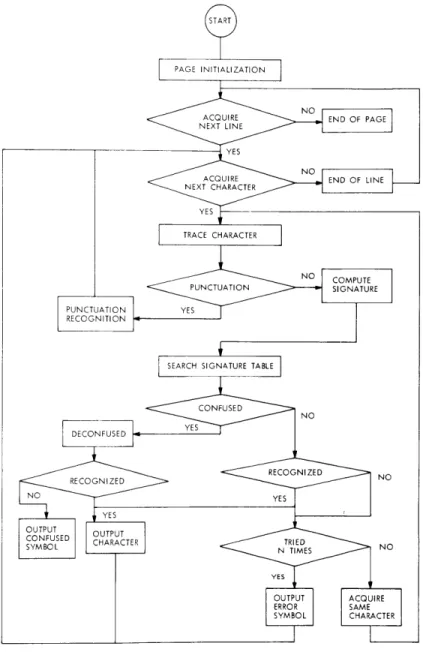
match in a previously generated table of signatures and character codes. The sequence of operation of the page reading programs is indicated in Fig. XIV-2. The first step is page initialization where the optimum threshold for the discrimination of black and white on the page is computed. The size of the type face on the page is determined, and
the left and upper boundaries of print on the page are located. Starting from the top of the page, the first line of print is acquired, and then the first character in this line is acquired. Then the exterior contour of the letter is traced; and if the character is deemed large enough, a signature is computed and the signature table is searched to yield the code for the character. Then an attempt is made to acquire the next character.
Eventually all of the characters on that line will be processed and no such character will be available, thereby resulting in an end-of-line determination. When this occurs, the program attempts to acquire the next line of print. If no such line is found, then the
page is considered finished.
If, after a character has been traced, it has been deemed small enough to be punc-tuation, control is transferred to a special routine that recognizes the punctuation mark
(XIV. COGNITIVE INFORMATION PROCESSING)
Fig. XIV-2.
Page reader flow chart.
and proceeds to acquire the next character.
As seen in the lower portion of Fig. XIV-2, there are three possible outcomes of a
signature table search. The most fortunate of these is that the signature is uniquely
associated with a particular character. Some shapes, however, that correspond to two
different characters result in the generation of identical signatures. Fortunately,
there are not very many occurrences of these confused signatures, and it has been
possible to resolve these confusions by making auxilliary tests. If a particular signature
just generated does not exist in this signature table, then the character is reacquired
(XIV.
COGNITIVE INFORMATION PROCESSING)
statistics of successive tracings of the same character seem to be similar to the
sta-tistics of successive tracings of like characters.
3.
Page Initialization
Page initialization performs three main functions: the determination of the optimum
threshold for subsequent black-white decisions, the determination of the size of the type
face on the page, and the positioning of the carriage for subsequent acquisition of text.
As the scanner can only access approximately 1 sq. in. of the page area, it is first
necessary to locate the carriage so that this aperture contains some print. In the
present system, this is accomplished simply by moving the aperture to the center of the
page; then a number of A to D conversions are made over this central portion of the
page,
A to
and the optimum threshold is
D conversions, as indicated
WHITE PEAK
BLACK PEAK OPTIMUM THRESHOLD
MINIMUM
INCREASING WHITENESS INCREASING WHITENESS
Fig. XIV-3.
Optimum
thresh-old determination.
the carriage so that the left edge of
page).
Then the aperture is moved
computed from a histogram of the results of these
in Fig. XIV-3.
The two peaks of this histogram
corresponding to the most common black and the
most common white are found. Then the minimum
of the central region of the histogram as bounded
by these -peaks, is determined.
The optimum
threshold is then computed as the midpoint of a
horizontal line drawn a fixed distance above this
minimum and bounded by the interior sections of
the histogram.
The font size is characterized by the x height,
which is the height of the lower-case x. This
x height is determined by tracing the contours of a
number of characters and is calculated as the
average height of the smallest characters, provided
that there exists one character which is
substan-tially taller than the smallest character.
Care is
taken, of course, that specks are not classified as
characters.
The left print boundary is determined by moving
the aperture is quaranteed to be black (i. e., off the
right until a substantially all white area is found.
The motion to the right is continued until a substantial amount of black (the left edge of
the print) is found. The aperture is then moved so that the print boundary is near the
left edge of the aperture, and the accuracy of this move is checked.
The top print boundary is found in a similar manner, but the top line of print is
positioned in the center of the aperture.
(XIV.
COGNITIVE INFORMATION PROCESSING)
4. Line Acquisition
Line acquisition makes extensive use of the horizontal histogram (HH) directive, which is issued by the computer and executed by the RMP. When this directive is
initiated, the RMP interrogates all points at the specified y value and returns the total number of black points encountered. The heuristic used for the acquisition of a line involves the execution of the HH at selected y values. At first, the search is coarse, that is, with a significant space between successive y values. When a significant number of black points is encountered, the HH is executed approximately every fourth y line (see Fig. XIV-4a), and the maximum number of black points is computed. When the number of black points resulting from an HH is less than one-eighth of the maximum encountered
thus far, the base line of the line of text has been passed; and a fine search is performed but for increasing values of y until the number of black points is greater than one-half of the maximum previously encountered (see Fig. XIV-4b). This heuristic has resulted in reliable determination of the base line of a line of text, whether or not it contains letters with descenders.
4a. SEARCH EVERY FOURTH LINE For second and subsequent lines, the motion of the aperture of the scanner is effected to place the next line approximately in the center of the aperture, as well as to return the aperture to the left edge of the print. An end-of-page determination is made if no line can be found within the scanner aperture.
5. Character Acquisition
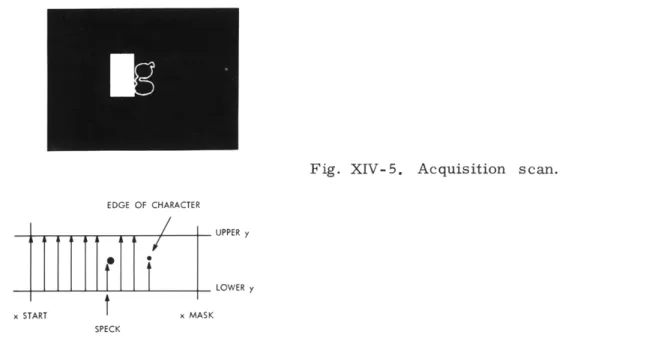
Character acquisition again makes use of another directive executed by the RMP. In this directive, a vertical scan is performed between two y values,
starting at a particular x value. If a black point is
4b. ADDITION OF FINE SEARCH UPWARD
not encountered, then the vertical scan is performed Fig. XIV-4. Line acquisition. again but indexed to the right in x. This continues
until a black point is encountered or the value of x equals that of the x mask. This scan is indicated in Fig. XIV-5. The values of the upper and lower y limits, the starting value of x and the x mask are transmitted to the RMP before the execution of the acquisition scan. Before the acquisition scan is initiated, the aperture is moved if necessary. The x mask is positioned so as to
(XIV. COGNITIVE INFORMATION PROCESSING)
guarantee that if a character is found before reaching the x mask the character will
be fully within the scanner aperture. The contour of the character is then traced. If
the extent of the character is small, it is deemed a speck, and the acquisition scan is
Fig. XIV-5.
Acquisition scan.
EDGE OF CHARACTERUPPER y
SI LOWER y
x START x MASK
SPECK
restarted to the right of that speck.
The end-of-line determination is made if the
acquisition scan has proceeded for a certain value of x with no more than specks being
found. When the first character of a line has been found, the left edge of this character
is compared with the left edge of the print on the page to see if a paragraph has been
encountered.
For succeeding characters, the distance between the left edge of the
newly acquired character and the right edge of the previously acquired character is
used to determine whether or not a space or spaces should be transmitted.
6.
Contour Tracing
The fact that the exterior contour of a letter is traced has often been considered a
key feature of the character recognition algorithm used.
Contour tracing has little to
do, however, with the character recognition algorithm, as it is primarily a means of
defining the precise location of the character to be recognized.
It is,
however, a
relatively fast technique for extracting the useful information from a fairly large area
if one is confined to an optical transducer that can test only a single point at a time.
A character in a 50
X
100 grid would require 5000 tests if every point on the grid were
to be examined.
It would, however, have only approximately 300 edge points, which
would require approximately 600 tests.
(XIV. COGNITIVE INFORMATION PROCESSING)
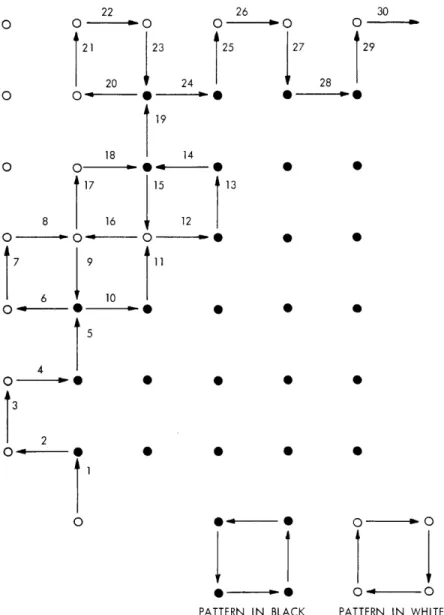
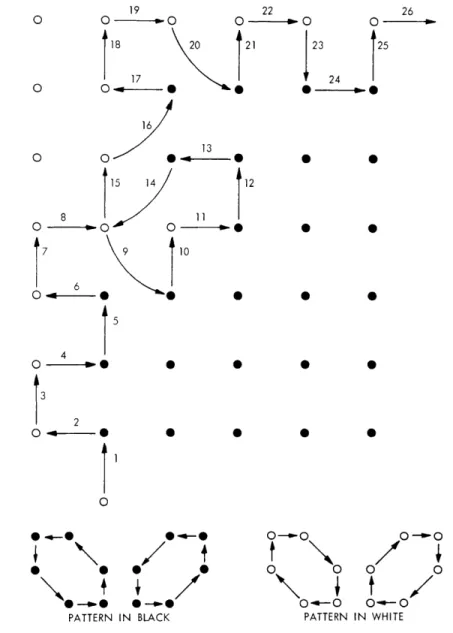
simplest digital method is the square trace (see Fig. XIV-6), which can be described by the following rule. If the last point tested was black (white), then make a 900 left (right) turn to determine which point will be tested next. This contour-trace algorithm
22 0 - 0O 26
0
NO O 30 27 28129
21 23 25 20 24 O O 19 18 14 17 15 13 8 16 12 6 10 5 O 0 * * PATTERN IN BLACK O -N O O 0 PATTERN IN WHITEFig. XIV-6. Square trace.
works well on fixed data. As a matter of choice, the interrogated points are along the edges of a letter. These, of course, are the very points that are on the borderline of being black or white. If there is even a small amount of noise present in the optical scanner, successive interrogations of the same point are likely to reveal different answers.
(XIV. COGNITIVE INFORMATION PROCESSING)
Because of the square-trace algorithm's propensity to test the same point twice, it is possible to become trapped in black or white. A variation of the square-trace algo-rithm, which is shown in Fig. XIV-7, eliminates the possibility of becoming trapped
19
o
0 -18 20 21 17 16 13 7 6 0 4 3 12 22 Do 26 O O23
2
125
* 00 * 0 * S * 0 * S 0 0 0 0 0 --ATTERN IN BLACK O-0-0t
R
O -O PATTERN 0-0 0 0t /
--IN WHITE IN WHITEFig. XIV-7. Modified square trace.
in black or white when the spatial quantization and grayness of the letter edges are such that the picture elements on the borderline between being black or white are less than two coordinate units wide. In general, this variation minimizes the square-trace algo-rithm's tendency to test the same point twice by forcing diagonal moves when the three previous points were either all white or all black.
(XIV. COGNITIVE INFORMATION PROCESSING)
As is indicated in Fig. XIV-7, it is possible for even the second algorithm to become trapped in black or white. The trapped condition is detected by the occurrence of 6
suc-cessive black (white) points and is termed a contour-trace error. As the contour-trace algorithm is realized in hardware by the RMP, the contour-trace subroutine merely has to ask for the next contour point. Of course, the subroutine must determine when to
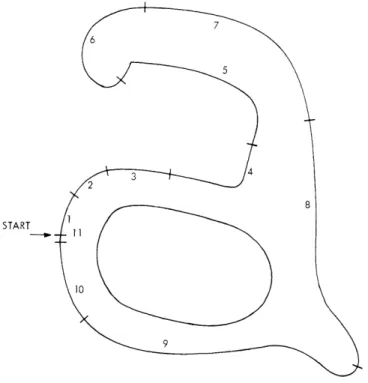
ter-minate the tracing of a character. This is accomplished by a distance calculation of the present contour point relative to the initial contour point. The distance measure that is used is the maximum of the magnitude of the displacement in x or y. To minimize the time taken for the contour trace, this distance calculation is made only as often as is necessary to be sure that the original contour point has not been bypassed. Thus, the
START
Fig. XIV-8.
Segmented contour trace.
contour of a character is traced in segments as indicated in Fig. XIV-8, where the length of the perimeter of the next segment is determined by the distance measure of the
present contour point to the initial contour point. Each time the distance calculation is made, a check is also performed to see if any contour-trace errors have occurred on the previous segment; and if such is the case, the contour trace is restarted at the end of the previous segment. The shape whose contour has been traced is considered a speck if the number of contour points is below a fixed threshold or if the initial distance calculation is less than a constant.
(XIV.
COGNITIVE INFORMATION PROCESSING)
7.
Punctuation Recognition
If the number of contour points of the shape as traced by the contour-trace routine
is smaller than a constant, then the character is considered to be a punctuation mark.
Of course, this constant could easily be computed as a function of the type-face size.
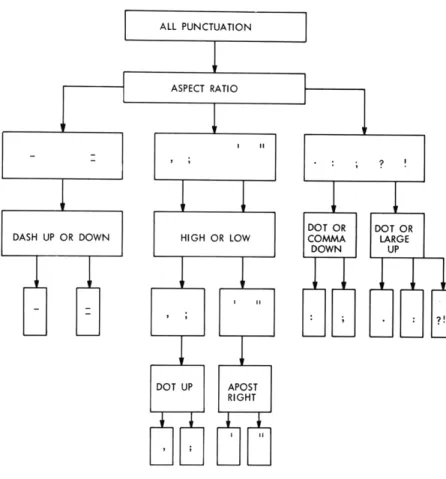
The allowable punctuation alphabet is shown in Fig. XIV-9, which also indicates the
sequence of decisions performed.
Fig. XIV-9.
Punctuation decision tree.
The first decision is based upon the aspect ratio of the shape to divide it into three
classes. A further discrimination between a dash and an equality sign is made by
searching areas just above and below the shape for the existence of another dashlike
character. It is conceivable that a shape that is not dashlike in its aspect ratio could
be found, and this would be interpreted as an error. Those punctuation marks with high
aspect ratios are further subdivided by their vertical position into two more classes,
and these classes are resolved by searching appropriate areas for possible additional
pieces of the punctuation mark. Punctuation marks having aspect ratios near unity are
QPR No. 94
-
01 XMIN START --YMIN 00 START= 1 x= y=0 CODE WORD: COORDINATE WORD:
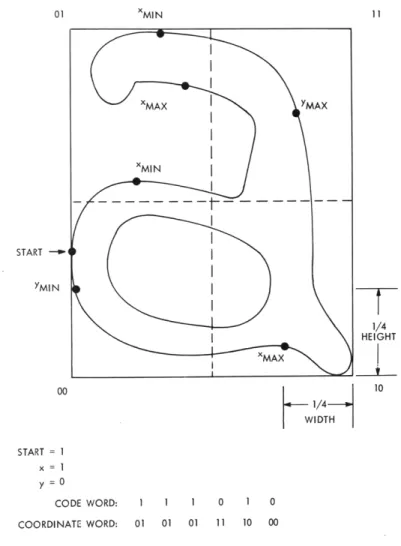
Fig. XIV-10.
Determination of extrema.
Fig. XIV-11.
Training mode display.
1/4 WIDTH 1 1 01 01 1 0 10 00
(XIV. COGNITIVE INFORMATION PROCESSING)
similarly further classified by appropriate searches above and below the shape. The existence of a large shape above a dot is taken to indicate the presence of a question or exclamation mark, and these larger shapes are treated in exactly the same manner as alphanumeric characters.
8. Character Recognition
The basic scheme for character recognition is the same one that was used in the first reading machine system and is described in detail by Clemens3 and Seitz.6 After the contour of a letter has been traced, a characteristic number or signature is generated and a table of previously encountered signatures is searched for a match. The signature is computed by the method indicated in Fig. XIV-10.
The starting point is always at the southernmost point. Local extrema are deter-mined for the horizontal and vertical directions if the excursions along the contour are greater than one-quarter of the letter height or width. That is, for example, an x
max-imum is not denoted unless one had to travel east for at least one-quarter of the letter width and then west for one-quarter of the letter width. With this scheme, minor fea-tures of the letter such as the droop in the upper left part of the letter a do not introduce
extraneous extrema. The sequence of extrema can be coded with one bit per extremum if the first extremum recorded is an x minimum and the contour trace is clockwise. In addition to this sequence of extrema, the quadrant in which it was determined is stored for each extremum. These binary sequences, along with a small amount of information concerning the aspect ratio of the letter and its position relative to the y lines found by the line acquisition procedure, comprise the signature.
In order for characters to be recognized, the particular signature must have been encountered previously; that is, the machine must have been previously trained by a sighted operator. To enable the sighted operator to recognize the letters, a visual dis-play (see Fig. XIV-11) is made. When the machine is unsuccessful in the search for a match for a particular signature, it can ask the trainer what the character is. Given this information, it can thus add to its experience. There is a certain amount of noise involved in the determination of black and white, and the presence of this noise actually simplifies the training procedure, as it appears that successive tracings of the same a have variations similar to tracings of different a's., Thus a character repeat mode is provided in which one can lock on to a particular letter and build a repertoire of signa-tures for that particular letter.
9. Multiple-Font Recognition
There are three aspects of the page-reader programs which are peculiar to a spe-cific font. These are the signature table, and the punctuation and deconfusion routines. Separate signature tables for any desired font can be generated easily by use of the
(XIV. COGNITIVE INFORMATION PROCESSING)
training mode. The deconfusion routines that may be required must be programmed to resolve confusions generated during the training process. Punctuation recognition rou-tines are probably quite universal because punctuation marks have small variations among most fonts. No provision has yet been made for truly multiple-font recognition, i. e. , when a single page contains a mixture of fonts.
10. Performance
Ten successive readings of the same page were made in order to test the accuracy of the page-reading process. The page that was read comprised 1087 characters, including letters, punctuation, spaces between words, end-of-line determinations, paragraph determinations, and an end-of-page determination. A total of 12 errors was made for a gross error rate of approximately 0. 11 per cent. Four of the errors dealt with spaces, either missing or added. A program "bug" has been found and corrected,
so that this kind of error no longer occurs. Two punctuation errors occurred in which a single quote was substituted for a double quote. There were 4 letter-substitution errors and 2 letters not recognized. Virtually all of the mistakes concerned with letters resulted from broken or touching letters. If we discount the space-related errors, the error rate was approximately 0. 07 per cent. People are normally accus-tomed to reading text with considerably higher error rates.
The speed attained by the page reader is adequate for Braille or spelled-speech output. It is, however, somewhat marginal for synthesized speech output. The average speed is 75. 5 wpm. A large amount of the time spent in reading is "wasted" while the computer is awaiting completion of carriage motions. If we subtract the time spent waiting for completion of carriage motions, the reading speed would be 119 wpm.
D. E. Troxel References
1. D. E. Troxel, F. F. Lee, and S. J. Mason, "Reading Machine for the Blind," Quarterly Progress Report No. 89, Research Laboratory of Electronics, M. I. T., April 15, 1968, pp. 245-248.
2. D. E. Troxel, F. F. Lee, and S. J. Mason, "Reading Machine for the Blind," Digest of the 7th International Conference on Medical and Biological Engineering (Stockholm, 1967).
3. C. L. Seitz, "An Opaque Scanner for Reading Machine Research," S. M. Thesis, M. I.T., 1967.
4. D. E. Troxel, "Page Position Selection for Use with a Reading Machine for the Blind," Digest of the 8th Annual IEEE Symposium on Human Factors in Electronics
(Palo Alto, California, 1967).
5. D. E. Troxel and G. F. Pfister, "Optimum Threshold Level for the Reading Machine Opaque Scanner," Quarterly Progress Report No. 86, Research Laboratory of Electronics, M.I.T., July 15, 1967, pp. 303-305.
6. J. K. Clemens, "Optical Character Recognition for Reading Machine Applications," Ph.D. Thesis, M.I.T., 1965.
(XIV. COGNITIVE INFORMATION PROCESSING)
B. OUTPUT DISPLAYS FOR THE M. I.T. READING MACHINE
As part of the continuing development of auditory and tactile displays for the M. I. T. Reading Machine system, a new series of Grade 2 translators has been implemented. Following the completion of the combined Mathematics and Literary Braille translators early this year, the need to separate the various modes has arisen. Therefore a soft-ware loader and command program has been written which permits the operator to request from dectape storage the binary programs that accept teletype input or scanner input and perform the appropriate translation of text into Mathematics or Literary Braille.
The Literary Grade 2 translator requires no training on the part of the typist. This feature was necessary because a scanner input mode could not be expected to do more than transmit the line information and paragraphing, as well as the full alphanumeric
set. The only rule that the operator must follow is that of indenting paragraphs with a tab. The nature of Braille rules requires that a line of Braille be accumulated before embossing, and this rule causes the program to complete the last typed line.
The program, which utilizes a computational dictionary approach and translates the input string from the right, produces Braille contractions close to those of authorized Braille. The chief difficulty with machine translation is the so-called syllabification rule which requires that Braille contractions not be used across syllable boundaries. The relatively infrequent violations of the rule that occur prove, however, to be quite acceptable in reading tests carried out with students at Perkins School for the Blind. All of these programs drive a modified IBM Model D typewriter whose keys have been replaced by Braille characters. This machine is driven by a robothead solenoid pack, mounted above the keyboard at a rate of 8 characters per second. Tests are under way to improve this speed.
It is also possible to replace the Braille program by Spelled Speech programs whose presentation rate is approximately 120 words per minute. All of these output modes may be used to display text from the PDP-9 systems editor.
A set of sounds for the alphanumerics of the standard keyboard is under development whose waveforms are generated with the aid of the speech synthesis utilized by the "synthesis-by-rule" programs. Since the generation of speech by rule in our laboratory is accomplished by combining phonemic elements with linear interpolation for the var-ious parameters, the speech cannot be expected to be of highest quality. The synthesis test program described here permits the operator to insert from console switches any of the relevant parameters while listening to the effect. Each of the formant frequencies and amplitudes, voicing or hiss, may be individually selected and changed at any of the 10-msec output intervals. Once a parameter has been selected, the accumulator test switches may be used to determine the time instant at which the parameters should be
(XIV. COGNITIVE INFORMATION PROCESSING)
varied. By selecting different bit positions, a contour for the duration of the sound may be generated. It is expected that handmade sounds produced in this manner and tested by the operator will result in utterances whose waveforms include the higher order approximations. Thus two sets of utterances, synthesized speech and PCM sampled
speech, will be available for comparison and psychophysical tests. The greatly decreased storage requirements of synthetic speech should lead to the use of such speech as com-puter output, provided it can approach the quality of compiled speech.
A read-only rote memory has been completed whose data store comprises more than 90 different speech sounds having durations of 100 msec each, which are to be used in the computer-controlled output of alphanumerics and mathematics. The memory con-tents is PCM sampled speech sounds compressed to an average of one-third of their nor-mal durations. Furthermore, a set of tables is stored which permits the off-line indirect addressing of the speech with ASCII, EBCDIC, and flexocodes. Thus, with electronics components under construction, this device will provide Braille programmers with an off-line readout for cards and paper tape. At present, this device is being installed on the PDP-1 computer for use as a time-shared voice output. Because of the memory
cycle time and the duration of the stored sounds, as many as 40 users may simulta-neously receive output of different utterances from this device.
Telephone data sets have been acquired and small portable keyboards attached to them in order to permit handicapped users, such as the blind, to utilize the power of a computer at their place of employment. The present system that is being implemented provides for two simultaneous users, and will provide the capability for research in three areas associated with information retrieval and rehabilitation of the handicapped. One of these is the development of suitable local stations, keyboards, and the like. The
second would concern itself with the type of software to be made available to the blind user. For example, a linking editor might make possible the employment of blind
stenog-raphers in a courtroom setting. The third area of research is that of the development and structuring of limited vocabulary voice output tailored to the vocational area that is being explored. A blind programmer should achieve a high measure of independence with a spoken set of keyboard characters, while a court stenographer might require an
entirely different set of sounds. The cost effectiveness of such a program as this would be highly attractive in the light of the possibility of bootlegging custom-engineered pack-ages on existing systems and/or providing a time-shared environment.
(XIV. COGNITIVE INFORMATION PROCESSING)
C. SPECTRAL TRANSFORMATION AS A PSYCHOLINGUISTIC TECHNIQUE: A SUMMARY
Speech communication, one of the most complex cognitive processes, has been studied from many different viewpoints, each having its own set of biases and assump-tions. At the feature-description end of the scale, there are acoustic phoneticians who try to isolate those aspects of the acoustic speech signal which are responsible for the
resulting percept. At the other end of the scale are the linguists and psycholinguists who attempt to consider the more global aspects of the speech process in terms of deep
structure, surface structure, and phrase units. There is, however, no convincing experimental evidence to indicate that speech perception is a segmentable process.
In the experiment described here, pairs of subjects learned to converse with each other through an acoustic (electronic) medium in which the spectrum of the natural
speech was rotated about a center frequency of 1. 6 kHz; that is, the high-frequency energy became low-frequency and vice versa, so that a component at 200 Hz would emerge at 3000 Hz. Spectral transformation is a kind of distortion that is not sim-ilar to amplitude distortion. As Licklider, Bindra, and Pollack1 have shown that hard-limited speech - a most severe amplitude distortion - is intelligible because the basic spectral characteristics of the signal are not changed. Spectral rotation, on the other hand, completely changes the spectral shape but does not remove any of the information.
Six pairs of subjects participated in the experiment which ran three sessions per week for seven weeks. During these half-hour conversation sessions, subjects conversed, or attempted to converse, with each other through the transformation medium (no visual contact). The instructions given to the subjects told them that their only goal was learning to communicate. In a certain sense, the subjects were hearing a speechlike signal, which was analogous to a foreign language in that most of the sounds were alien; but the syntax and semantic structure of this pseudo-language just happen to be identical to those of English. The experimental environ-ment was as unstructured as possible and, for this reason, was probably more similar to the normal speech
situation
than other speech experiments in which a restricted stimulus set is used in a particular task.The conversation sessions were tape-recorded and later analyzed for characteris-tic stages of learning. The four stages generated were acoustic probing, high-redundancy utterances, synthetic conversation, and integrated conversation.
1. Acoustic probing was the initial stage during which subjects would be uttering, for example, a continuous diphthonglike vowel as in "aaaaaeeeeoooo." Alternatively, they would practice simple monosyllabic sounds, varying one phoneme at a time, as in "mat, pat, bat, cat ... .. " It appeared that subjects were exploring the nature of the
(XIV. COGNITIVE INFORMATION PROCESSING)
medium and correlating the spoken sound with the perceived sound in much the same way
that an infant
2will talk to himself simply for the pleasure of hearing the funny noises
that he can make.
2.
High-redundancy utterances generally occurred in the second stage and are
char-acterized by conversations that are highly predictable, as in the sequence "there are
365 days in the year; there are 52 weeks in the year; there are 4 weeks in the
month; ... ." Also, subjects discovered that spelling a word that was not understoodonly required that they be able to identify the 26 elements in the alphabet set.
Many of
these conversations seemed to correspond to drill practice used in learning a foreign
language.
3.
Synthetic conversation differed from the previous stage, in that the conversations
contained significant information, and the subjects were paying attention to the ideas,
rather than to the sounds.
Difficult ideas were communicated by using "associated"
words.
For example, to transmit the misunderstood word "car" in the sentence "Did
you buy a car?," one subject went through the sequence "automobile," "Detroit,"
"Northern United States,"
"A city in Northern United States."
This is very much
the same kind of conversation that takes place when one is speaking a foreign
lan-guage that he does not know very well.
If, for example, the sentence "pass the
salt" is not understood or if one does not remember the word for salt, one might
say "pass the other spice standing next to the pepper."
4.
The last stage, integrated conversation, is simply normal conversation with
no concern for the fact that the speech signal is spectrally transformed. Actually, only
two pair really attained this level of competence, but one of these subjects
com-mented that "This is just like sitting at home chatting."
The learning situation is actually far more complicated than the summary of stages
has indicated.
Some subjects spent excessive time in one stage, while others skipped a
stage completely.
The two pairs of subjects who reached a performance level
corre-sponding to integrated conversation spent very little time in either of the first two
stages.
Rather, they attempted to converse immediately without any form of drill
prac-tice.
In order to gain a more objective measure of the learning dynamics, an extensive
series of tests was given to each subject following every conversation practice session.
These tests attempted to measure performance of sound-unit discrimination, phoneme
identification, word recognition, and sentence comprehension.
The results from the vowel tests showed that two distinct vowels almost always
remain distinct after transformation, although a semivowel and its neighboring vowel
would merge to form a new diphthong.
This is illustrated by "bill" which was heard
as "boy." Two vowels differing in the tense-lax feature were almost never confused,
even before subjects became familiar with the medium.
This could have been predicted,
(XIV. COGNITIVE INFORMATION PROCESSING)
since two of the three cues for this feature, duration and steady-state formant, are inde-pendent of the spectral transformation. The front-back place-of-articulation feature, which manifests itself as either high- or low-frequency energy, was initially reversed so that the phoneme /i/ was perceived as /u/, and vice versa. After only half an hour of exposure to the medium, however, subjects had learned to "re-invert" this feature. Only the weakly stressed lax vowels were difficult to identify.
The mode-of-articulation feature, which divides the consonants into the following classes: unvoiced fricatives, voiced fricative, unvoiced plosive, voiced plosive, and nasal, was readily perceived without any practice. Moreover, the place-of-articulation feature was never learned, either identification or discrimination. Thus, /p/ would be
confused with /t/ or /k/, but never with /m/, /b/, /v/, or /f/.
This could have been
predicted from our present knowledge of phonetic cues, since the mode cues arepre-dominantly determined by acoustic correlates that are unaffected by the spectral rotation, for example, frication, duration, pause, plosion, and so forth. The
place-of-articulation feature manifests itself, however, as a more subtle formant transition and, according to our present understanding, is a very stable feature. Very little improve-ment takes place with the consonants; the average score for identification increased from 23% to 35% between session 1 and session 8.
The correlation studies showed that a subject who was particularly adept at iden-tifying consonants, for example, was no more likely to do well in ideniden-tifying vowels than the subject who was not adept at identifying consonants. We also found that the results from the vowel discrimination and consonant discrimination tests were correlated with each other but neither were correlated with the identification tests. Thus these kinds of tasks on isolated sound units do not appear to be perceptually related.
The ability to identify words was rather poor throughout the experiment, and the results, as could have been predicted, were dependent on the kinds of words chosen for test stimuli. Thus, "bed" could easily be perceived as "bed," "dead," "beg," "dig,"
"bug," etc., since the dependable cues are the consonant place-of-articulation and the vowel tense-lax (to some degree, vowel front-back). If the stimulus word was uncom-mon, compared with the other words within the confusion class, then it would almost never be identified correctly. For isolated one- and two-syllable words the average score never exceeded 10%.
In contrast, the average scores for identifying the names of geographic locations, such as Chicago, New York, Soviet Union, increased from 28% on the first session to
72% on the last session. This set of stimulus words differs from the previous tests, in that the set of possible elements is limited and each element contains a length and a stress cue. "West Virginia" is never confused with "Greece." Also, when subjects were told that each stimulus word belonged to a particular class such as names of veg-etables the average score increased from 10% to 50%.
(XIV. COGNITIVE INFORMATION PROCESSING)
Even though the ability to perceive words never increased significantly and the ability
to identify isolated phonemes ceased to improve after several sessions, average
com-prehension of sentences continued to increase from 8% on the first session to 40% on
the last session. Moreover, the correlation studies demonstrated that sentence
perfor-mance was correlated with the geographic test results, but neither was correlated with
words or phonemes.
This has been interpreted as meaning that the mechanisms for
learning to understand transformed speech are not related to the constituent sound
ele-ments.
Rather, the subjects must learn to use other aspects of the signal, such as
stress, intonation, semantic redundancy, syntactic structure.
We observed that on the initial sentences tests the words which were perceived
cor-rectly were always the small function words, for example, "the," "and," "is, " "of." The
response to the stimulus sentence "The farmer had many chickens and cows" was, in
many cases, "The ...
and ...
"
Recognizing the medial "and" means
that the subject was able to segment the utterance based on some physical cues, since
he did not perceive enough of the words to use semantic or syntactic constraints. A few
sessions later, some content words were perceived but they were always perceived
within the phrase. Sometimes a subject's response would correspond syntactically to
the stimulus, even though none of the words was correct.
The best and most powerful
example of this was the sentence "Hoist the load to your left shoulder," which was
per-ceived by one of the subjects as "Turn the page to the next lesson." In this example there
is almost no phonetic or semantic correspondence between the stimulus and response.
The most attractive assumption to be made from this phenomenon is that syntax, in fact,
is encoded into the prosodic features in such a way that it is used to specify the function
of the words and that it helps the listener to segment the utterance into words.
Much
more emphasis is now being placed on the importance of prosodic features in speech
perception.
3From the analysis of the data it appears that the perception of sentences, at least
under the condition of transformed speech, is more dependent on the use of content
redundancy, syntactic structure, and prosodic features, than on phonetic cues or
pho-nemic sequence.
A subject who is particularly sensitive to isolated sounds does not
necessarily do better in conversing or in comprehending sentences.
A more thorough description and discussion of this experiment may be found in the
author's doctoral dissertation.
4B. A. Blesser
References
1.
J. C. R. Licklider, D. Bindra, and I. Pollack, "The Intelligibility of Rectangular
Speech Waves," Am. J. Psychol. 61, 1-20 (1948).
(XIV. COGNITIVE INFORMATION PROCESSING)
3. P. Lieberman, Intonation, Perception, and Language, Research Monograph No. 38 (The M.I.T. Press, Cambridge, Mass., 1967).
4. B. A. Blesser, "Perception of Spectrally Rotated Speech," Ph.D. Thesis, Depart-ment of Electrical Engineering, M. I. T., June 1969.
D. IMAGE RESTORATION USING THE MELLIN TRANSFORM
Up to the present time, most works on image restoration have been concerned with degrading systems that are linear and shift-invariant. We encounter in practice, how-ever, many degrading systems that are linear but shift-variant. Images degraded by linear shift-variant systems whose impulse responses are of the form
h1(r,0; ro, 00 ) = Output at polar coordinates (r, 0) attributable to an input at polar coordinates (r , 0)
= f(r ) h , 6-6 (1)
0
h
n0
may be restored by using both the Fourier and Mellin transforms.
For a degrading system with an impulse response (1), the input image u(r, 0) and the output (degraded) image v(r, 6) are related by
v(r, 6) = f(r ) h , 6- 6 u(r 6 r dr d (2)
0o n o oo o oo
o
0
Let the Fourier transform in the 0 coordinate of the function u(r, 0) be denoted by
u(r,) = u(r, 6) e dO.
Let the Mellin transforml in the r coordinate of the function u(r, 0) be denoted by 0 s-1
u(s, 6) = r u(r, 0) dr.
Thus, using (2), we obtain
v(r, X) = f(ro ) h ( r ui(ro,
k)
r dro. rThen, taking the Mellin transform in r and changing the variable of integration to x = r/r n , we have
(XIV.
COGNITIVE INFORMATION PROCESSING)
ns-l
2
s-v(s,
k)
0 r f(r ) ii(r o , X) r 0 dr 0 x s (x,k)
dx.2 Let g(r , 0 ) = f(r ) u(r ,
0
) r , thenv(s, X) = g(ns,
k)
h(s, X). (3)The original image may be restored by formally inverting (3):
00
ej 0 j c V n , Xu(r ,
0)
e r dsd. (4)0
f(ro) rZ Z2-r ZTrJ -J ° s (4)0 0 h n
In the case of the coma aberration
h (r,;r ,0 ) =1 h , . (5)
o
1
That is, f(r ) = and n = 1. r
o
Because the ray aberration for coma depends linearly on the distance of the object point from the optical axis, by assuming uniform and equal illumination over the exit pupil from any point source in the object plane, it may be seen that the impulse response for coma must have the argument dependence indicated in (5). For example, if the dis-tance from the axis of an object point is doubled, then the impulse response is spread out by a factor of two in each linear direction. The amplitude at the corresponding point would be reduced by a factor of four (by the i/r2 factor) in order to preserve the
inte-o
gral of the impulse response. When the impulse response does have the form (5), the inversion formula simplifies to
1r'O c 1 c+j C _s v(s,X)
u(r
, 6o) =
-e r dsdk.o o c -j o h(s, X)
A second example arises when an image plane is tilted out of the focal plane for a cylindrical lens system. Such a system is shown in Fig. XIV- 12 where the axis of symmetry is out of the paper. Assuming that the light distribution from r1 to r 2 is uni-form because of an object line source focused at t, we find that
sec 6 r1 =t R t 1 + - tan
0
+ -tan0
c c sec0
r2 =t R t 1 - tan 0 + -tan 6 c c(XIV. COGNITIVE INFORMATION PROCESSING) .C
Fig. XIV- 12.
t
If
<<
1 and t <<
R, then
csec 0
rlt
R1 + -- tan 0
cFor simplicity, let
sec 6
R1 +-tan
0
c
and
System geometry.sec 6
1 --
tan 0
c
and
R
1 +-tan
0
k= cS-1 Rtan 6
c
Then the impulse response is
h1I
h(r) = k-1
fol
1 r k
otherwise.
If the input is U(t) = u(T), then the output is
v(r) =
0
h U(T) dT.Taking the Mellin transform of both sides, we obtain
(XIV. COGNITIVE INFORMATION PROCESSING)
or
1
sV(s)
k-
[k
(s)-(s).
By inverting this, we obtain
u(r) = (k-1) rv'(r) + u .
Just as a time-invariant or spatially invariant system is simply characterized by its
action on an exponential function of any frequency, a system with impulse response
h (r,
r )
1 h(r/r )
o r
-s
is simply characterized by its action on r
0-s for any complex s.
That is, the response
to r
is h(s) r
-; if the input is expressed as a Taylor series, then the output is another
o
th
th
Taylor series whose n
term is the product of the nth term of the input and h(-n). Also
similar to the exponentials, the functions r-s will be increasing, decreasing, or
oscil-latory for negative, positive, or imaginary choices of s, respectively.
At present, some computer programs are being written to demonstrate this use of
the Mellin transform. One way of finding the Mellin transform of a sampled signal
-t
is to make a change of the independent variable, r
=
e
,
then to take the Fourier
trans-form. These computer results will be presented in a future report.
G. M. Robbins
References
1.
G. F. Carrier, M. Krook, and C. E. Pearson, Functions of a Complex
Vari-able: Theory and Technique (McGraw-Hill Book Co., New York, 1966).
E.
INTERACTIVE ROENTGENOGRAM ANALYSIS
In the detection of pulmonary and cardiovascular diseases and diseases of the
mediastinum and bony thorax, the chest X-ray (or chest roentgenogram) serves as
an important diagnostic tool.
The hard-copy picture also serves as a historical
marker noting the absence, progress, or development of disease.
As a result, over
seventy million chest roentgenograms are prepared in the United States every year.
To facilitate the diagnostic process, we have begun a study of techniques for the
enhancement, interpretation, and analysis of these images.
Basically we are interested in interactive mechanisms whereby the radiologist
can "converse" with the image.
As an example of this conversational process the
(XIV.
COGNITIVE INFORMATION PROCESSING)
radiologist, noticing an unusual region in the lung field, may define the region of
interest with a light pen and receive in return quantitative measurements concerning
mass density or left side-right side image comparison.
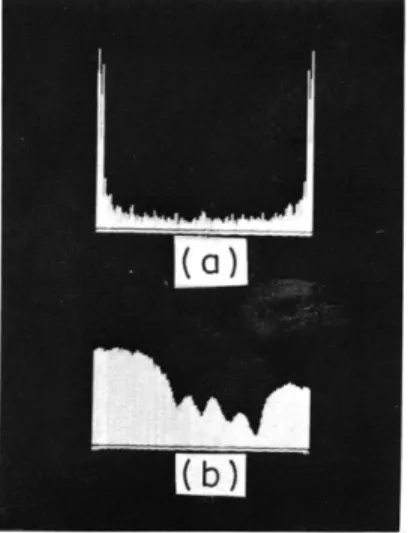
Fig. XIV-13. (a) Magnitude of Fourier spectrum vs
frequency for vertical-scan line
(a)
through chest roentgenogram.
(b) Transmittance amplitude vs vertical
position for vertical-scan line of
chest roentgenogram.
(b)
In our preliminary studies we have considered techniques for removing the perodic
rib structures from the chest image.
By examining the magnitude of the Fourier
spec-trum of scan lines taken vertically through a chest roentgenograph (Fig. XIV- 13a), we
have tried to filter out the periodic component corresponding to the rib cage. This
com-ponent is quite evident in the transmittance amplitude vs vertical position plot of
Fig. XIV-13b.
At present, we are exploring more analytic procedures for the interactive
anal-ysis of chest roentgenographs.
D. M. Ozonoff, I. T. Young
F.
SPATIAL FILTERING WITH THE NEW SCANNER
The object of the work reported here is to develop an economical and convenient
pro-cedure for performing a wide variety of spatial filtering operations.
The new scanner is a digitally controlled CRT flying-spot scanner that uses light
feedback to achieve a high signal-to-noise ratio and flat field. IBM 360 compatible tapes
are produced from pictures and vice versa. Furthermore, a certain amount of
pro-cessing can be done directly.
There are several ways in which the New Scanner can be used to achieve spatial
fil-tering, which involves an effective impulse response having negative lobes.
(XIV. COGNITIVE INFORMATION PROCESSING)
logarithm of the defocussed transparency is recorded on tape. This signal is then played back and displayed as a low-contrast negative image on the face of the scanner, which is now in focus. A new output signal is generated with this defocussed irnage serving as a mask as the transparency is rescanned. The result is that the output
B(x,y) k log B(x,y)
kblog(BT) Log
transparency
V.
Vo Log in
T(x, y) B(x,y) B(x,y)
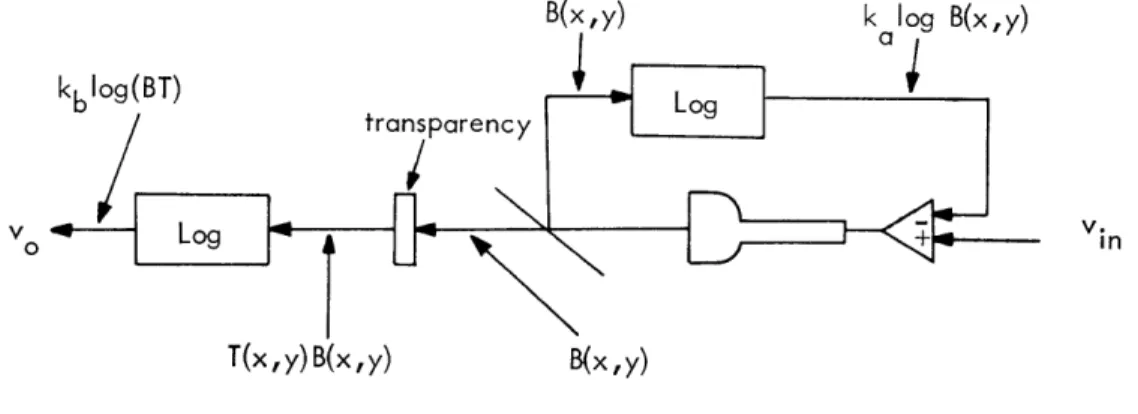
Fig. XIV-14. Scanner arrangement.
is proportional to the logarithm of the transmittance minus a constant times the log-arithm of the blurred transmittance. When this signal is displayed in the logarithmic mode the result is an image whose gamma, or contrast, can be controlled by adjusting the contrast of the negative mask.
The scanner arrangement is shown in Fig. XIV-14. By use of feedback around CRT, its brightness is controlled so that
v.
In
log B(x, y) - kina
where v. in is the voltage that was applied at the time the point (x, y) was being scanned. Since the light passing through the transparency is equal to the incident light multiplied by the transmittance T, the output voltage
v = kb[log T + log B]
v = kb
ov.
log
T +kj
In use as an ordinary scanner, v. is a constant, and the gains are adjusted so that v =
0 for the minimum transmittance in the picture, and v = 1 (actually -8 V in our sys-tem) for the maximum transmittance.
(XIV. COGNITIVE INFORMATION PROCESSING)
except that T is now replaced by T', a local space-averaged value.
The signal may now be recorded and played back, being displayed on the scanner
itself as a negative.
For clarity, we use the subscripts 1 for the initial operation and
2 for the second operation. Thus
v2in = 1 - 101 - v
1 01 - lbl [log T'+K]
log B2(x, Y) ka2 ka2
a2
a2
v20 = kb2 log T + k
(1-kbl (log T'+K))
k 1-k
K
v20 = kb2 log T - k log T' + k bl
a2
a2
J
which is the desired result. The output is kb
2log T (which is what the output would have
been with constant light) minus a variable lowpass-filtered version of the same image.
The constant term is of no importance and, in any event, there are enough parameters
to set it at an arbitrary value.
For recording, v
2 0may be displayed and photographed on the photodisplay in the
usual manner.
Note that in order for the image on the photodisplay CRT to have the
same characteristics (that is, tone scale) as the original transmittance, the CRT
bright-ness must be directly proportional to T.
Thus the logarithmic display mode must be
used.
An alternative method of achieving what appears to be an identical result is to
com-bine the logarithms of the focussed and defocussed images electrically rather than
opti-cally. The addition of logarithms produces the same result as the multiplication of
the original signals, and both the tone scale and filtering operations seem to be
per-formed in the same manner.
An additional advantage of the electrical combination is
that the coefficients may more easily be adjusted through a range of positive and
nega-tive values.
The electrical combination of focussed and defocussed images may also be
accom-plished if the signals are linear rather than logarithmic.
A consideration of the
resultant tone scale indicates that the logarithmic and linear combinations, at least
between a gamma of zero and +1, differ only slightly. The main difference seems to
be that the linear manipulations cause the resultant signal to "pivot" about 50%
bright-ness, while the logarithmic signals pivot around 50% of density, which is typically 10%
brightness.
(XIV.
COGNITIVE INFORMATION PROCESSING)
of fine detail in a 70-mm photo-fluorographic chest film (Fig. XV-15). The film was scanned in the linear mode fashion with the scanner defocussed by moving the film
Fig. XIV-15.
Original x-ray. Sampled 1024 X 1024 ele-ments, digitized at 8 bits/element, dis-played and photographed.
Fig. XIV-16.
Processed x-ray. High-frequency
compo-nents
X 2.0;
low-frequency components
X
0.5.
holder 0. 5 cm to the left and the CRT holder 0. 85 mm to the right. The defocussed image was recorded on tape and then placed back in the register with a sharp image as the latter was being scanned. The photographs (Fig. XV-16) were produced by sub-tracting from the focussed image a certain proportion of the defocussed image, the relative amplitude of the two-signal components which is indicated below the pictures. The best results were achieved with amplitudes 2.0 and 1.5, respectively, where 1.0 is the normal amplitude as shown in the original picture.
These preliminary studies have indicated that some improvements are necessary in the scanner in order to prevent a loss of some detail which may be visible in the orig-inal x ray; in particular, in order to record detail rendered at densities above 2. 0, it is necessary to improve the signal-to-noise ratio of the scanner by eliminating some low-level pickup, as well as certain errors in the operation of the circuit that integrates the photomultiplier tube current.
(XIV. COGNITIVE INFORMATION PROCESSING)
G.
MODULAR PICTURE PROCESSING PACKAGE (MP
3 )This report describes the modular picture processing package (MP
3 )which has been
developed in the Cognitive Information Processing group.
IMP
3was initiated to provide
the ability to computer process microscopic images of biological/medical significance
such as chromosome spreads, peripheral blood smears, Papanicolaou smears, and
others.
These images are characterized by having a relatively uniform background upon
which several objects are located.
In some cases, the objects themselves contain one
or more discrete subobjects.
The objects are separated from their surrounding
back-ground by a detectable change in optical density.
Although a sampled and digitized image is usually thought of as a two-dimensional
array of brightness values, MP
3treats the image as a one-dimensional array, A
AO0
Al
,A
2.
A(MXN
)[N], [Picture ... (1)
where each row of samples has been juxtaposed edge to edge between its two nearest
neighbors.
A0 , Al .... AN,' A(N+1)' .... AZN .... , A((M-lXN)+1) . A(M+N)
[N],
[
Row
1
],
[
Row
2
],
...
,
[
Row
ii
]
(2)
Here N
=
the number of columns in the original image, and M
=
the number of rows. This
scheme is a convenient way of treating a picture both conceptually and computationally.
For example, consider that the location of a point in a two-dimensional array requires
the storage of two coordinates, while a point in a one-dimensional array can be located
with only one index, a saving of 50% of storage space.
With the linear, line-by-line scheme shown in (2), an object in the picture which is
more than one row high will be represented in the array by isolated segments.
AO
0Al
...
A
A
m...
, A
n..
[N],