China's Mergers & Acquisitions: A Comparison with the United States by
Huiping Zhou
Bachelor of Engineering in Computer Science and Technology Huazhong University of Science and Technology, 2005
SUBMITTED TO THE MIT SLOAN SCHOOL OF MANAGEMENT IN PARTIAL FULFILLMENT OF THE REQUIREMENTS FOR THE DEGREE OF
MASTER OF SCIENCE IN MANAGEMENT STUDIES AT THE
MASSACHUSSETTS INSTITUTE OF TECHNOLOGY June 2010
© 2010 Huiping Zhou. All rights reserved
ARCHIVES
MASSACHUSETTS INSTITUTEOF TECHNOLOGY
JUN 0
8 2010
LIBRARIES
The author hereby grants to MIT permission to reproduce and to distribute publicly paper and electronic copies of this thesis document in whole or in part
Signature of Author:
Huiping Zhou
MIT Sloan School of Management May 7, 2010 Certified by:
Michael A. Cusumano SMR Distinguished Professor of Management Thesis Supervisor Accepted by:
Michael A. Cusumano Faculty Director, M.S. in Management Studies Program MIT Sloan School of Management
China's Mergers & Acquisitions: A Comparison with the United States by
Huiping Zhou
Submitted to the MIT Sloan School of Management on May 7, 2010
In Partial Fulfillment of the Requirements for the Degree of Master of Science in Management Studies
ABSTRACT
Mergers and acquisitions are widely researched in the United States. The M&A in China, however, is not so clear. There are plenty of successful companies in the United States growing by M&A to global powerhouse, which is seldom to see in China. This thesis presents the current status of China's M&A from a holistic perspective through comparison with global M&A. By a detailed case study of Cisco and the Bank of America, I settled a benchmark for China's peer companies through analysis covering from corporate strategy selection to M&A deal making process to operational integration. To make these findings relevant to China's context, I
researched two Chinese firms, Ping An of China and Shanghai Fosun, both of which are growing fast by serial M&A. A comparison is employed throughout both companies in the United States and China. The finding implies significant lessons for Chinese firms in these industries as well as others in a broad base regarding M&A in China.
Michael A. Cusumano, Thesis Advisor SMR Distinguished Professor of Management MIT Sloan School of Management
Acknowledgements
To my dearest wife, Liangliang Gao
For your self-giving sacrifice for our love and family
To honorable Professor Michael A. Cusumano For your invaluable support, understanding, and direction
3-Contents
Abstract ... 2
Acknow ledgem ents... 3
Contents ... 4
1. Introduction... 6
1. 1 W hat is M &A ... 7
1.2 Reasons for M ergers... 8
1.3 Process of M &A ... 10
1.4 Data Sources...12
2. China's M &A Status...13
2.1 Statistical Analysis ... 13
2.2 Top 20 Deals ... 15
2.3 Com parison with global M & A ... 17
2.4 Com parison with the United States... 20
3. M &A at the United States: A Benchm ark ... 23
3.1 Overview of corporate strategy ... 23
3.2 Cisco... 25
3.2.1 The com pany: Cisco System Inc ... 25
3.2.2 Cisco's acquisition activities and perform ance ... 27
3.2.3 Acquisition strategy... 29
3.2.4 Valuation ... 31
3.2.5 Integration... 37
3.3 The Bank of Am erica... 39
3.3.1 The Com pany ... 39
3.3.2 M erger Strategy ... 40
3.3.3 The M errill Lynch A cquisition... 42
4. M &A in China: Com parison... 47
4.1 Ping An of China... 47
4.1.1 The Com pany ... 47
4.1.2 Corporate Developm ent... 48
4.1.4 The A cquisition of Shenzhen D evelopm ent Bank ... 52
4.1.5 The Minority Share Acquisition of Fortis NV: Experienced Failure ... 57
4.1.6 Com parison w ith Bank of Am erica... 59
4.2 Shanghai Fosun ... 60
4.2.1 The Com pany ... 61
4.2.2 Corporate D evelopm ent... 63
4.2.3 M & A strategy... 63
4.2.4 The A cquisition of N anjing Iron & Steel ... 66
4.2.5 Comparison with other diversified conglomerates... 72
5. Conclusion ... 74
5.1 What leads to a successful M&A? Learning from both the U.S. and China... 74
5.2 China context... 76
5.3 Pitfalls for China's M &A ... 76
5.4 Questions left for further research... 78
References... 79
5-1. Introduction
As China is widely expected to grow to be the world's second largest economy by 2010, it is now a rapidly expanding mergers and acquisitions market. Although its economic activities have
attracted substantial academic research, there's no clear framework to understand China's mergers and acquisitions from a corporate development perspective. This thesis intends to do a comparative analysis for China's mergers and acquisitions through several case studies.
I will discuss two companies in the United States, Cisco and the Bank of America, both of which have made plenty of serial M&A to grow the companies and to some extent are very successful. In contrast, there are not too many Chinese companies who employ an M&A strategy to either grow the firms or try to develop competitive advantages. Whether M&A can lead to competitive advantages is still a highly debating research topic and hence my research will focus on the other part, which is to grow corporations by M&A. Of those limited Chinese firms with serial M&A deals, I will dig deep down to two firms, Ping An of China and Shanghai Fosun, both of which are showing a clear M&A strategy and grow relatively fast.
By a deeper understanding of their Mergers and Acquisitions activities within each other's social, political, economics and firm wide context, I will develop a qualitative approach to grow firms by M&A.
The structure of this thesis consists of five parts. The first part is an introduction and I will go through some fundamental knowledge of mergers and acquisitions. The second part elaborates on the current circumstance of China's M&A by statistical analysis of M&A deals in China as well as a comparison with global wide and M&A in the United States. The third part goes to the
case study of companies in the United States while the fourth part focuses on companies in China. Then the last part is a conclusion.
1.1 What is M&A
Before I start to go over major corporations, I begin a brief overview of mergers and acquisitions. Mergers and acquisitions is a kind of corporate restructuring. A merger is two separated
companies combined together to form a new company while an acquisition is one company purchased by another company with no new company formed (Brealey, Myers, and Allen 2008). Generally, there are three kinds of mergers, horizontal merger, vertical merger, and conglomerate mergers (Oster 1999). Horizontal mergers are combinations of two firms in the same line of business. A most recent example is the Bank of America merger with Merrill Lynch in year 2008. Both Bank of America and Merrill Lynch are in the financial service industry and both have broad and overlapped business scope. Vertical mergers involve companies that are at different stages of production. From the perspective of the value chain, it is usually a firm merging backward to the supplier side or forward to the customer side. The failed Chinalco-Rio Tinto deal is a vertical merger with Chinalco trying to move into raw material source by partnership with the world's leading international mining group. Conglomerate mergers are combinations of firms that are neither direct rivals nor producers in the same production areas. As in Shanghai Fosun's case, Fosun has such a diversified business range largely resulting from conglomerate mergers.
7-1.2 Reasons for Mergers
The motivation for companies to make mergers and acquisitions varied. Typically, there are six main reasons for mergers.
Growth
Growth is one of the most commonly cited reasons for mergers. A firm grows either by organic growth which is internal growth and means growth through continuous operation and corporate development, or by unity with external part, which is mainly merger. However, organic growth may be too slow, as it usually requires a firm to eventually expand market share and improve corporate efficiency. Therefore, a merger with another firm may soon grow company's size and scale. Merger can also bring new products and new processes. An example is eBay's acquisition
of Paypal, by which eBay enters online payment area and get a secure way for eBay customers to pay for any goods they auction online. A company can also enter new geographic market by a merger.
Market Power
This is the least cited reason by the merging companies. In the steel industry, major iron and steel firms merge with each other to gain more market power from both raw material supplier and downward buyers. However, market power usually leads to monopoly and hence this kind of merger is constrained by anti-trust laws.
Operational Synergies
Operational synergies are another reason cited very often. If two firms have partially shared value activities, their merger could have cost savings because of economies of scale. For instance,
two steel firms can share operational facilities and thus save cost. Companies can improve processes too by aligning two firms' operation. Each company has its own advantage on certain process and hence a merger makes both companies take advantage of each other. In addition, revenue could increase as post-merger firm will have more product lines and therefore more revenue sources.
Diversification
A firm can enter new business area by merging with a firm in a different production area and thus allocate capital efficiently relative to the market. As well known in corporate finance field, less than perfectly correlated cash flow streams provide diversification and decreases the cost of capital, especially to some extent in emerging markets where well-developed capital markets are
still rare. Besides, diversification creates value by dispersing managerial talent. As in many cases, managerial talent is scarce buy scalable. Hence, diversification can let good managers manage
even bigger firms.
Managerial Entrenchment
This incentive for mergers mainly comes from agency problem, as managers maximize their own return rather than shareholders'. First, diversified cash flow makes firm safer and less likely to bankrupt, and then provides them job security. Second, managers have incentive or motivation to run a larger company just for excessive pride.
Strategic Reasons
Sometimes, even if an acquisition or merger has a negative cash flow, it may provide strategic options for potential cash flow in the future.
9-1.3 Process of M&A
A merger or acquisition begins from M&A strategy. As elaborated from the last past, there are numerous motivations to make M&A, so companies have to fully understand why they make M&A. The reason should essentially fit in the M&A strategy of the firm. For instance, in the
case of Mexico CEMEX (Lessard and Lucea 2008), its acquisition strategy is very clear and serves the entire expansion strategy of the firm.
After identifying M&A strategy, company will source ideal target for M&A. It is usually a tough process and very uncertain. Beginning from selection plan, acquirer Company will narrow down
targets to a certain industry and initial several targets companies. The real sourcing process would be done in several rounds. The first round is relatively quick as acquiring firms would only select those targets who match their M&A strategy. The second round is more about initial evaluation of the targeted company based on the information gathered.
As long as M&A target is cleared, the M&A process goes to due diligence. Due diligence is the process of thorough analysis of targeted company in order to make M&A decision. Before acquiring companies make due diligence, they would prepare due diligence model, timeline, and so on. Then they will conduct due diligence, including collecting all required information in the model, writing M&A analysis report, and even discussing with intermediary agencies about
cooperation. After this process, acquiring firms will evaluate merger opportunities and thus make decisions
By making due diligence, acquiring firms would choose the target to invest. Deal structure is an agreement made between acquirer and target defining the rights and obligations of the parties
involved. In terms of M&A strategy, integration process, capital tools, financing cost, and risk, acquiring firms would define the entire deal structure with targeted company. With the service of law firms and financial advisory firms, acquiring firms would then standardize term sheets and begin to negotiate with the company targeted. As long as both parties reach to an agreement for all terms, they will sign M&A agreement and finish deal negotiation.
Once M&A deal is sealed, the integration process begins. Integration is an important step of successful M&A. Whether integration is successful could determine the success of entire merger, including strategic goal, operational synergy, and financial forecast. Integration usually involves the integration in corporate culture, management, operation and production, human resources, and so on. Historic research shows 50% of failed mergers resulted from unsuccessful integration.
Why most of mergers and acquisitions fail?
Previous research has seen frequent failure in mergers and acquisitions. In 1967, Kitching found more than 50% of M&A in the United States failed or not worthwhile(Kitching 1967). More recent research by Sirower found 65% of acquisitions fail to benefit from the acquiring companies (Sirower 2000).
Academic research in the past had tried to suggest some reasons why most of M&A failed. In a research concluded by Hunt, he suggested that multiple context variables, such as acquisition strategy, ownership, specific industry, quality of buyer, or insufficient information, are not sufficient to explain the success or failure of acquisitions (Hunt 1990). Hunt's research was based on a critical examination of previous academic analysis, including Kitching's. In his
conclusion, he suggested that rather than focusing on single-context variable, combination of the context variables offered a better way to explain the divergence in success and failure of M&A.
11-He came to a major conclusion that it was the behavioral process initiated by targeting and continuing through bidding, negotiating and implementing that hold the key to success. (Hunt 1990)
Rather than discussing generally success or failure factors of M&A, this thesis will focus on real merger cases and compare M&A in the United States and China in previous research, as
reflected in the research objective at the beginning of this chapter.
1.4 Data Sources
This thesis highly depended on data availability, time frame, detailed deal data on M&A deals, in China, the United States and globally. I get all these first hand data mainly from the Zephyr Database at MIT Libraries. Information related to specific companies is mainly retrieved from Capital IQ and Factiva databases.
2. China's M&A Status
2.1 Statistical Analysis
After the overview of M&A in part 1, I will review the current situation of China's M&A in the past decade to set the basic understanding. Only in year 2009, there are 2526 (Zephyr 201 Ob) M&A deals in China, including all acquirers and targets in mainland China. Deal types cover acquisitions and mergers, with IPO, planned IPO, institutional buy-out, joint-venture,
management buy-in, management buy-out, demerger, minority stake and share buyback deals excluded. Total M&A deal values reach $156 billion. M&A activities in the first decade of 21st century is a booming era for China, which I will conduct statistical analysis for the period of year 2001 to 2009.
13-OM Deal Value($'000) -- Deal Number $200,000,000 - 3,000 $180,000,000 -$160,000,000 -2,500 $140,000,000 $120,000,0000 $120,000,000 $100,000,000 1,500 $80,000,000 1,000 $60,000,000 -$40,000,000 500 $20,000,000 -$0 . 04 2000 2001 2002 2003 2004 2005 2006 2007 2008 2009
Figure 1: Mergers and Acquisitions deals in mainland China from 2000 to 2009
Source: Retrieved from Zephyr Database 2000, 2001, 2002, 2003, 2004, 2005, 2006, 2007, 2008, 2009
I searched all the M&A deals data from 2000 to 2009 in mainland China from Zephyr database as well as the deal value, as showed in figure 1. It is clear to see a rapid growth in terms of yearly total deal numbers and deal values. In 2000, there are only 96 M&A deals. This number
increased to 2526, more than 26 times. The deal value also increased from $3 billion at 2000 to $156 billion at 2009, more than 52 times bigger. Previously I assumed the M&A activities would have had a period of decline from 2000 to 2003, due to the high-tech bubble burst in 2000. However, it is interesting to see the M&A activities in mainland China still maintained its upward increase during this period, which may partially because of China's continuous strong economical growth. However, as China's economy is connected more closely with global
economy, the recent financial crisis displayed a different pattern. From 2007 to 2009, the total M&A deal value reduced from $176 billion at 2007 to $156 billion at 2009. Although the total deals number is still in its upward routine, the average deal value decreased from $84 million at 2007 to $62 million at 2009.
2.2 Top 20 Deals
One of the water marks of M&A activities is the top deals ranking. I examined Zephyr database and searched the top 20 M&A deals in mainland China (Figure 2). The biggest M&A deal so far is the Central Huijin Investment Co.'s investment into the Agriculture Bank of China, a deal valued at around $19 billion. The major reason behind this acquisition is China's financial system reform which intends to take major state-owned banks to go public.
Of these top 20 deals, nine deals are in financial service sector, which represents the ongoing reform in Chinese financial system and banking sector. Three deals are in telecom industry, which is dominated by major state-owned enterprises and also involved drastic reform by
Chinese central government. Among the rest, another four deals are dominated by power, iron & steel, oil & gas companies, all of which are state-owned enterprises. Private companies in China are rare to see in these big deals.
15-Date All Deal values
Acquiror name Target name a e Deal type ($ '000)
# announced ($ '000)
Central Huijin Investment Co., Ltd China Yangtze Power Co., Ltd
3. Yanbian Road Construction Co., Ltd
4. China Mobile (Hong Kong) Ltd
5. China Netcom Group Corporation (Hong
Kong) Ltd
6. Shanghai Baosteel (Group) Co., Ltd 7. Bank of China Ltd
8. China Unicom Ltd
9. Central Huijin Investment Co., Ltd 10. Yanzhou Coal Mining Co., Ltd
11. Shanghai Urban Agro-Business Co.
12. China Merchants Bank Co., Ltd
13. China COSCO Holdings Co., Ltd
14. Wuhan Urban Construction Investment &
Development (Group) Co., Ltd.
15. China Merchants Bank Co., Ltd
16. Aluminum Corporation of China Ltd 17. Investors
18. Huaneng Power International Inc. 19. Shijiazhuang Refining-Chemical Co.
20. Beijing Huaer Co., Ltd
Agricultural Bank of China, The
China Three Gorges Project Corporation's electricity generation assets
GF Securities Co., Ltd-old
Anhui Mobile Communications Ltd China Network Communications Group Corporation's certain assets in four Chinese provinces
Guangzhou Iron & Steel Enterprises Group Singapore Aircraft Leasing Enterprise Ltd Unicom New Century (BVI) Ltd
China Everbright Bank Co., Ltd Felix Resources Ltd
Haitong Securities Co., Ltd Wing Lung Bank Ltd
COSCO Bulk Carrier Co., Ltd
Hu Han Rong Railway Hubei Co., Ltd Wing Lung Bank Ltd
Baotou Aluminum Co., Ltd BOE Technology Group Co., Ltd SinoSing Power Pte Ltd
Changjiang Securities Co., Ltd (old) GuoYuan Securities Co., Ltd (old)
11/6/2008 Acquisition 50% 8/15/2009 Acquisition 9/10/2006 10/5/2001 9/12/2005 3/19/2008 12/15/2006 11/21/2002 11/8/2007 8/13/2009 12/27/2006 5/30/2008 9/4/2007 7/7/2008 Acquisition 100% Acquisition Acquisition 100% Acquisition Acquisition 100% Acquisition 100% Acquisition 70.92% Acquisition 100% Acquisition 100% Acquisition 53.119% Acquisition Acquisition 98.227% 9/30/2008 Acquisition increased 6/29/2007 11/6/2008 4/29/2008 1/24/2007 3/14/2007 from 53.119% to 100% Acquisition 100% Acquisition 60.365% Acquisition 100% Acquisition 100% Acquisition 100% 18,986,695 15,716,274 12,051,167 8,573,000 4,455,089 4,174,439 3,245,000 2,680,000 2,690,088 2,914,397 2,309,511 2,485,368 2,161,525 2,268,099 2,195,398 1,784,054 1,754,873 1,610,964 1,393,424 1,357,909
Figure 2: Top 20 M&A deals in mainland China from 2000 to 2009
2.3 Comparison with global M&A
To explore further China's M&A, it is better to compare global M&A with China. Figure 3 is the data of global M&A deal numbers for the past decade. Due to database limitation, total deal value for each year is not available.
U Global M&A Deal Number 45,000 40,000 35,000 30,000 25,000 20,000 15,000 10,000 5,000 0 2000 2001 2002 2003 2004 2005 2006 2007 2008 2009
Figure 3: Global M&A deal number for 2000 to 2009
Source: Zephyr Database, Mergers and acquisitions only, 2000, 2001, 2002, 2003, 2004, 2005, 2006,2007, 2008, 2009
After comparing figure 3 with figure 1, I found the macro trend of China's M&A is similar with that of global M&A. Global M&A also sees a decline from 2007 to 2009. But at the beginning of this decade, global M&A already has a huge base while China is still in its infant time to make M&A deals at early 2000s.
17-Figure 4 is the top 20 M&A deals globally from 2000 to 2009. None of these mega deals is in China. Of these 20 deals, six deals are in financial service sector while that of China is eight. Three of the world's top 20 deals lie in telecom industry compared with five in China. The industry pattern is more or less the same in China as in other parts of the world. The financial
service and telecom industries in the past decade have experienced extensive consolidation by mergers and acquisitions. However, there are also mega deals in pharmaceutical, consumer
goods, media industries in the world's top 20 deals but none in China's. Partially the reason is due to different economical stage of China and the world. But it is possible to see these deals coming out in the future as China's economy continues its rapid raise.
Acquiror name
Vodafone Airtouch plc America Online Inc. RFS Holdings BV Pfizer Inc.
Royal Dutch/Shell Group Gaz de France SA Comcast Corporation
Wells Fargo & Company Inc. Pfizer Inc. AT&T Inc. Sanofi-Synthelabo SA 12 NGMCO Inc. 13 14 15 16 17 18 19 20 Figur Glaxo Wellcome plc Pfizer Inc. JP Morgan
Procter & Gamble Company
Commonwealth Bank of Australia Ltd InBev SA Bank of America Bank of America 4: Top 20 M&A Target name Mannesmann AG Time Warner Inc.(old)
ABN Amro Holding NV
Warner-Lambert Company
Shell Transport & Trading Co plc, The Suez SA AT&T Broadband LLC Wachovia Corporation Wyeth BellSouth Corporation Aventis SA
General Motors Corporation's good assets Smithkline Beecham plc
Pharmacia Corporation Bank One Corporation Gillette Company, The
PT Bank Arta Niaga Kencana Tbk Anheuser-Busch Companies Inc. Corporation Merrill Lynch
Corporation FleetBoston Financial Corporation deals in the world from 2000 to 2009
Deal type Acquisition 100% Acquisition 100% Acquisition 100% Acquisition 100% Merger 100% Deal values ($'000) $194,759,649 $181,950,000 $112,233,623 $90,000,000 $87,044,189 Date 4/02/2000 10/01/2000 29/05/2007 7/02/2000 27/06/2005 3/09/2007 19/12/2001 3/10/2008 26/01/2009 6/03/2006 26/04/2004 2/06/2009 Acquisition 100% 17/01/2000 15/07/2002 14/01/2004 28/01/2005 8/01/2007 14/07/2008 15/09/2008 27/10/2003 Acquisition Acquisition 100% Acquisition 100% Acquisition 100% Acquisition increased from 57% to 83% Acquisition 100% Acquisition 100% Acquisition 100% $72,365,885 $72,000,000 $68,111,985 $68,000,000 $67,000,000 $66,642,564 $66,600,000 $64,777,147 $60,000,000 $57,405,000 $57,000,000 $52,329,420 $52,000,000 $50,000,000 $47,000,000
Source: Zephyr Database, Top 20 deals ranking globally, Time period 2000-2009
- 19-Acquisition 100% Acquisition 100% Acquisition 100% Acquisition 100% Acquisition 100% Acquisition 100%
- Bid 2 -Increased offer
2.4 Comparison with the United States
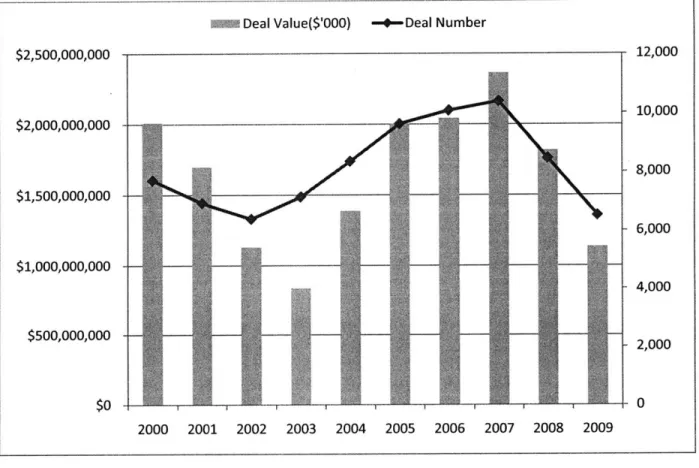
A comparison with M&A in the United States (Figure 5) is also necessary to explore the difference between these two markets and get some hints for China's M&A. The scale and size
of M&A deal in U.S. is much larger than those of China. The total deal value in U.S. is way above $1 trillion except in year 2003. Deal number is also more than 4000 every year but 2003. While in China, only beginning from 2006, China begins to see hundreds of billion dollars deal. The entire pattern is also different. From figure 5, it is obvious to observe U.S. as a matured market with just a fluctuated pattern for both deal number and deal value. However, China appeared a strong increasing pattern for its M&A market in figure 1.
OM Deal Value($'000) -+-Deal Number
$2,500,000,000 12,000 10,000 $2,000,000,000 8,000 $1,500,000,000 6,000 $1,000,000,000 4,000 $500,000,000 2,000 $0 0 2000 2001 2002 2003 2004 2005 2006 2007 2008 2009
Figure 5: Mergers and Acquisitions deals the United States from 2000 to 2009
Source: Retrieved from Zephyr Database 2000, 2001, 2002, 2003, 2004, 2005, 2006, 2007, 2008, 2009
Figure 6 is the top 20 M&A deals in U.S. from 2000 to 2009. The biggest M&A deal ever happened before the high-tech bubble burst at 2000, when America Online merged with Time Warner with a deal value nearly of $182 billion. In contrast with figure 4, 13 out of the top 20 M&A deals in U.S. are in the global top 20 M&A deals list. This feature confirms with U.S.'s dominant position in the world's economy as well as the global financial market.
-21-# 15 Qwest Communications International Inc. 16 JDS Uniphase Corporation 17 Cingular Wireless LLC 18 US Government 19 Chevron Corporation 20 Schering-Plough Corporation Acquiror name
America Online Inc. Pfizer Inc.
Comcast Corporation
Wells Fargo & Company Inc. Pfizer Inc.
AT&T Inc.
NGMCO Inc.
Pfizer Inc.
JP Morgan
Procter & Gamble Company InBev SA
Bank of America Corporation Bank of America Corporation Roche Holding AG
US West Inc. SDL Inc.
AT&T Wireless Services Inc. American International Group Inc.
Texaco Inc.
Merck & Company Inc.
Deal type Acquisition Acquisition Acquisition Acquisition Acquisition Acquisition Acquisition 100% 100% 100% 100% 100% 100% 100% Deal values ($'000) $181,950,000 $90,000,000 $72,000,000 $68,111,985 $68,000,000 $67,000,000 $66,600,000 18/07/1999 Acquisition 100% 10/07/2000 17/02/2004 10/11/2008 16/10/2000 9/03/2009 Acquisition 100% Acquisition 100%
Acquisition unknown stake % Acquisition 100%
Acquisition 100% Target name
Time Warner Inc.(old) Warner-Lambert Company AT&T Broadband LLC Wachovia Corporation Wyeth
BellSouth Corporation
General Motors Corporation's good assets
Pharmacia Corporation Bank One Corporation Gillette Company, The
Anheuser-Busch Companies Inc. Merrill Lynch
FleetBoston Financial Corporation Genentech Inc.
Figure 6: Top 20 M&A deals in the United States from 2000 to 2009
Source: Retrieved from Zephyr Database, Top 20 completed deals ranking in the United States, Time period 2000-2009 Date 10/01/2000 7/02/2000 19/12/2001 3/10/2008 26/01/2009 6/03/2006 2/06/2009 15/07/2002 14/01/2004 28/01/2005 14/07/2008 15/09/2008 27/10/2003 12/03/2009 $60,000,000 $57,405,000 $57,000,000 $52,000,000 $50,000,000 $47,000,000 $46,800,000 $41,895,000 $41,000,000 $40,717,000 $40,000,000 $39,000,000 $37,654,154 Acquisition 100% Acquisition 100% Acquisition 100% Acquisition 100% Acquisition 100% Acquisition 100%
Acquisition increased from
3. M&A at the United States: A Benchmark
Since the United States economy is much more matured than China's, it would be a good approach to discover how U.S. corporations leverage M&A to grow and then compare that with Chinese firms. I will go over the entire M&A process within each firm's context, try to find the evolution of these firms' M&A strategies and how they perform and integrate M&A deals. To set the benchmark, I selected two firms, Cisco Systems and the Bank of America, both of which are representative companies in their industries by market size and position.
3.1 Overview of corporate strategy
Successful mergers and acquisitions always fit in overall corporate strategy. Different corporate strategy leads to different M&A strategy and hence totally different integration process. For instance, if companies take a portfolio management strategy, then each acquired firm will operate relatively independent while holding company acts as financial holding entity. So in this part I will take a brief review of corporate strategy to clarify the relation between corporate strategy and M&A strategy. The content bases mainly on Porter's paper in 1987, From Competitive Advantage to Corporate Strategy (Porter 1987).
Nowadays most of firms are to some extent diversified. They have more than one product line and operate in more than one market. Whether diversification can add competitive advantage or not is not the argument of this thesis, so I will focus more on the four types of corporate
strategies used by diversified firms. A diversified company has two levels of strategy: business
-23-unit (or competitive) strategy and corporate (or companywide) strategy. M&A strategy relates more to corporate strategy.
In terms of Porter's study, there are four concepts of corporate strategy that have been put into practice: portfolio management, restructuring, transferring skills, and sharing activities. The first two require no connections among business units while the second two depend on them.
Portfolio Management: This concept is employed by corporations who diversified primarily by acquisitions. A company acquires undervalued, sound firms, whose business are not in the same industries as existing ones. Under this circumstance, senior management usually serves as review roles guiding all units in the portfolio. To ensure success of portfolio management strategy, the corporation usually is a private company or operates in underdeveloped capital markets.
Restructuring: Like portfolio management strategy, restructuring strategy does not need the new businesses to be related to existing units. The only one needed is unrealized value and potential. A company with restructuring strategy is an active restructurer of business units, not a passive role in portfolio management roles. As soon as restructuring finished and results are clear enough, parent sells off the unit as it no longer can add value to parent corporation.
Transferring skills: If corporation has skills that are important to competitive advantages in target industries and it has capacity to make the transfer of skills among units continuously, then it will build a transferring skills strategy. Different business units usually have different value chain. The skills and knowledge to perform primarily activities in these values chains can transfer among these business units.
Sharing activities: For the primarily and supporting activities in the value chains of different business units, sharing activities can be a corporate strategy. That means activities in current
business units can be shared with new business units to gain competitive advantages. According to Porter's competitive advantage theory, the ability to share activities is a potent basis for corporate strategy because sharing often enhances competitive advantages by raising diversification or lowering cost.
3.2 Cisco
Cisco Systems, a company founded by two former graduate students then staff member of Stanford University at 1984(Gawer and Cusumano 2002), is now the world's largest maker of computer networking equipment. Headquartered in San Jose, California, Cisco has more than 65,000 employees and annual revenue of US$36.11 billion as of 2009. As of Nov 2, 2009, Cisco has a market capitalization of $129 billion (Cisco 201 Oc), way above its main competitors. This company employed an M&A strategy to grow sustainably and is a perfect benchmark for Chinese firms.
3.2.1 The company: Cisco System Inc
Cisco Systems, Inc. designs, manufactures, and sells Internet Protocol (IP)-based networking and other products to the communications and IT industry worldwide. The company offers routers that interconnect public and private IP networks for mobile, data, voice, and video applications; switching systems, which provide connectivity to end users, workstations, IP phones, access points, and servers; application networking services; home networking products, such as voice and data modems, routers and gateways, Internet video cameras, home entertainment storage, wireless home audio, and home network management software; and network and content
25-security, email, and Web security products. It also provides storage area networking products that deliver connectivity between servers and storage systems; unified communication products to integrate voice, video, data, and mobile applications on fixed and mobile networks; video systems, including digital set-top boxes and digital media products; and wireless systems. In addition, Cisco offers optical networking products, cable access, and service provider VoIP services; and Cisco TelePresence systems and exchange services, physical security and video surveillance, digital media systems, and building systems to manage energy efficiency. It serves enterprise businesses, public institutions, telecommunications companies, commercial businesses, and personal residences through systems integrators, service providers, resellers, distributors, and retail partners. Cisco Systems has strategic alliances with Accenture Ltd; AT&T Inc.; Cap
Gemini S.A.; EMC Corporation; Fujitsu Limited; Intel Corporation; International Business Machines Corporation; Italtel SpA; Johnson Controls Inc.; Microsoft Corporation; Nokia; Nokia Siemens Networks; Oracle Corporation; SAP AG; Sprint Nextel Corporation; Tata Consultancy
Services Ltd.; VMware, Inc.; and Wipro Limited (Capital IQ 2010b).
Here is a brief history of the company (Cisco 201 Ob). In Dec 1984, computer scientists, Len Bosack and Sandy Lerner, from Stanford University found Cisco Systems. The company is named for San Francisco, gateway to the Pacific Rim. Beginning to experiment with connecting detached networks, Bosack and Lerner run network cables between two different buildings on the Stanford campus, connecting them first with bridges, and then routers. Bosack and Lerner, with the expertise of Greg Satz and Kirk Lougheed, work to enable disparate networks to talk with each other and share information reliably. But in order for the networks to be truly interconnected, a technology has to be invented that can deal with the disparate local area protocols. With that idea in mind, the multi-protocol router is born. Eventually, Cisco became a
market leader in networking market in late 1980s and 1990s. The company went public on Feb 16, 1990 and continued its rapid growth in 1990s thanks to the dramatic growth of the internet after 1995. Cisco's current CEO, John Chambers, a former IBM sales person, joined the
company in 1991 and became CEO since 1995. As of the second quarter of 2009, Cisco captures leading market share in its main segments. (Figure 7)
Web Conferencing Networked Home Routing: Edge/Core/Access
Storage: Area Networks Wireless: LAN Voice Switching: Modular/Fixed Digital Video: IPTV Security
* Cisco: Market Share Leadership
-
--
---
--
-
--
--
--
--
--
~-
-
--
-
immI
0% 10% 20% 30% 40% 50% 60% 70% 80%Figure 7: Market Share Leadership of Cisco in computer networking industry Source: Retrieved from Cisco Website, 2010
3.2.2 Cisco's acquisition activities and performance
In Cisco's 26 years history, it has acquired 137 companies (Figure 8), that is average 5 deals per year. The most active period is the high tech booming period from 1999 to 2000, when Cisco
27-acquired 18 and 23 firms, respectively. 9 7 7 6 1 2 1993 1994 1995 1996 1997 1998 1999 2000 2001 2002 2003 2004 2005 2006 2007 2008 2009
Figure 8: Acquisitions amount of Cisco from 1984 to present
Source: Retrieved from Cisco Website, 2010
Before I study Cisco's acquisition strategy, let's examine its performance first. At 1990 when Cisco went public, its total revenue was just $69.8 million (CapitalIQ 2010c) while market cap was slight above $1.8 million. At FY2009, Cisco's total revenue jumps to $36 billion, 517 times bigger than that of 1990. As of Feb 14, 2010, its market cap is $136.4 billion (CapitalIQ 2010c). Another perspective to conduct performance review is to look at the companies' stock
performance. If the ongoing stock return to shareholders is by largely increasing, then the M&A activities must be successful. Figure 9 is the stock prices of Cisco from its public offering to Feb
15, 2010, with a comparison with S&P 500 and NASDAQ. Clearly, Cisco's stock performance is
E Cisco: Acquisitions number each year
23
far better the market's benchmark. Except for the high tech bubble period of 1999 to 2003, the stock price of Cisco maintains its upward trend and rewards its shareholders significantly.
Feb 2010 :=CSCO 21.76 = mGSpC 1.075.51 S^1XC ,183.53 YAMc SSes NASDAQ 2008 1990 1992 1994 1996 1998 2000 2002 2004
Figure 9: Cisco stock prices
Source: Yahoo Finance, Max time frame, compare with S&P 500 and NASDAQ, Feb 15, 2010
3.2.3 Acquisition strategy
As previous part examined, Cisco is pretty successful in terms of its massive acquisitions. In a leading research conducted by Gawer and Cusumano in 2002, they found Cisco's acquisitions were very much strategic and focusing on building its platform leadership (Gawer and
Cusumano 2002). In their research, Gawer and Cusumano demonstrated companies, such as Cisco, Intel, and Microsoft, can grow and sustain to be world-class leading company by
becoming platform leaders-companies that provide the technological foundation on which other products, services, and systems are built.
Cisco's origin went back to its innovation of the internet router. Internet router itself was a platform that could be built and used by other products and services. However, Cisco soon
-29-40WA
ZOKOA
realized the transition happened in information technology industry, which was transforming dramatically from personal computer to internet-based networking. In this sense of industry environment change, Cisco defined itself as a platform leader by providing much of the
infrastructure hardware and software of computer network. A more detailed articulation could be referred in Gawer and Cusumano's publication in 2002, Platform Leadership: How Intel,
Microsoft, and Cisco Drive Industry Innovation.
Cisco particularly looks for acquisitions that capitalize on market disruption through new technologies and new business models. Its acquisition strategy emphasizes building a market by extending the technology and business model by a global view which pursues acquisitions that present the best opportunities for business and technology innovation coming from both established and emerging markets.
At the corporate strategy level, I categorize Cisco's corporate strategy as sharing activities. Cisco's existing business and acquired business share a very similar value chain, which gives Cisco space to create synergy. Take the company's acquisition of WebEx Communication in 2007 as an example.
The acquisitions should fit Cisco's overall growth strategy, which is based on identifying and driving market transitions. Any acquisitions should help Cisco capture these market transitions. In the case of WebEx acquisition, WebEx engages in the development and marketing of Web collaboration services that enable end-users to conduct meetings and share software applications, documents, presentations, and other content on the Internet using a standard Web browser (WebEx 2010). This market segmentation is exactly what Cisco is pursuing for.
-30-Cisco segments acquisitions into three categories - market acceleration, market expansion or new market entry. The target companies might bring different types of assets to Cisco, including
great talent and technology, mature products and solutions, or new go-to-market and business models. Cisco's mission is to connect people in a collaborative world. Before acquisition of WebEx, Cisco has no foot print in this sub-market. So acquiring WebEx can help Cisco extend its position on the collaborative service market.
From the perspective of transferring skills, Cisco has a track record to leverage deep expertise and unique experience in its acquisition practice, having cultivated world class processes over 15+ years and 130+ acquisitions of small to large, private and public companies (Cisco 2010a). In the entire value chain of networking service industry, the technology development is par t of the support activities in Porter's value chain theory. Cisco has the ability to improve current technology and develop new technology by its own process. It also can identify the technology developed by those firms being acquired and transfer the new technology to internal system, and thus combine internal R&D with external innovation through acquisitions.
3.2.4 Valuation
Overview of General Valuation Method
After acquiring target is finalized, the M&A process goes to valuation. I will go over general valuation approach first before discussing Cisco's valuation. Theoretically, there are three main valuation method used by private equity firms.
The first method is net present value (NPV) method (Lerner, Hardymon, and Leamon 2009), which is the most common valuation method either in reality or in academic area. NPV method
is essentially to get total discount value of all future cash flow of the targeted company.
31-N FCF TV
NPV=" + N
n= (1 + r) (1+r)"
Where
NPV=net present value of the targeted firm
FCFa=free cash flow to the firm in year n
r-discount rate, which is also the cost of capital to the targeted firm TVN=terminal value the future cash flow after year N
I will skip the detailed description of FCF, r, and TV as they could be easily found in intermediate finance textbook.
The second valuation method is to value the targeted company by comparables, such as Price to earnings per share (P/E ratio), price to book value per share, price to cash flow per share, and so on. In contract with NPV method, which is a method to calculate absolute value, comparable is a method to the market value or relative value of the targeted firm. For instance, if the average P/E ratio of all public firms in one industry is 10 and the trailing earnings per share of the target is $2, we could get the market expected price per share of the target by multiplying 10 and $2, which is $20. Hence market valuation of the company can be deduced by multiplying $20 and all shares outstanding of the company.
The third valuation method is adjusted present value (APV) method (Damodaran 2001), which is an extension of NPV method. APV method works better than NPV method if the company's capital structure keeps on changing. Changing capital structure would change the weighted average cost of capital of the firm. Meanwhile, APV calculation counts in the financing side
effects of different factors, such as tax shields, government incentives, debt distresses, etc. The formula to calculate APV could be written as:
APV=NPV+NPVF
Where
APV=adjusted present value of the company NPV=net present value of the company
NPVF=the present value of the financing side effects
There are some other types of valuation methods available too, such as venture capital method and asset options method. However, the comparables, NPV and APV are the three most widely used models preferred by private equity firms.
Each of the three models has its own pros and cons. The advantage of net present value method is theoretically sound and reflects the intrinsic value of the firm. However, the weaknesses of net present value method are substantial. The basis of net present value method, cash flows, may be difficult to estimate. The beta coefficient and capital structure of private company is difficult to find. NPV also assumes a constant capital structure, which is usually not the case. Comparables is easy and simple to use and also commonly used in private equity industry. However, it may be difficult to get comparables for private company. Even public company comparables are used, the illiquidity of private equity still hasn't been considered in comparable method. Adjusted present value method seems adjusted the weaknesses of net present value method. But it becomes more complicated to calculate than NPV method. In addition, APV method is still based on capital structure theory, of which the shortfall is still under discussion in academics.
-33-Cisco's Valuation of WebEx Acquisition
From the perspective of financial valuation, there's not too much difference in different cases of acquisitions. As for Cisco, I will elaborate its multiple valuation of WebEx acquisition as an
example. Cisco announced a definitive agreement to acquire WebEx on March 15, 2007. WebEx is a market leader in on-demand collaboration applications, and its network-based solution for delivering business-to-business collaboration extends Cisco's vision for Unified Communications, particularly within the Small to Medium Business (SMB) segment.
Multiples Detail
For Quarter Ending TEV/LTM Total Revenue
TEV/NTM Total Revenues
TEV/LTM EBITDA TEV/NTM EBITDA Average High Low Close Average High Low Close Average High Low Close Average High Low Close Average High Low Close Average High Low Close Average High Low Close Average High Low Close TEV/LTM EBIT P/LTM EPS P/NTM EPS P/LTM Normalized EPS Mar-30-2007 4.95x 6.59x 3.68x 6.58x May-25-2007 6.34x 6.58x 6.12x 6.20x 4.1 Ox 5.47x 3.07x 5.45x 18.89x 25.08x 14.17x 25.01x 12.92x 17.76x 9.36x 17.76x 24.02x 31.83x 18.1 Ox 31.75x 46.37x 58.73x 36.46x 58.59x 35.00x 43.49x 28.85x 43.37x 41.01x 51.81x 32.48x 51.70x 5.27x 5.46x 5.1Ox 5.16x 23.67x 25.03x 22.55x 22.83x 16.99x 17.77x 16.28x 16.48x 29.80x 31.77x 28.20x 28.55x 54.52x 58.63x 51.91x 52.15x 41.80x 43.40x 40.51x 40.79x 49.16x 51.73x 47.51x 47.73x P/BV Average 4.83x 5.79x High 6.1Ox 6.09x Low 3.83x 5.56x Close 6.09x 5.64x
Figure 10: Multiples of WebEx Communication Inc. before and after Cisco acquisition
--35-Source: Retrieved from Key Financials of WebEx Communication, Inc. Capital IQ
Under the terms of the agreement, Cisco would commence a cash tender offer to purchase all of the outstanding shares of WebEx for $57 per share and would assume outstanding share-based awards, for an aggregate purchase price of approximately $3.2 billion, or approximately $2.9 billion net of WebEx's existing cash balance. Cisco Systems would pay USD 57 per share of WebEx Inc. The offer represented a bid premium of 23.377 per cent over WebEx' closing share price of USD 46.20 on 14/03/07, the last trading day before the offer was announced (Zephyr 2010a).
In this case, Cisco used tender offer to acquire the company. Tender offer is a corporate
finance term denoting a type of takeover bid (Thompson 2001). The tender offer is a public, open offer or invitation by a prospective acquirer to all stockholders of a publicly
traded corporation to tender their stock for sale at a specified price during a specified time, subject to the tendering of a minimum and maximum number of shares. In a tender offer, the bidder contacts shareholders directly; the directors of the company may or may not have
endorsed the tender offer proposal. To induce the shareholders of the target company to sell, the acquirer's offer price usually includes a premium over the current market price of the target company's shares. So we see a premium of more than 20% in WebEx acquisition.
I examined the multiples in the acquisition of WebEx (Figure 10). In terms of total revenue of last twelve months, Cisco's offer was 6.34 times of WebEx's total sales- revenue. If calculated by EBITDA of the last twelve months, the offer was 5.27 times. In contrast to multiples on Mar 30, 2007, all multiples at the date of acquisition completion increased around 20%.
3.2.5 Integration
Integration is essential to successful acquisitions. Cisco's overall business development effort includes engaging from the early diligence phase through to mainstream business, by investing in dedicated integration resources across the company at the corporate and functional levels. The integration process starts with the entire acquisition strategy. Cisco seeks acquisitions where there is not only a strong business case but also a shared business and technological vision, and where compatibility of core values and culture foster an environment for success.
Cisco's normal practice is to integrate acquired technology with their existing product lines, doing substantial development work in-house to produce products much more interesting than the initial acquired technology. As often the case, acquisitions fill a specific technology void in a larger Cisco product innovation map.
If one acquisition is in manufacturing sector, the majority of Cisco's integration lies in the supply chain. Cisco has a comprehensive supply chain management system and thus requires every acquired company's products and suppliers to be integrated in the entire system. Original suppliers of the acquired company will be evaluated and then converted to Cisco's outsourcing model. In the production step, acquired company has to adopt Cisco's forecasting methodology and employ acceptable defect reduction process. Based on an analysis from STMB Biztel, there are 12 mandatory integration steps for mandatory manufacturing integration (Sardjana 2005).
1) Assign each product a Cisco part number;
2) Re-create the bill of materials into Cisco's MRP system; 3) Convert acquired company to Cisco's MRP system; 4) Convert acquired company to Cisco's Autotest system;
-37-5) Evaluate suppliers;
6) Convert to Cisco's outsourcing model; 7) Determine product lifecycles;
8) Employ acceptable defect reduction process; 9) Adopt Cisco's forecasting methodology;
10) Adopt Cisco's NPI methodology; 11) Integration of manufacturing facilities; 12) Integration of people.
This integration process is essentially trying to share activities of the entire value chain and thus enjoy the synergy from acquisition. Typically, Cisco integrates human resources, manufacturing, distribution, customer service, and finance into the overall Cisco firm-wide infrastructure.
Engineering, marketing, and sales are often integrated into the Cisco business unit which sponsored the acquisition (Paulson 2001).
In Paulson's Inside Cisco, he categorized Cisco's integration process into two stages: the structural integration stage and the culture integration stage. All the administrative and
operational aspects are in the structural integration stage. The items included are the integration of employee compensation, employee information, information systems, and other operational activities. Cultural integration stage is more difficult and thus need more time. Cisco did this mostly by pairing up inside team and acquired company to coach and transfer Cisco culture to acquired company.
3.3 The Bank of America
3.3.1 The Company
The Bank of America is now one of the largest financial institutions in the United States. It offers financial services and products to individual consumers, small and middle market businesses, large corporations, and governments globally. The company's Deposits segment generates savings accounts, money market savings accounts, certificate of deposits, individual retirement accounts, and checking accounts; and Global Card Services segment provides the U.S. consumer and business card, consumer lending, international card and debit card services. Its Home Loans & Insurance segment offers consumer real estate products and services, including mortgage loans, reverse mortgages, home equity lines of credit, and home equity loans. It also provides property, casualty, life, disability, and credit insurance. The company's Global Banking segment offers lending products, including commercial loans and commitment facilities, real estate lending, leasing, trade finance, short-term credit, asset-based lending, and indirect consumer loans; capital management and treasury solutions, such as treasury management, foreign exchange, and short-term investing options; and investment banking services comprising debt and equity underwriting and distribution, and merger-related advisory services. Its Global Markets segment provides financial products, advisory services, financing, securities clearing, settlement, and custody services. The company's Global Wealth & Investment Management segment offers investment and brokerage services, estate management, financial planning services, fiduciary management, credit and banking expertise, and asset management products (CapitalIQ 2010d).
39-The company provides unmatched convenience in the United States, serving approximately 59 million consumers and small business relationships with more than 6,000 retail banking offices, more than 18,000 ATMs and award-winning online banking with nearly 30 million active users (BankofAmerica 2010b).
3.3.2 Merger Strategy
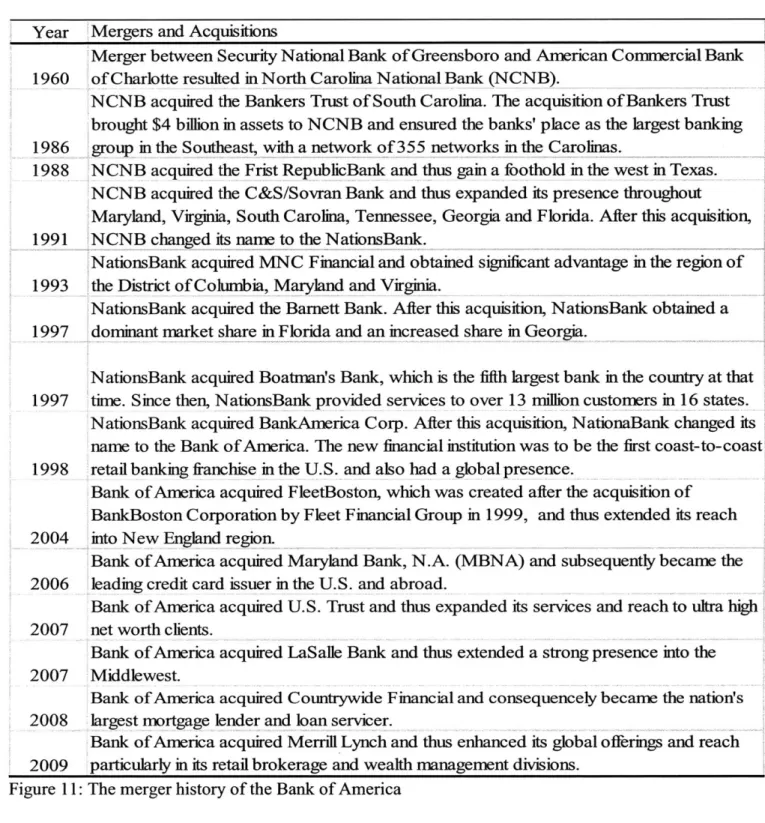
In more than 200 years, the Bank of America was grown up from a local bank in Charlotte, North Carolina by series of mergers and acquisitions. It not only expanded its geographical presence by acquiring strategically but also extended its business scope to areas other than retail banking. Figure 11 shows clearly the merger history of the Bank of America.
Year Mergers and Acquisitions
Merger between Security National Bank of Greensboro and American Conercial Bank 1960 of Charlotte resulted in North Carolina National Bank (NCNB).
NCNB acquired the Bankers Trust of South Carolina. The acquisition of Bankers Trust brought $4 billion in assets to NCNB and ensured the banks' place as the largest banking 1986 group in the Southeast, with a network of355 networks in the Carolinas.
1988 NCNB acquired the Frist RepublicBank and thus gain a foothold in the west in Texas. NCNB acquired the C&S/Sovran Bank and thus expanded its presence throughout
Maryland, Virginia, South Carolina, Tennessee, Georgia and Florida. After this acquisition, 1991 NCNB changed its name to the NationsBank.
NationsBank acquired MNC Financial and obtained significant advantage in the region of 1993 the District of Columbia, Maryland and Virginia.
NationsBank acquired the Barnett Bank. After this acquisition, NationsBank obtained a 1997 dominant market share in Florida and an increased share in Georgia.
NationsBank acquired Boatman's Bank, which is the fifth largest bank in the country at that 1997 time. Since then, NationsBank provided services to over 13 million customers in 16 states.
NationsBank acquired BankAmerica Corp. After this acquisition, NationaBank changed its name to the Bank of America. The new financial institution was to be the first coast-to-coast 1998 retail banking franchise in the U.S. and also had a global presence.
Bank of America acquired FleetBoston, which was created after the acquisition of BankBoston Corporation by Fleet Financial Group in 1999, and thus extended its reach 2004 into New Englandegion.
Bank of America acquired Maryland Bank, N.A. (MBNA) and subsequently became the 2006 leading credit card issuer in the U.S. and abroad.
Bank of America acquired U.S. Trust and thus expanded its services and reach to ultra high 2007 net worth clients.
Bank of America acquired LaSalle Bank and thus extended a strong presence into the 2007 Middlewest.
Bank of America acquired Countrywide Financial and consequencely became the nation s 2008 largest mortgage lender and loan servicer.
Bank of America acquired Merrill Lynch and thus enhanced its global offerings and reach 2009 particularly in its retail brokerage and wealth management divisions.
Figure 11: The merger history of the Bank of America
Source: Retrieved from the official website of the Bank of America, 2010.
In terms of the four corporate strategies I elaborated at part 3.1, I would categorize the merger strategy of the Bank of America into transferring skills. From the geographical perspective, the
-41-predecessor of Bank of America, NCNB, constantly expanded its presence from North Carolina to South Carolina, then to the west, the Middle West, and national wide. The acquisitions in 1960,
1986, 1988, 1991, 1993, 1997, 2004 and the acquisition of LaSalle Bank are mainly in the commercial banking side. It is thus easily for the bank to transfer skills from one location to another. The acquisitions in 2006, the acquisition of U.S. Trust in 2007, and the acquisitions in 2008, 2009 significantly extend its business segments. These M&A deals involve mainly skills transferred from the Bank of America to acquired companies and therefore strengthened its position as a leading financial institution.
Before the acquisition of Merrill Lynch, the business scope of Bank of America was mainly in the retail banking side. So it is relatively easy to transfer skills from one branch network to another one. That's why the majority acquisitions did by the Bank of American was involving geographic expansion, which largely improved the retail banking service coverage.
3.3.3 The Merrill Lynch Acquisition
The Bank of American's acquisition of Merrill Lynch gives the bank a strong position in capital markets, wealth management and investment banking. It is by this acquisition that the Bank of America rises to be a top player on Wall Street.
Target
Prior to the acquisition, Merrill Lynch was renowned for its brokerage network, which had 15000+ as of 2006. Such a strong network made Merrill Lynch capable to sell securities it underwrote directly. Other well known investment banks, such as Goldman Sachs and Morgan Stanley, had to rely on other independent brokers to distribute securities they underwrote: Merrill Lynch went public in 1971 with over $1.8 trillion assets under management and operated in more
than 40 countries around the world. It also strengthened its securities underwriting business by acquiring White Weld & Co. , a prestigious investment bank in 1978 (BofAMerrillLynch 2010). Merrill Lynch continued to grow until the global financial crisis happened in 2007.
Timing
Beginning from 2007, a global financial crisis broke out as of the burst of American housing bubble and the subsequently subprime mortgage crisis. Plenty of financial institutions were involved in the transactions of CDO (Collateralized Debt Obligations) and CDS (Collateralized Debt Swaps), which were highly risky in terms of volatility of housing price. When housing bubble busted, these subprime securities became nearly valueless and therefore resulted in severe assets loss to those financial institutions. Merrill Lynch was one of those highly involved.
In November 2007, Merrill Lynch announced a write down loss of $8.4 billion with the national housing crisis and removed its CEO (TheNewYorkTimes 2007). In July 2008, the new CEO of Merrill Lynch announced a fourth quarter loss of $4.9 billion for the company from defaults and bad investments in the mortgage crisis (TheNewYorkTimes 2008). During this period, the company's stock price also declined significantly. Tremendous loss heavily eroded Merrill Lynch's solvency to its short-term debt and thus ultimately led to its sale to the Bank of America. The Bank of America was different from Wall Street investment banks and mainly a bank holding company and had strong balance sheet from its retail banking side. The company's risk exposure to subprime securities was also trivial and thus in a very good position in terms of cash and capital capacity. The difficulty facing Merrill Lynch gave the Bank of America a great opportunity to expand its foothold to Wall Street and gained the strong brokerage network of Merrill Lynch. Meanwhile, the share price of Merrill Lynch had dropped significantly from the
-43-first time of a market rumor that it would be merged with Wachovia banking corporation. So if the Bank of America could negotiate an all stock acquisition deal, it would be benefiting the Bank of America to a large extent. And that was what exactly happened later on.
Valuation
On Sep 15, 2008, Bank of America announced it agreed to acquire Merrill Lynch & Company Inc. The consideration is valued at $50 billion and the offer was for 0.8595 Bank of America shares for every Merrill Lynch share (TheWallStreetJournal 2008). As of Sep 12, 2008, the closing share price of Bank of America was $33.74. So the shares can be valued at $29.00. This price represented a 70.1% premium over the closing price of Sep 12 of Merrill Lynch, which was $17.05 (CapitalIQ 2010a). However, this price also represented a discount of 52.38% over Merrill Lynch's closing share price of $60.90 as on Oct 25, 2007, the last trading day before Merrill Lynch received a proposal to acquire the company (Capital IQ 201 Oa). On Jan 1, 2009, Bank of America reported that it had completed the acquisition of Merrill Lynch
(BankofAmerica 2010a).
Performance of the acquisition
Figure 12 is the key financials of Bank of America for the past three consecutive years. After its acquisition of Merrill Lynch, the company's total revenue increased 54.7% from $45.957 billion to $71.073 billion. Its net income also increased from $4 billion to $6.276 billion, which
represents more than 50% increase. Total assets increased 22.3% from $1818 billion to $2223 billion.