Publisher’s version / Version de l'éditeur: Durability of Building Materials, 1, pp. 353-361, 1983
READ THESE TERMS AND CONDITIONS CAREFULLY BEFORE USING THIS WEBSITE.
https://nrc-publications.canada.ca/eng/copyright
Vous avez des questions? Nous pouvons vous aider. Pour communiquer directement avec un auteur, consultez la première page de la revue dans laquelle son article a été publié afin de trouver ses coordonnées. Si vous n’arrivez pas à les repérer, communiquez avec nous à [email protected].
Questions? Contact the NRC Publications Archive team at
[email protected]. If you wish to email the authors directly, please see the first page of the publication for their contact information.
NRC Publications Archive
Archives des publications du CNRC
This publication could be one of several versions: author’s original, accepted manuscript or the publisher’s version. / La version de cette publication peut être l’une des suivantes : la version prépublication de l’auteur, la version acceptée du manuscrit ou la version de l’éditeur.
Access and use of this website and the material on it are subject to the Terms and Conditions set forth at
Determination of time-of-wetness due to condensed moisture
Yamasaki, R. S.; Slade, H. F.; Sereda, P. J.
https://publications-cnrc.canada.ca/fra/droits
L’accès à ce site Web et l’utilisation de son contenu sont assujettis aux conditions présentées dans le site LISEZ CES CONDITIONS ATTENTIVEMENT AVANT D’UTILISER CE SITE WEB.
NRC Publications Record / Notice d'Archives des publications de CNRC:
https://nrc-publications.canada.ca/eng/view/object/?id=222ab7cd-5a7f-45e4-b5ee-a2e2d6f0bc18 https://publications-cnrc.canada.ca/fra/voir/objet/?id=222ab7cd-5a7f-45e4-b5ee-a2e2d6f0bc18
S e r
THI. I
N21d
National Research
Conseil national
no. 1132
#
Council Canada
de recherches Canada
ce 2 IBLDG
,---
DETERMINATION OF TIME-OF-WETNESS DUE TO
CONDENSED MOISTURE
by R.S. Yamasaki, H. F. Slade and P.J. Sereda
ANALYZED
Reprinted from
Durability of Building Materials, 1 (1983)
p. 353 - 361 - - L - /- 1 B ~ J G . RES-
1
1
C \ ~ ~ ~ R Y
t
1
!
DBR Paper No. 1132Division of Building Research
M&me s i l a c o r r o s i o n d e s mgtaux exposds a u x i n t e m p d r i e s e s t l i 6 e a u temps d ' h u m i d i f i c a t i o n dO 2 l a c o n d e n s a t i o n e t a u x p r E c i p i t a t i o n s , on o b t i e n d r a i t une r e l a t i o n p l u s e ' t r o i t e e n 6 t u d i a n t l e temps d ' h u m i d i f i c a t i o n s e u l e m e n t e n E o n s t i o n d e l ' h u m i d i t ' e condens'ee, p a r c e q u e c e t t e d e r n i s r e c o n t i e n t b e a u c o u p p l u s d e S O q c o r r o s i f q u e l e s p r 6 c i p i t a t i o n s . Une d t h o d e d Q v a l u a t i o n du temps d ' h u m i d i f i c a t i o n d 3 s e u l e m n t b l a c o n d e n s a t i o n s u r d e s
mi5taux a Gt6 m i s e au p o i n t e t 'eprouv'ee. Le temps
d ' h u m i d i E i c a t i o n p a r c o n d e n s a t ion, e n t r e l e mois de
novembre 1981 e t l e mots d ' o c t o b r e 1982 H Ottawa, compte
p o u r 16% du temps t o t a l d ' e x p o s i t i o n e t e s t deux f o i s p l u s l o n g que c e l u i dO a u x p r g c i p i t a t i o d s .
Durability o f Building Materials, 1 (1983) 353-361 353
Elsevier Science Publishers B.V., Amsterdam
-
Printed in The NetherlandsDETERMINATION OF TIME-OF-WETNESS DUE TO CONDENSED MOISTURE
R.S. YAMASAKI, H.F. SLADE and P.J. SEREDA
Division o f Building Research, National Research Council o f Canada, Ottawa, Ontario K I A OR6 (Canada)
(Received December 16, 1982; accepted in revised form March 11, 1983)
Keywords: surface moisture; precipitated moisture; moisture sensor; atmospheric cor- rosion of metals; sulphur dioxide.
ABSTRACT
Yamasaki, R.S., Slade, H.F. and Sereda, P.J., 1983. Determination of time-of-wetness due t o condensed moisture. Durability o f Building Materials, 1 : 353-361.
Although the corrosion of metals during outdoor exposure correlates with the time- of-wetness due t o both condensation and precipitation, a better correlation would b e obtained with time-of-wetness caused by condensed moisture alone, because it contains a greater amount of corrosive SO, than precipitated moisture. A method for determining the time-of-wetness produced solely by condensed moisture on metals was developed and tested. The condensation time-of-wetness from November 1981 t o October 1982, at Ottawa, was 16% o f the total exposure time and greater than that due t o precipitation by a factor of 2.
INTRODUCTION
The corrosion of metals during outdoor exposure correlates with the total time-of-wetness at the surface (Guttman and Sereda 1968). The total time-of-wetness is the sum of the periods of condensation and precipitation. Condensed moisture has been found to accelerate the corrosion of metals by increasing the amount of atmospheric SO2 adsorbed on the surface (Vernon 1935, Sereda 1960, Sydberger and Vannerberg 1972, Duncan and Spedding 1973), while precipitated moisture, with its greater volume, dilutes and washes away SO, (Wisniewski 1982). Thus, condensed moisture should be more corrosive t o metals than precipitated moisture, and there should be a better correlation between corrosion and time-of-wetness due to condensa- tion alone than with wetness time due t o both condensation and precipita- tion. To confirm this, information on condensation time-of-wetness is re- quired; this paper reports a method for determining the time-of-wetness produced solely by condensed moisture on metals during outdoor exposure.
EXPERIMENTAL PROCEDURE
Condensation time-o f-wetness apparatus
To detect the presence of surface moisture, a miniature moisture sensor
(25 X 25 X 1.5 mm) developed by Sereda et al. (1982) was utilized. It
consists of alternate 35 pm thick copper and 1 pm thick gold electrodes
deposited about 200 pm apart on a glass-reinforced polyester substrate t o form a galvanic cell. In the presence of moisture the sensor generates a current that, when applied across a resistor, results in a potential (IR drop).
When this potential becomes >0.01 V (with a 1 0 megohm shunt), it
represents a condition of surface wetness and its duration is recorded as time-of-wetness.
A metal surface exposed t o normal outdoor conditions takes on the temperature of the ambient air during periods of precipitation, but during
clear nights can reach a temperature as much as 4" C below ambient (Sereda
1960). Water vapour will condense on the surface even if the relative humid- ity is as low as 85%. The total time-of-wetness on such a metal surface will be due t o both precipitation and condensation. When a surface is heated to a temperature several degrees above ambient, no condensation occurs; thus, any wetness measured will be due to precipitation. This principle is used t o measure the precipitation time-of-wetness. The time-of-wetness due t o condensation alone will equal the difference between the total wetness time and that caused by precipitation.
To provide a test surface for determining the presence of moisture due to
precipitation alone, a non-corroding, stainless-steel panel (150 X 100 X 1.6
I
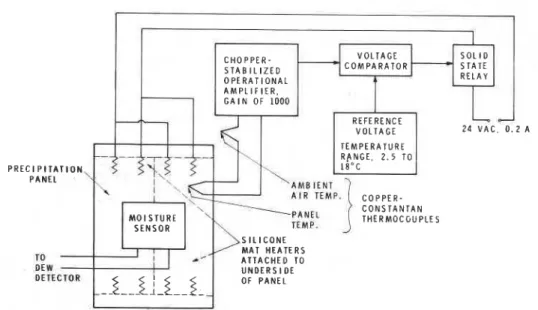
1 C H O P P E R - S T A B I L I Z E D C O M P A R A T O R O P E R A T I O N A L A M P L I F I E R . G A I N O F 1 0 0 0-
R E F E R E N C E V O L T A G E 2 4 V A C 0 . 2 A T E M P E R A T U R E - -- R A N G E . 2 . 5 T O P R E C I P I T A T I O N , 1 8 ° C P A N E L A I R T E M P . C O P P E R . PANEL1
C O N S T A N T A N M O I S T U R E E M P . T H E R M O C G U P L E S S E N S O R S I L I C O N E M A T H E A T E R S TO A T T A C H E D TO OE W U N D E R S I D E DETECTOR O F P A N E Lmm) was chosen. A moisture sensor was attached to the centre of the top
surface of the panel and two electric heating mats (130 X 50 X 1 mm, rated
50 W at 110 V AC) to the underside (Fig. 1). This sensor panel was set in a
rectangular cavity of a foam plastic slab (wall thickness
-
1 5 mm) to providethermal insulation; the panel surface was positioned flush with that of the foam plastic. A type T (copper -constantan) thermocouple was soldered to the top surface and connected in a differential mode to an adjacent thermocouple sensing ambient air temperature. The potential due to the temperature difference between the panel and the ambient air activated the temperature controller (described in detail in the next section). This control-
ler regulated the electric current to the heater to maintain the panel at 3 ?
2" C above ambient. The temperature level was set high enough t o prevent possible condensation of moisture even at temperatures as much as 2" C above ambient, because the presence of trace amounts of water-soluble matter on the panel attracts moisture (Davies 1963).
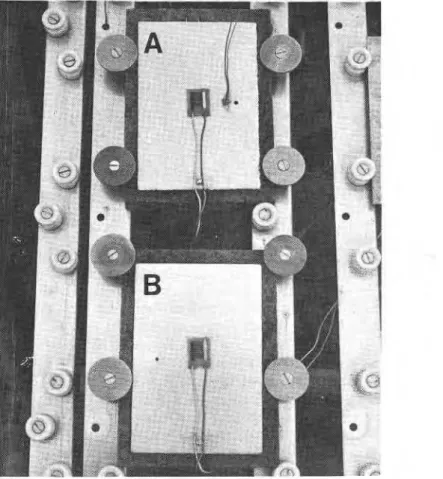
Fig. 2. Sensor apparatus for determining time-of-wetness due to condensation. Panel A detects wetness due to precipitation. Panel B detects wetness due to both precipitation and condensation.
The test surface fm'determining the presiznce of 50th precipitatiodilm;d *
condensation wasidentical t o thg'previous one, bdt viithaut'the heater.:'"
"
These sensor panels are shown in Fig. 2. The moishre sensors were &ired toDew Detector (designed and built by the National' Research Cowcil Canada) which gives cumulative time-of-wetness readouts to 0.1 h.
~ h 6 condensation time-of-wetness apparatus was used with panel surfaces facing jlouth at 30" at the Ottawa exposure site between May 1981 and December 1982.
1
.
' i '' ,
~emperalhre controller for the precipitation panel
The temperature cantrooller, shown achematically in Fig. 1, maintains the
temperature of the precipitation time-of-wetness pane1 a few degrees above
the ambient air temperature, t o prevent the condensation of moisture.
I .
It is controlled by two opposing type T thermocouples, which sense the temperature difference between the panel and the ambient air. The cor- responding potential difference (40 pV/9C) between the thermocouples is amplified by a factor of 1000 by a chopper-stabilized operational amplifier and fed into a voltage comparator; there it is compared against an adjustable reference potential set to give the desired temperature difference. By means of a solid state relay, the current at 24 V AC is supplied to the heaters until the desired temperature differential is reached. Tests show a temperatine increase of 5" C in 4 min at ambient air temperatures of 22" C and -15" C, and a temperature control of k 2" C.
RESULTS AND DISCUSSION
Performance of the condensation time-of-wetness apparatus
To assess similarity in performance of the two sensor panels prior to the application of heat, the surface wetness times of the panels were compared with the heater off. The readings of the two panels, as shown in Table 1, section A (July 31 t o September I ) , generally agreed to within 10%. The ability of the slightly heated panel (A) to detect rain and the effect of the rainfall rate was assessed. The results in section B of Table 1 show satisfac- tory agreement with those of the unheated panel (B), except at the lowest rate of rainfall (-0.2 mm/h), where acceleration of drying by the heater becomes prominent. The contribution of this error to the total monthly reading, however, is considered small because the frequency of occurrence of rainfall at 0.2 mm/h or less, at Ottawa, is only about 10%. The capacity of the heater t o prevent condensation of dew and f r ~ s t was checked (Table 1C) and found to be satisfactory.
During winter, because the moisture sensor responds to wetness at tem- peradfes'as l&'ak L30°C (Sere_da et al. 1982), the presence of snow or "
TABLE 1
Test of condensation time-of-wetness apparatus
Date
Time-of-wetness (h)
Panel A Pahel B Moisture (A) 1981 July 31-Aug. 7 Aug. 7-19 Aug. 19--27 Aug. 27-31 Aug. 3 1 S e p t . 1 (B) 1981 May 1 --6 May 6-15 May 15-1 9 May 19--22 (C) 1982 April 15-26 April 26--27 Dec. 4-5 Dec. 10-11 Dec. 11-12 Unheated 26.5 77.0 45.2 35.8 4.4 Heated 1.0 32.5 7.4 0.8 Unheated 29.9 90.2 49.2 38.6 4.2 Unheated 5.1 28.1 7.5 2.1
Rain,
-
8 mm/h and dew Rain,-
2 mm/h and dew Rain,-
2 mm/h and dew Rain,-
0.5 mm/h and dew Dew only Rain, -0.2 mm/h Rain, -0.4 mm/h Rain, -4 mm/h Rain, -0.2 mm/h Rain,-
2 mm/h Dew Dew Snow Frost TABLE 2Conditions during winter time-of-wetness
1981 1982
Nov. Dec. Jan. Feb. March April Time-of wetness (h Precipitation 65 74 8 9 67 126 5 8 Condensation 137 134 67 161 52 5 8 Total 202 208 156 228 1 7 8 116 Snowfall Amount (mm) 1 4 236 458 278 364 0 Number of events 1 8 11 7 6 0
Mean temp. for
events (" C ) 0 -3 -15 --9 -6 -
Rainfall
Amount (mm) 56.4 2.2 42.6 0.0 25.2 56.8
Number of events 11 1 3 0 5 6
Mean temp. for
both sensors read wet at temperatures below 0°C were observed. However, instances of both sensors indicating dry in the presence of snow, have also been encountered. Furthermore, snow falling on the heated panel soon melts and registers wet, whereas the unheated panel reads dry. Subsequently, snow which has accumulated on the unheated panel thaws and records as time-to-wetness, while the heated panel reads dry because the snow has melted in the early stages. The surface wetness time of the heated panel was longer than that of the unheated one (Table l C , December 1 0 t o 11,1982).
To assess the effect of such behaviour on the precipitation wet period for each month, the times-of-wetness, along with the weather conditions for
the cold months (November t o April), were compared (Table 2). The relativ-
ely high time-of-wetness due t o precipitation in March may perhaps be attributed t o the above sensor response. The precipitation wet periods for the other winter months, however, seem more normal. The possible oc- currence of similar events from December t o February, nevertheless, reduces the reliability of the precipitation values; such uncertainty is estimated to
be as much as 20%. This uncertainty, however, reduces to about 5% if all
1 2 months' results are considered, so that the annual time-of-wetness can still be determined with adequate accuracy.
The record of selected time-of-wetness readings from September 1 , 1 9 8 1 t o November 1 , 1 9 8 2 is given in Table 3 t o illustrate the year-round perfor- mance of the apparatus.
Distribution of wetness periods due to condensation and precipitation During the one-year period from November 1981 t o October 1982, the times-of-wetness of the stainless-steel panels were 1390 h as a result of
condensation and 730 h as a result of precipitation, or 1 6 and 8%, respective- ly, of the exposure period. Thus, the wetness period due t o condensation was 67% or two-thirds of the total time-of-wetness, i.e. twice that due t o precipitation. On a monthly basis, as tabulated in Table 4, the condensation wet period exceeded the precipitation wet period for 11 out of 1 4 months.
CONCLUSIONS
The proposed method for determining the time-of-wetness of metals due to condensed moisture alone during outdoor exposure is applicable during the spring-to-autumn period. I t is less reliable in the winter because snow is sometimes registered as wet and sometimes not. However, the annual condensation time-of-wetness can still be determined with adequate accuracy. During the one-year period from November 1981 t o October 1982, at
Ottawa, the condensation wet period amounted t o 16% of the exposure period, twice as long as that due t o precipitation. Furthermore, the con- densation wet period exceeds the precipitation wet period for about three- quarters of the year.
TABLE 3
Record of selected times-of-wetness due t o condensation and precipitation
Exposure Timeaf-wetness
Dates time Precipitation Precipitation Condensation Precipitation Condensation Condensation
interval and (h 1 (h) (% of total (% of total (% of total
(h condensation time) time) wetneag time)
(h 1981 9/14/27 626.5 187.7 56.7 131.0 9.0 20.9 69.8 9127-1011 96.2 34.2 9.3 24.9 9.7 25.9 72.8 1011-lO/l6 355.3 130.9 33.9 97 .O 9.5 27.3 74.1 lO/l610/30 344.0 115.6 58.5 57.1 17.0 16.6 49.4 10/3U-11/10 260.0 57.9 9.3 48.6 3.6 18.7 83.9 l l / l ~ l l / l $ 194.0 67.9 26.7 41.2 13.8 60.7 60.7 11118-1214 385.2 110.8 35.9 74.9 9.3 19.4 67.6 1214-12123 451.2 98.8 42.7 56.1 9.5 12.4 56.8 12/23-12/31 191.5 84.0 19.0 65.0 9.9 33.9 77.4
360
TABLE 4
Monthly distribution of percentage time-of-wetness due to condensation and precipitation
Time-of-wetness
Month Condensation Precipitation Condensation Condensation (h 1 (h 1 and (% of total
precipitation wetness time) (h) 1981 Sept. 22 9 3 1 70 Oct. 21 13 34 6 3 Nov. 19 9 28 69 Dec. 18 10 28 66 1982 Jan. 9 12 21 44 Feb. 24 10 34 71 March 7 17 24 28 April 8 8 16 47 May 9 4 13 68 June 16 6 22 7 1 July 18 4 22 8 0 Aug. 18 5 23 78 Sept. 23 8 31 7 4 Oct. 20 6 26 76 ACKNOWLEDGEMENTS
The authors gratefully acknowledge R.G. Mondor for designing and building the temperature controller and C.C. Barrett for his valuable as- sistance. This paper is a contribution from the Division of Building Research, National Research Council Canada, and is published with the approval of the Director of the Division.
REFERENCES
Davies, D.K., 1963. The incipient condensation of water vapor o n a gold surface. Brt. J. Appl. Phys. 14: 567-571.
Duncan, J.R. and Spedding, D.J., 1973. The effect of relative humidity on adeorption of sulphur dioxide onto metal surfaces. Corrosion Sci. 13 : 993-1001.
Guttman, H. and Sereda, P.J., 1968. Measurement of atmospheric factors affecting the corrosion of metals. ASTM Special Technical Publication 453, 326359.
Sereda, P.J., 1960. Atmospheric factors affecting the corrosion of steel. Ind. Eng. Chem.
Sereda, P.J., Croll, S.G. and Slade, H.F., 1982. Measurement of the time-of-wetness by moisture sensors and their calibration. In: Atmospheric Corrosion of Metals, ASTM Special Technical Publication 767, 267-283.
Sydberger, T. and Vannerberg, N.G., 1972. The influence of the relative humidity and corrosion products on the adsorption of sulfur dioxide on metal surfaces. Corrosion Sci., 12: 775-784.
Vernon, W.H.J., 1935. A laboratory study of the atmospheric corrosion of metals. Trans. Faraday Soc. 31: 1668-1700.
Wisniewski, J., 1982. The potential acidity associated with dews, frosts and fogs. Water, Air and Soil Pollution 17 : 361-377.
T h i s publication is being d i s t r i b u t e d by the Division of Building R e s e a r c h of the National R e s e a r c h Council of Canada. I t should not b e r e p r o d u c e d i n whole o r i n p a r t without p e r m i s s i o n of the o r i g i n a l publisher. The Di- v i s i o n would b e glad t o be of a s s i s t a n c e in obtaining s u c h p e r m i s s i o n .
Publications of the Division m a y be obtained by m a i l - ing the a p p r o p r i a t e r e m i t t a n c e ( a Bank, E x p r e s s . o r P o s t Office Money O r d e r , o r a cheque, m a d e payable
to the R e c e i v e r G e n e r a l of Canada, c r e d i t NRC) t o t h e National R e s e a r c h Council of Canada, Ottawa. K1A OR6. S t a m p s a r e not acceptable.
A l i s t of a l l p u b l i c a t i o n s of the Division i s available and m a y b e obtained f r o m the Publications Section, Division of Building R e s e a r c h , National R e s e a r c h Council of Canada, Ottawa. KIA OR6.