Circulation and Intrusions Northeast of Taiwan:
Chasing and Predicting Uncertainty in the Cold Dome
The MIT Faculty has made this article openly available. Please share
how this access benefits you. Your story matters.
Citation
Gawarkiewicz, Glen et al. “Circulation and Intrusions Northeast
of Taiwan: Chasing and Predicting Uncertainty in the Cold Dome.”
Oceanography 24.4 (2011): 110–121.
As Published
http://dx.doi.org/10.5670/oceanog.2011.99
Publisher
The Oceanography Society
Version
Final published version
Citable link
http://hdl.handle.net/1721.1/78913
Terms of Use
Article is made available in accordance with the publisher's
policy and may be subject to US copyright law. Please refer to the
publisher's site for terms of use.
CITATION
Gawarkiewicz, G., S. Jan, P.F.J. Lermusiaux, J.L. McClean, L. Centurioni, K. Taylor, B. Cornuelle, T.F. Duda, J. Wang, Y.J. Yang, T. Sanford, R.-C. Lien, C. Lee, M.-A. Lee, W. Leslie, P.J. Haley Jr., P.P. Niiler, G. Gopalakrishnan, P. Velez-Belchi, D.-K. Lee, and Y.Y. Kim. 2011. Circulation and intrusions northeast of Taiwan: Chasing and predicting uncertainty in the cold dome.
Oceanography 24(4):110–121, http://dx.doi.org/10.5670/oceanog.2011.99.
DOI
http://dx.doi.org/10.5670/oceanog.2011.99 COPYRIGHT
This article has been published in Oceanography, Volume 24, Number 4, a quarterly journal of The Oceanography Society. Copyright 2011 by The Oceanography Society. All rights reserved. USAGE
Permission is granted to copy this article for use in teaching and research. Republication, systematic reproduction, or collective redistribution of any portion of this article by photocopy machine, reposting, or other means is permitted only with the approval of The Oceanography Society. Send all correspondence to: info@tos.org or The Oceanography Society, PO Box 1931, Rockville, MD 20849-1931, USA.
O
ceanography
THE OFFICIAL MAGAzINE OF THE OCEANOGRAPHY SOCIETY
Oceanography
| Vol.24, No.4 110S p e c i a l i S S u e o N t h e
o c e a N o g r a p h y o f ta i wa N
circulation and intrusions
Northeast of taiwan
B y g l e N g awa r k i e w i c z , S e N J a N , p i e r r e f. J . l e r m u S i a u x , J u l i e l . m c c l e a N , l u c a c e N t u r i o N i , k e V i N tay l o r , B r u c e c o r N u e l l e , t i m o t h y f. D u D a , J o e wa N g , y i i N g J i a N g ya N g , t h o m a S S a N f o r D , r e N - c h i e h l i e N , c r a i g l e e , m i N g - a N l e e , way N e l e S l i e , pat r i c k J . h a l e y J r . , p e a r N p. N i i l e r , g a N e S h g o pa l a k r i S h N a N , p e D r o V e l e z- B e l c h i , D o N g - k y u l e e , a N D y o o y i N k i mchasing and predicting uncertainty in the cold Dome
Oceanography
| Vol.24, No.4 110iNtroDuctioN
Forecasting ocean circulation in continental shelf and slope regions throughout the world is challenging. Over the continental shelf, there are a wide variety of forcing mechanisms, such as wind stress, buoyancy forcing from river runoff, tidal rectification, instabilities and eddy formation, and air-sea fluxes with associated water-mass formation, that conspire to make accurate forecasts difficult. Similarly, over the continental slope, forcing mechanisms include western boundary currents, topographic wave propaga-tion, and internal tides and internal
wave generation. In both environments, multiple processes operate on widely varying length and time scales. Careful attention is required to determine contributions of these processes to ocean circulation, which can affect the accuracy of ocean forecasts. Despite the challenges, the development of effi-cient and accurate numerical modeling techniques has led to many successful efforts to forecast currents, temperature/ salinity fields, and dynamically signifi-cant parameters such as relative and potential vorticity distributions.
An important research theme in shelf and slope regions is the quantification
and prediction of uncertainty in both measurements and models. The use of these uncertainty estimates can be crucial to determine what is quantifi-able and so the degree of accuracy of scientific estimates. Uncertainty can be defined as the probability density function of the error between esti-mates and the true value of a variable. Thus, uncertainty representations are a function of both time and space and are four-dimensional variables. For any model estimate, the portion of the variability that contains error contributes to the uncertainty, and vari-ability unresolved by model estimates or measurements is pure uncertainty (Lermusiaux et al., 2006).
Real-time uncertainty predictions using ensemble methods with numerical models and error subspace concepts have been used in the coastal ocean since 1996 (Lermusiaux, 1999). Such computations have been successfully employed in many coastal regions (e.g., Lermusiaux, 2001; Auclair et al., 2003). Similarly, observational scientists commonly assess uncertainty in their data. However, for uncertainty estimates to be useful, we need to know how accurate they are. Comparison of uncer-tainty calculations to error distributions (obtained by comparing measurements to model forecasts) is thus becoming an area of active research. In order to address these issues in a systematic manner, a joint Taiwan-US program called “Quantifying, Predicting, and Exploiting Uncertainty” (QPE) was set up to examine uncertainty and predict-ability in the ocean circulation north-east of Taiwan. This program, which was jointly sponsored by the National Science Council of Taiwan and the
aBStr act. An important element of present oceanographic research is the assessment and quantification of uncertainty. These studies are challenging in the coastal ocean due to the wide variety of physical processes occurring on a broad range of spatial and temporal scales. In order to assess new methods for quantifying and predicting uncertainty, a joint Taiwan-US field program was undertaken in August/ September 2009 to compare model forecasts of uncertainties in ocean circulation and acoustic propagation, with high-resolution in situ observations. The geographical setting was the continental shelf and slope northeast of Taiwan, where a feature called the “cold dome” frequently forms. Even though it is hypothesized that Kuroshio subsurface intrusions are the water sources for the cold dome, the dome’s dynamics are highly uncertain, involving multiple scales and many interacting ocean features. During the experiment, a combination of near-surface and profiling drifters, broad-scale and high-resolution hydrography, mooring arrays, remote sensing, and regional ocean model forecasts of fields and uncertainties were used to assess mean fields and uncertainties in the region. River runoff from Typhoon Morakot, which hit Taiwan August 7–8, 2009, strongly affected shelf stratification. In addition to the river runoff, a cold cyclonic eddy advected into the region north of the Kuroshio, resulting in a cold dome formation event. Uncertainty forecasts were successfully employed to guide the hydrographic sampling plans. Measurements and forecasts also shed light on the evolution of cold dome waters, including the frequency of eddy shedding to the north-northeast, and interactions with the Kuroshio and tides. For the first time in such a complex region, comparisons between uncertainty forecasts and the model skill at measurement locations validated uncertainty forecasts. To complement the real-time model simulations, historical simulations with another model
show that large Kuroshio intrusions were associated with low sea surface height anomalies east of Taiwan, suggesting that there may be some degree of predictability for Kuroshio intrusions.
Oceanography
| Vol.24, No.4 112Office of Naval Research in the United States, consisted of a variety of compo-nents, including a pilot field program northeast of Taiwan in September 2008, an Intensive Observational Period (IOP) in August/September 2009, near-surface drifter releases over a two-year period, and extensive modeling and remote-sensing analysis. The goal of the present study is to assess the accuracy of uncertainty predictions during the late summer, when a feature commonly known as the cold dome appears in sea surface temperature imagery. A further
goal is to assess the predictability of the Kuroshio intrusion, which occurs when the Kuroshio diverts onto the continental shelf northeast of Taiwan.
Here, we first briefly provide back-ground on the oceanographic processes that QPE addressed. Two ocean models were employed, one to study and fore-cast fields and uncertainties in real time (MIT Multidisciplinary Simulation, Estimation, and Assimilation System, or MIT-MSEAS) and another to inves-tigate the predictability of larger-scale processes, including large Kuroshio
intrusions (HYbrid Coordinate Ocean Model, or HYCOM). We describe the intensive field measurements collected in August/September 2009, including data on cold dome formation, real-time ocean forecasting and errors, and the impact of Typhoon Morakot. Next, we examine the impact of the Kuroshio on the area northeast of Taiwan from long-term near-surface drifter deployments as well as numerical modeling efforts to estab-lish the predictability of the Kuroshio intrusion. We conclude by discussing implications for the future modeling of this region, including uncertainty and the predictability of these processes.
oceaNogr aphic BackgrouND
Two key circulation features in the region of interest are (1) the cold dome, a cyclonic feature that appears primarily in summer and is associated with upwelling, and (2) Kuroshio intrusions onto the continental shelf (Lee and Chao, 2003; Liang et al., 2003). The cold dome is an intermittent but common feature, approximately 100 km in diameter, that is evident in sea surface temperature imagery during the summer, when surface thermal patterns shift frequently. Doming of the isotherms and isopycnals in the center of the dome can lead to cyclonic circulation and upwelling over the shelf (e.g., Chern and Wang, 1992; Liu et al., 1992; Tang et al., 1999, 2000). Although it is thought that flow up the canyons leads to cold dome formation, wind forcing may also play an impor-tant role (Chang et al., 2009). Further information on the processes in this area appears in Jan et al. (2011, in this issue) and a discussion of the Kuroshio near Taiwan appears in Rudnick et al. Glen Gawarkiewicz (ggawarkiewicz@whoi.edu) is Senior Scientist, Woods Hole
Oceanographic Institution, Woods Hole, MA, USA. Sen Jan is Associate Professor, Institute
of Oceanography, National Taiwan University, Taipei, Taiwan. Pierre F.J. Lermusiaux
is Associate Professor, Department of Mechanical Engineering, MIT, Cambridge, MA, USA. Julie L. McClean is Associate Research Oceanographer, Scripps Institution of
Oceanography, University of California, San Diego, CA, USA. Luca Centurioni is Associate
Project Scientist, Scripps Institution of Oceanography, La Jolla, CA, USA. Kevin Taylor
is a graduate student in the School of Oceanography, University of Washington, Seattle, WA, USA. Bruce Cornuelle is Research Oceanographer, Scripps Institution of
Oceanography, San Diego, CA, USA. Timothy F. Duda is Senior Scientist, Woods Hole
Oceanographic Institution, Woods Hole, MA, USA. Joe Wang is Professor, Institute of
Oceanography, National Taiwan University, Taipei, Taiwan. Yiing Jiang Yang is Associate
Professor, Department of Marine Science, Naval Academy, Tsoying, Kaohsiung, Taiwan.
Thomas Sanford is Principal Oceanographer and Professor, Applied Physics Laboratory
and School of Oceanography, University of Washington, Seattle, WA, USA. Ren-Chieh Lien
is Principal Oceanographer and Affiliate Professor, Applied Physics Laboratory, University of Washington, Seattle, WA, USA. Craig Lee is Principal Oceanographer
and Associate Professor, Applied Physics Laboratory and School of Oceanography, University of Washington, Seattle, WA, USA. Ming-An Lee is Professor and Dean of the
College of Ocean Science and Resource, National Taiwan Ocean University, Keelung, Taiwan. Wayne Leslie is Research Scientist, Department of Mechanical Engineering,
MIT, Cambridge, MA, USA. Patrick J. Haley Jr. is Research Scientist, Department of
Mechanical Engineering, MIT, Cambridge, MA, USA. Pearn P. Niiler (deceased) was
Distinguished Emeritus Professor, Scripps Institution of Oceanography, San Diego, CA, USA.
Ganesh Gopalakrishnan is Post Graduate Researcher, Scripps Institution of Oceanography,
La Jolla, CA, USA. Pedro Velez-Belchi is Visiting Researcher, Scripps Institution of
Oceanography, La Jolla, CA, USA. Dong-Kyu Lee is Visiting Researcher, Scripps Institution
of Oceanography, La Jolla, CA, USA. Yoo Yin Kim is Senior Statistician, Scripps Institution
(2011, in this issue).
During the pilot QPE program in 2008, a research focus was identifying dominant ocean-acoustic variations and their uncertainties (Lermusiaux et al., 2010). This work revealed that variability northeast of Taiwan, from the remote large-scale Taiwan Strait transport to intricate shelf-break internal tides, could be predicted deterministically several days ahead.
the impact of typhooN mor akot-iNteNSiVe oBSerVatioNS iN 2009
Prior to the IOP in August/September 2009, near-surface drifters were deployed at weekly intervals, and three gliders were also launched into the Kuroshio in May of 2009. In early August, Taiwan was hit by Typhoon Morakot, which brought torrential rain to the southern half of Taiwan. The typhoon’s center passed across central Taiwan from August 7–8, weakening to a tropical storm as it crossed the island. A large area in the southern portion of Taiwan received one to three meters of total rainfall, and there were massive mudslides and swollen rivers throughout southern Taiwan. The river runoff resulting from Typhoon Morakot affected stratification and circulation northeast of Taiwan later in the month (as confirmed by IOP data and by river models and re-analyses simulations, not shown).
During the IOP, Taiwanese and American scientists jointly conducted a number of different observational efforts. Four ships were involved—Taiwanese R/Vs Ocean Researcher 1, 2, and 3 (henceforth OR1, OR2, and OR3) and the US R/V Roger Revelle. Gliders were launched from R/V Melville in May.
Data from the broad-scale hydrographic survey undertaken by OR2 and OR3 in Taiwan Strait and the area north and
northeast of Taiwan appears in Figure 1, and also in Jan et al. (2011, in this issue).
Glider observations were obtained T at 50 m depth Aug. 13−17, 2009
119˚E 120˚E 121˚E 122˚E 123˚E 119˚E 120˚E 121˚E 122˚E 123˚E 24˚N
25˚N 26˚N
119˚E 120˚E 121˚E 122˚E 123˚E 119˚E 120˚E 121˚E 122˚E 123˚E 24˚N
25˚N 26˚N
119˚E 120˚E 121˚E 122˚E 123˚E 119˚E 120˚E 121˚E 122˚E 123˚E 24˚N
25˚N 26˚N
119˚E 120˚E 121˚E 122˚E 123˚E 119˚E 120˚E 121˚E 122˚E 123˚E 24˚N 25˚N 26˚N 24˚N 25˚N 26˚N 24˚N 25˚N 26˚N 24˚N 25˚N 26˚N 24˚N 25˚N 26˚N S at 50 m depth Aug 13−17, 2009
T at 50 m depth Aug. 27−Sep. 2, 2009
18 20 22 24 26 28 Temperature
°C
S at 50 m depth Aug. 27−Sep. 2, 2009
32.0 32.5 33.0 33.5 34.0 34.5 35.0 Salinity
psu
T anomaly at 50 m depth (2009_1) S anomaly at 50 m depth (2009_1)
T anomaly at 50 m depth (2009_2) −5.0 −2.5 0.0 2.5 5.0 Temperature °C S anomaly at 50 m depth (2009_2) −1.0 −0.5 0.0 0.5 1.0 Salinity psu
figure 1. plan views of the temperature and salinity fields from two broad-scale surveys from r/Vs Ocean Researcher 2 and Ocean Researcher 3. The two surveys were conducted from august 13–17 and august 27–September 2, 2009. The anomaly fields relative to the climato-logical mean values appear in the lower four panels.
Oceanography
| Vol.24, No.4 114in the Kuroshio northeast of Taiwan from May to October 2009. These observations were aimed at defining stratification and variability over the continental slope with particular atten-tion to the posiatten-tion of the Kuroshio. Eighty-eight Surface Velocity Program (SVP) drifters were released in a tight array (25°N–26°N, 120°E–123.5°E) north and northeast of Taiwan in less than one month. The first 44 units were deployed from OR2 and OR3 in early August 2009 in support of the broad-scale hydrographic survey whose aim was to establish proper initial conditions for numerical modeling efforts; the second set of 44 SVP-GPS drifters were deployed from two R/V Roger Revelle cruises in the primary study area in August and September 2009. Additional sampling included two ten-day high-resolution SeaSoar surveys centered on two mooring arrays as well as intensive sampling using profiling floats near a mooring array over the continental
slope. The two mooring arrays on the continental shelf included thermistor chains as well as acoustic receivers along with bottom-mounted acoustic Doppler current profilers (ADCP). Five moorings with bottom-mounted ADCPs, along with moored conductivity-temperature-depth (CTD) sensors, were located in North Mien-Hua Canyon as well as the adjacent continental slope.
An important element of the field program was the rapid transfer of data from the ships to MIT-MSEAS for the production of real-time model forecasts of fields and uncertainty in ocean circu-lation, hydrography, and acoustic propa-gation. Real-time adaptive sampling predictions for both ocean and acoustic sensing were also used to inform ocean sampling. The adaptive sampling (e.g., Heaney et al., 2007; Lermusiaux, 2007) focused on reducing uncertainty in future field estimates, guided by MIT-MSEAS uncertainty forecasts. The results often led to sampling the edges
of the cold dome as well as significant features in the along- and cross-shelf directions because they were found to optimally reduce higher levels of uncertainty. During this time period, sea surface temperature data were collected from satellites as well as synthetic aperture radar images to determine the location and spatial structure of internal wave packets within the region.
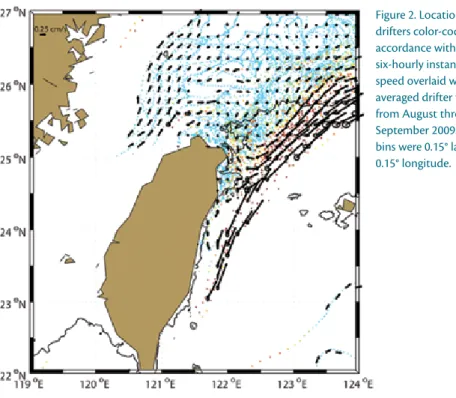
During the IOP phase of QPE, between August and September 2009, weekly drifter releases from offshore Taitung indicated the absence of a near-surface Kuroshio intrusion in the primary study area (Figure 2). In situ and model estimates also confirmed this observation. The 15 m depth circulation mapped from the drifter data suggests the existence of a northeastward flow through Taiwan Strait, part of which joins the Kuroshio north of Taiwan, and a somewhat closed circulation cell at 25.3°N, 122°E. The surface expression of the Kuroshio is located some distance from the shelf break and appears to flow over the East China Sea shelf east of 123°E. Several drifters also moved south between Taiwan’s coast and the north-eastward-flowing Kuroshio within a tran-sient countercurrent (Figure 2), probably generated by the localized wind forcing associated with Typhoon Morakot.
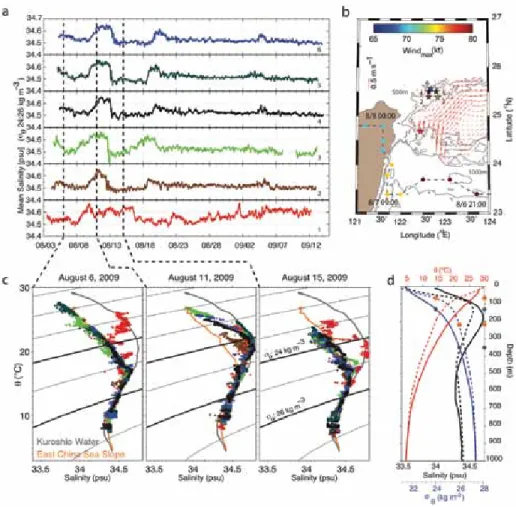
During August 2009, two robust subsurface intrusions of the Kuroshio were measured on the East China Sea slope; their signature was an abnormally high salinity of 34.6 averaged between the 1,024 kg m–3 and 1,026 kg m–3
isopycnals, which is characteristic of the Kuroshio subsurface water mass (Figure 3a). The averaging was computed between density surfaces to avoid the effect of the large vertical figure 2. locations of
drifters color-coded in accordance with their six-hourly instantaneous speed overlaid with bin-averaged drifter velocity from august through September 2009. The spatial bins were 0.15° latitude x 0.15° longitude.
heaving of isopycnals associated with the region’s semidiurnal internal tides. Vertical displacements of internal tides on the order of ± 50 m were observed; some reached amplitudes greater than 100 m. Such internal-tide properties were successfully modeled for the pilot experiment (Lermusiaux et al., 2010). The density range 1,024–1,026 kg m–3
was covered consistently at the moored CTD sensor locations, and equated to a mean depth range of 75–270 m for the typical East China Sea slope water (Figure 3d). Temperature/salinity (T/S) at the southernmost mooring on I-Lan Ridge first revealed shallow Kuroshio water (~ 1,023 kg m–3) and then deep
Kuroshio water (> 1,024 kg m–3) during
August 6–15 (Figure 3c, red dots). The largest of the two August subsurface intrusions was observed in conjunction with Typhoon Morakot (Figure 3b). A large salinity increase was evident at the southernmost mooring during the evening of August 8, 2009. This event was less than one day after Morakot made landfall in Taiwan on August 7. The large positive salinity anomaly traveled northward through the mooring array at a speed of ~ 0.8 m s–1
(Figure 3a), which is the speed of the main path of the Kuroshio at a depth of 104 m (Tang et al., 1999). The salinity anomaly persisted longest at the north-ernmost mooring (Figure 3a, mooring 6, blue salinity record).
Concurrent sea surface height anomaly fields show a change in the absolute geostrophic sea surface velocity in the region of North Mien-Hua Canyon; it shifted from northeast to north just after Typhoon Morakot tran-sited the region. The shift of absolute geostrophic velocity to the north over
North Mien-Hua Canyon supports the interpretation of increased salinity resulting from a subsurface intrusion of the Kuroshio. A possible explanation for the shelfward movement of the core of the Kuroshio and a northward shift in geostrophic velocity could be coastal upwelling caused by Typhoon Morakot winds. Southerly winds resulting from
the passage of Typhoon Hai-Tang during the summer of 2005 were thought to have possibly led to coastal upwelling east of Taiwan (Morimoto et al., 2009). The upwelling generated an east-west sea level difference, which in turn generated a northward geostrophic current.
Another feature present over the continental slope during the IOP was
figure 3. (a) temporal variation of salinity averaged between σθ 24 kg m–3 and 26 kg m–3 at six
moor-ings deployed east and northeast of taiwan. (b) horizontal velocity averaged from the sea surface to either the bottom or 1,000 m depth from gliders in 0.1° latitude x 0.1° longitude grid points (red velocity arrows), typhoon morakot track and maximum wind speed (filled circles color-coded by maximum wind speed), and six mooring locations (colored stars) that are color-coded and numbered to correspond to mean salinity records in (a). (c) potential temperature and salinity plot before typhoon morakot (left), immediately after typhoon morakot (center), and several days after typhoon morakot (right). colored dots correspond with color-coding of moorings (b, stars) and mean salinity records (a). The kuroshio temperature/salinity (t/S) data shown (solid gray line) were collected by gliders, and the east china Sea slope water t/S data (solid orange line) by em-apex floats. (d) average vertical profile of salinity (black), potential temperature (red), and potential density (blue) for the kuroshio collected by gliders in okinawa trough (solid lines) and the east china Sea slope collected by em-apex floats (dashed lines). average depth associated with σθ 24 kg m–3 and 26 kg m–3 for the kuroshio (gray) and the east china Sea Slope
Oceanography
| Vol.24, No.4 116a persistent southwestward subsurface countercurrent, relative to the north-eastward Kuroshio. It was observed along the East China Sea slope by the five moorings deployed near North Mien-Hua Canyon and EM-APEX floats in the region (not shown). The current primarily followed isobaths along the slope in deepwater, but flowed along a more general southwest trajectory near the surface. A maximum velocity of 0.4 m s–1 was observed near 200 m
depth along the 600 m isobath. The flow’s water-mass properties indicate that at depth it appears to be recircu-lating Kuroshio water (Figure 3c). The surface properties are those of East China Sea shelf water.
After the appearance of the salty Kuroshio water mass over the outer shelf immediately after Typhoon Morakot, there was a significant decrease in shelf salinity due to a pulse of fresh-water arriving on the shelf from rivers. (Figure 4). SeaSoar surveys over the 130 m isobath just shoreward of the shelf break show a drop in salinity of 0.7 over the upper 60 m of the water column between August 25 and August 31. This
drop is consistent with the sill depth in Taiwan Strait, and suggests that the freshwater outflow may have been fully mixed through the water column within Taiwan Strait. Surface density dropped by 1 kg m–3 as a result of this freshwater
pulse. Satellite imagery, shipboard ADCP data near Keelung, and numerical model results from the data-assimilated model analyses from MIT-MSEAS show a strong coastal current forming along the west coast of Taiwan and passing north-ward through Taiwan Strait and onto the East China Sea continental shelf. By September 5, salinity in the upper 60 m of the water column returned to values similar to the climatology, suggesting that the approximate residence time of the freshwater pulse over the continental shelf north of North Mien-Hua Canyon was approximately one week. Around September 5, a cold cyclonic eddy was present just offshore of the shelf break, along the upper continental slope. This cold eddy, which circulated north of the core of the Kuroshio, led to a second subsurface cold dome formation event.
real-time forecaStiNg of oceaN circulatioN aND uNcertaiNty
During the IOP, real-time analyses and forecasts of regional ocean circula-tion, regional acoustic propagacircula-tion, and uncertainty estimates were issued using many of the observational assets deployed during the experiment. The MIT-MSEAS group produced daily analyses and 72-hour forecasts of oceanographic and acoustic propaga-tion fields and uncertainties from August 18 to September 10, 2009, concurrent with cruises on R/Vs OR1,
OR2, OR3, and Roger Revelle. The model
is a nonlinear free-surface primitive equation code (Haley and Lermusiaux, 2010) with two-way nesting and high-resolution barotropic tides (Logutov and Lermusiaux, 2008). The grid resolution was 4.5 km for the coarse-resolution domain and 1.5 km for the fine-scale, two-way nested subdomain near North Mien-Hua Canyon.
Data collected during broad-scale surveys conducted from OR2 and OR3 (Figure 1) were used to initialize the model along with glider data, sea surface
figure 4. SeaSoar salinity sections over the outer continental shelf and upper continental slope from (a) august 25, (b) august 31, and (c) September 5, 2009. The relatively fresh water near the surface in the middle panel is due to a pulse of fresh river water runoff after typhoon morakot.
height anomaly and sea surface tempera-ture remote-sensing data, and informa-tion about deep stratificainforma-tion from the World Ocean Atlas 2005. The upstream boundary condition for the Kuroshio was obtained using a combination of gridded fields of sea surface height anomaly as well as near-surface drifter data combined into a feature model of the Kuroshio. Atmospheric forcing for the model used a combination of Coupled Ocean/Atmosphere Mesoscale Prediction System (COAMPS) wind fields and Navy Operational Global Atmospheric Prediction System (NOGAPS) surface fluxes. During the course of the IOP, 10 to 30 simulations including re-analyses were run daily, in part to estimate model parameters from data. Real-time forecast skill evaluations included daily comparisons with glider, SeaSoar, and satellite data.
The cold dome off northern Taiwan was a common feature of the forecasts. This feature was present in the initial fields, showed a general decay through August 28, strengthened through September 5, then further decayed. This observation agrees with glider
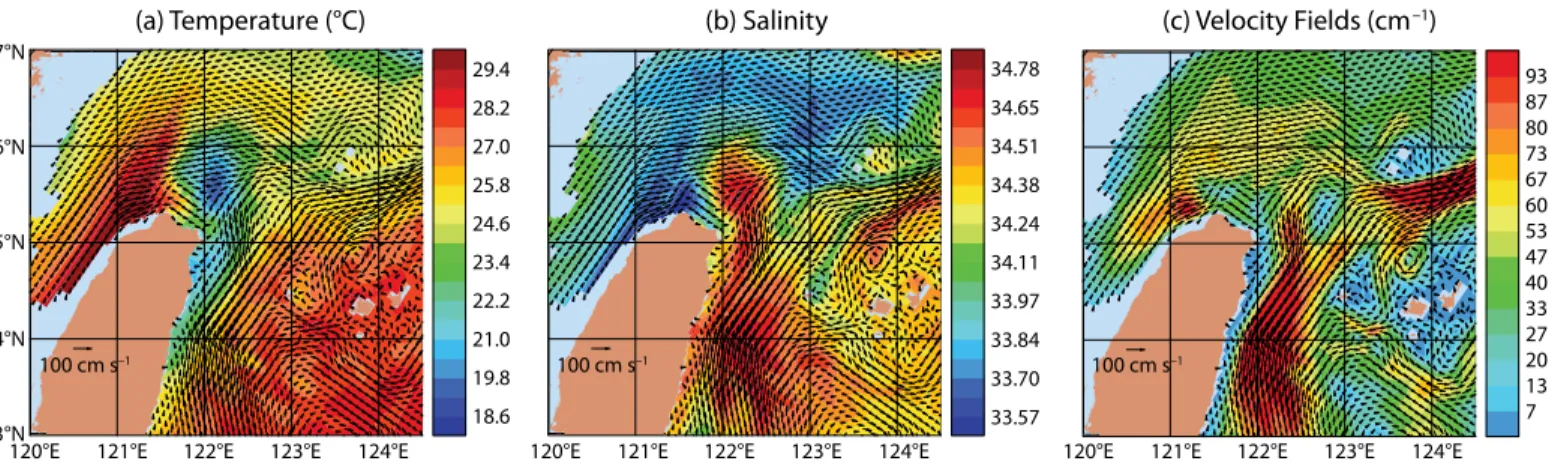
and SeaSoar data. Eddies of cold dome waters were estimated to spin off to the north-northeast about every two days, and long filaments were entrained into the Kuroshio. In addition to the long-term variability, (internal) tidal effects, mostly originating from the shelf break and the northern tip of Taiwan, strongly modulated the cold dome. A typical daily analysis field for temperature and salinity at 50 m depth, in this case using data assimilated from August 30, 2009, appears in Figure 5. Note the temperature minimum in the cold dome, centered at 25.5°N, 122.2°E, as well as the local salinity maximum in the cold dome region. The velocity field indicates a branch of the Kuroshio deflecting onshore into the cold dome’s center. The forecast also highlights a relatively warm (29°C) water mass in the coastal current adjacent to Taiwan’s coast.
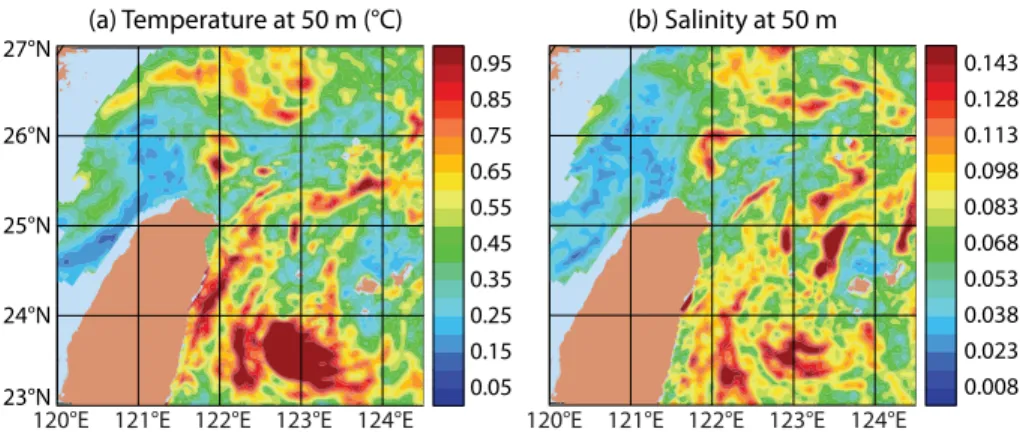
In addition to the analyses and fore-cast fields, daily uncertainty forefore-casts were produced using the method of Error Subspace Statistical Estimation (ESSE; Lermusiaux and Robinson, 1999; Lermusiaux et al., 2002; Lermusiaux, 2006). For each uncertainty forecast,
an ensemble of 50 model runs was used to produce ocean field statistics. Suggestions for SeaSoar and acoustic sampling plans were provided daily based on these uncertainty fields. Figure 6 shows a representative example of model uncertainties from September 6, 2009. In general, the largest uncertainties were found in the cold dome region and along the shelf break, although the spatial patterns of the uncertainty fields shifted considerably from day to day.
Comparison of the model fields to data from 10 SeaSoar surveys collected near the shelf break between August 24 and September 10, 2009, shows that the model forecasts produced root-mean-square (RMS) errors much smaller than the variability. Specifically, for the one-day to two-day forecasts, RMS errors averaged both along and in the vertical 0.17 in salinity and 1.28°C in temperature. These RMS forecast errors are only one-half to one-third of the amplitude of the variability in the region (estimated at 0.49 in salinity and 2.2°C in temperature by comparing persistence fields, [i.e., the initial conditions] to the
figure 5. real-time forecasts of 50 m (a) temperature, (b) salinity, and (c) velocity fields northeast of taiwan for august 30, 2009. These fields are typical for the daily forecasts, which occurred during the intensive observational period. forecasts for up to 72 hours were also issued daily as well. for (c), the color contour represents the velocity magnitude at 50 m depth.
27°N 26°N 25°N 24°N 23°N 29.4 28.2 27.0 25.8 24.6 23.4 22.2 21.0 19.8 18.6 34.78 34.65 34.51 34.38 34.24 34.11 33.97 33.84 33.70 33.57 93 87 80 73 67 60 53 47 40 33 27 20 13 7 120°E 121°E 122°E 123°E 124°E 120°E 121°E 122°E 123°E 124°E
120°E 121°E 122°E 123°E 124°E
(a) Temperature (°C) (b) Salinity (c) Velocity Fields (cm–1)
Oceanography
| Vol.24, No.4 118well as its duration. Hence, a long-term drifter release program was initiated to study this process. From April 7, 2008, to January 14, 2009, the Taiwanese Coast Guard released two SVP drifters (Niiler, 2001) per week within the Kuroshio near Taitung City (in Southeast Taiwan). From January 14, 2009, onward, only one drifter per week was released. This drifter time series ended on September 16, 2009, with a total of 112 drifters released within the Kuroshio. The primary goal of the drifter releases was to examine the near-surface flow field to determine when and where surface Kuroshio intrusions onto the shelf northeast of Taiwan occurred, and then to compare the intrusion events with upstream flow conditions in the Kuroshio to estimate predictability of the intrusion events. The drifter observations were coordinated with numerical modeling studies exam-ining the sea surface height anomaly field east of Taiwan.
Westward-propagating eddies within the North Pacific Subtropical Gyre are responsible for the region of enhanced eddy kinetic energy found between 120°E and 160°W and centered at approximately 23°N (e.g., Maximenko et al., 2009) and are thought to affect the Kuroshio in the Luzon Strait region and along the coast of Taiwan (Zhang et al., 2001). The transport and the meandering patterns of the Kuroshio measured with the World Ocean Circulation Experiment PCM-1 moored current meter array (Johns et al., 2001) correlate with the arrival of the large westward-propagating eddies east of Taiwan (Zhang et al., 2001). Further analysis of these data shows a maximum correlation coefficient of 0.83 between the WOCE PCM-1 Kuroshio transport to note that these uncertainties are not
small, and thus challenging to forecast numerically, especially in real time. Second, they match the actual measured errors relatively well. On average, the uncertainty forecasts for temperature were very close to the actual time-average RMS error of 1.28°C while the uncertainty forecasts for salinity were smaller than the RMS error of 0.17 (in large part due to the effects of large river discharges, which were not modeled in real time, neither in the field nor in the uncertainties). To our knowledge, these results provide the first field verification of real-time uncertainty predictions for ocean circulation forecasts.
large-Scale Drifter oBSerVatioNS aND
moDeliNg of the kuroShio iNtruSioN eaSt of taiwaN
Although the cold dome is observed primarily during the summer months, an equally important process affecting the continental shelf and slope region northeast of Taiwan is the Kuroshio intrusion. Because the intrusion is intermittent, it requires collecting long-term observations to obtain meaningful statistics on its occurrence frequency as same SeaSoar data). Maximum mean
along-track errors of 0.45 in salinity and 1.7°C in temperature occurred during the freshwater pulse from river runoff after Typhoon Morakot. After the typhoon had passed, these maxima reduced to 0.25 in salinity and 1.25°C in temperature. For August 30, the maximum error in salinity was at the surface, and relates to the nonmodeled pulse of freshwater, while maximum error in temperature was in the depth range of 100–120 m, associated with the passage of a cold cyclonic eddy over the continental slope.
A key part of our QPE field program was to evaluate the skill of uncertainty forecasts, and not only the skill of field forecasts. There are many ways to evaluate the skill of uncertainty predic-tions; one of the simplest is to compare the predicted forecast uncertainty to the measured forecast errors, assuming that measured data are perfect (no errors of representativeness in the data). Hence, we computed the standard deviations of the ESSE ensemble forecasts at the SeaSoar data points. We found that the time-average ESSE standard devia-tions were 0.12 in salinity and 1.25°C in temperature. First, it is important
figure 6. uncertainty forecast fields for September 6, 2009, produced using an eSSe ensemble of 50 model runs. The plotted values are the standard deviation of the values from the ensemble of model runs, with (a) temperature at 50 m and (b) salinity at 50 m.
0.95 0.85 0.75 0.65 0.55 0.45 0.35 0.25 0.15 0.05 0.143 0.128 0.113 0.098 0.083 0.068 0.053 0.038 0.023 0.008 27°N 26°N 25°N 24°N 23°N
120°E 121°E 122°E 123°E 124°E 120°E 121°E 122°E 123°E 124°E
and AVISO (satellite) gridded weekly mean sea level anomaly (MSLA) data at 23.9°N, 123.2°E, suggesting that the MSLA can be used as a good proxy for Kuroshio transport variability through the East Taiwan Channel, between Taiwan and the southern Ryukyu Islands. Note that Johns et al. (2001) defines it as “…along the Ilan Ridge between the east coast of Taiwan and the southern Ryukyu Island of Iriomote.” The Kuroshio meandering pattern trig-gered by coalescing cyclonic eddies offshore of Taiwan is well described by more than 20 years of drifter tracks crossing the East Taiwan Channel, which show how a pronounced meander of the Kuroshio develops northeast of Taiwan in the shallow water of the East China Sea continental shelf during times of low MSLA (and transport) at 23.9°N, 123.2°E (Figure 7).
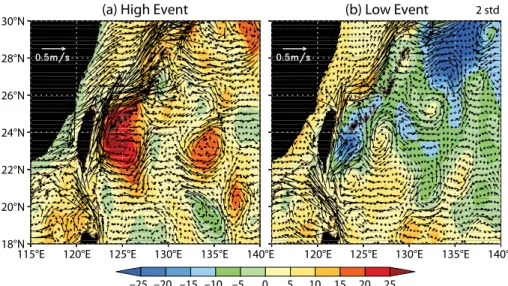
To further clarify the predictability of Kuroshio intrusions into the East China Sea, daily volume transports through the East Taiwan Channel were calculated using velocity from the data assimilative 1/12° global HYCOM simulation for the years 2004–2010 (Chassignet et al., 2009; Scott et al., 2010). The hindcast run assimilates a wide range of data sources, including remote and in situ measurements. In order to examine the relationship between the strength of the Kuroshio and the initiation of Kuroshio intrusions onto the continental shelf, time periods of particularly weak and strong Kuroshio transports were identified. Extreme volume transport events were defined as those exceeding the two standard deviation ranges of the demeaned daily time series. These extreme occurrences were averaged to form high and low composites of
velocities at 15 m and sea surface height anomalies (Figure 8). The low event composite shows the Kuroshio to the east of Taiwan meandering offshore and then onshore, intruding onto the continental shelf of the East China Sea in the vicinity of Mien-Hua Canyon.
Conversely, the high event composite shows flow intensification to the shore-ward side of the anticyclone and little intrusive activity in this same region. These model results are consistent with the observational analyses of Yang et al. (1999). These results are somewhat
figure 7. Drifter tracks (drogued only) for (a) high and (b) low kuroshio transport across the east taiwan channel. grey tracks are from the historical database. Black tracks are from the Quantifying, predicting, and exploiting uncertainty (Qpe) program drifters (april 2008 through august 2009).
a
b
30°N 28°N 26°N 24°N 22°N 20°N120°E 122°E 124°E 126°E 128°E 120°E 122°E 124°E 126°E 128°E 130°E
figure 8. composite of model event fields chosen as the mean of events two standard deviations (a) above and (b) below kuroshio demeaned daily transport from a data assimilative model. During high transport events, the kuroshio turns to the northeast and does not penetrate onto the continental shelf, whereas during low transport events, a meander pattern is set up in which the kuroshio penetrates onto the continental shelf northeast of taiwan.
(a) High Event (b) Low Event
30°N 28°N 26°N 24°N 22°N 20°N 18°N
115°E 120°E 125°E 130°E 135°E 140°E 120°E 125°E 130°E 135°E 140°E –25 –20 –15 –10 –5 0 5 10 15 20 25
Oceanography
| Vol.24, No.4 120counterintuitive, in that one might have anticipated that a stronger Kuroshio would have been less-easily deflected to the northeast as it encountered the steep topography.
Summary
Where do we stand regarding predict-ability and uncertainty forecasting of ocean circulation northeast of Taiwan? Despite the complicated flow in the region, mesoscale features such as the cold dome and the Kuroshio intrusion can be predicted several days in advance. We identified regions where sea surface height anomalies and the presence of large Kuroshio intrusions are highly correlated, which should allow for accurate prediction of Kuroshio intru-sions. We documented the importance to variability in salinity and stratification of the coastal current’s northward flow through Taiwan Strait west of Taiwan— demonstrating the impact of typhoons
on the continental shelf hundreds of kilometers away.
Even with extreme salinity and temperature variability due to river runoff from Typhoon Morakot, with rainfall totals higher than in the past 50 years, a regional forecast model
was able to forecast the temperature and salinity fields with accuracies of 0.17 salinity and 1.28°C in temperature over a two-week period. Over the same period, variability in the region was 0.49 in salinity and 2.2°C in tempera-ture, indicating that the forecast errors were much smaller than the variability within this region.
The forecast field from the regional model shed light on the evolution of cold dome waters, including the frequency of eddy shedding to the north-northeast, and interactions with the Kuroshio and tides. Coupled physical and acoustical uncertainty forecasts were also issued during the experi-ment. Importantly, for the quantifica-tion and predicquantifica-tion of uncertainties in complex ocean regions, we found that our predicted values of uncertainty were in agreement with computed forecast errors. This uncertainty forecasting was numerically challenging in real
time, especially because even though the measured forecast errors (misfits between model forecasts and data) were much smaller than the variability, they were not small. To our knowledge, these results are the first field verification of real-time uncertainty predictions for
ocean circulation forecasts. In addition to being relatively accurate, the uncertainty forecasts were useful in real time—they provided the basis for daily sugges-tions of SeaSoar and acoustic sampling plans. These results should be of general interest for those attempting to provide uncertainty forecasts in shelf and slope environments throughout the world.
Despite these challenges, the ocean northeast of Taiwan remains a fascinating area to study with ener-getic ocean processes that couple the Kuroshio to the continental shelf. Let us hope international researchers will continue to tackle these problems, and quantify the known unknowns, as well as the present unknown unknowns, regarding the complex ocean circulation within this region.
ackNowleDgemeNtS
We thank the National Science Council of Taiwan as well as the Office of Naval Research for generous support of this effort. We thank C.-S. Chiu, D. Marble, B. Reeder, T. Paluszkiewicz, and E. Livingston for their assistance and constant support throughout the program. We also thank the captains and crews of the Ocean Researcher 1,
Ocean Researcher 2, Ocean Researcher 3,
R/V Roger Revelle, and R/V Melville for outstanding efforts to accomplish the fieldwork. The MSEAS group (PFJL, PJH, and WGL) thanks J. Lynch, L. Mayer, B. Calder, and Y.-T. Lin for data and discussions during the real-time research. The MSEAS group also thanks J. Doyle, D. Marble, J. Nachimknin, and J. Cook as well as the FNMOC for providing them with atmospheric fluxes. Hanjin Shipping Company, Hyundai Merchant Marine and the Coast Guard
“
DeSpite theSe challeNgeS, the oceaN
NortheaSt of taiwaN remaiNS a faSciNatiNg
area to StuDy with eNergetic oceaN
proceSSeS that couple the kuroShio
to the coNtiNeNtal Shelf.
of Taiwan are gratefully acknowledged for deploying a large portion of the Northwest Pacific drifter array.
refereNceS
Auclair, F., P. Marsaleix, and P. De Mey. 2003. Space-time structure and dynamics of the forecast error in a coastal circulation model of the Gulf of Lions. Dynamics of Atmospheres and Oceans 36:309–346, http://dx.doi.org/10.1016/ S0377-0265(02)00068-4.
Chang, Y.-L., C.-R. Wu, and L.-Y. Oey. 2009. Bimodal behavior of the seasonal upwelling off the northeastern coast of Taiwan. Journal of Geophysical Research 114, C03027, http://dx.doi. org/ 10.1029/2008JC005131.
Chassignet, E.P., H.E. Hurlburt, E.J. Metzger, O.M. Smedstad, J.A. Cummings, G.R. Halliwell, R. Bleck, R. Baraille, A.J. Wallcraft, C. Lozano, and others. 2009. US GODAE: Global ocean prediction with the HYbrid Coordinate Ocean Model (HYCOM). Oceanography 22(2):64–75, http://dx.doi.org/10.5670/oceanog.2009.39. Chern, C.-S., and J. Wang. 1992. The influence of
Taiwan Strait waters on the circulation of the southern East China Sea. La mer 30:223–228. Haley, P.J. Jr., and P.F.J. Lermusiaux. 2010.
Multiscale two-way embedding schemes for free-surface primitive-equations in the Multidisciplinary Simulation, Estimation and Assimilation System. Ocean Dynamics 60:1,497–1,537, http://dx.doi.org/ 10.1007/ s10236-010-0349-4.
Heaney, K.D., G. Gawarkiewicz, T.F. Duda, and P.F.J. Lermusiaux. 2007. Nonlinear optimiza-tion of autonomous undersea vehicle sampling strategies for oceanographic data-assimilation. Journal of Field Robotics 24:437–448, http:// dx.doi.org/10.1002/rob.20183.
Jan, S., C.-C. Chen, Y.-L. Tsai, Y.J. Yang, J. Wang, C.-S. Chern, G. Gawarkiewicz, R.-C. Lien, L. Centurioni, and J.-Y. Kuo. 2011. Mean struc-ture and variability of the cold dome northeast of Taiwan. Oceanography 24(4):100–109, http:// dx.doi.org/10.5670/oceanog.2011.98. Johns, W.E., T.N. Lee, D.X. Zhang, R. Zantopp,
C.T. Liu, and Y. Yang. 2001. The Kuroshio east of Taiwan: Moored transport observa-tions from the WOCE PCM-1 array. Journal of Physical Oceanography 31:1,031–1,053, http://dx.doi.org/10.1175/1520-0485(2001) 031<1031:TKEOTM>2.0.CO;2.
Lee, H.-J., and S.-Y. Chao. 2003. A climatological description of circulation in and around the East China Sea. Deep-Sea Research Part II 50:1,065–1,084, http://dx.doi.org/ 10.1016/S0967-0645(03)00010-9. Lermusiaux, P.J.F. 1999. Data assimilation via
Error Subspace Statistical Estimation: Part II. Mid-Atlantic Bight shelfbreak front simula-tions and ESSE validation. Monthly Weather
Review 127:1,408–1,432, http://dx.doi.org/ 10.1175/1520-0493(1999)127<1408:DAVESS> 2.0.CO;2.
Lermusiaux, P.F.J. 2001. Evolving the subspace of the three-dimensional multiscale ocean vari-ability: Massachusetts Bay. Journal of Marine Systems 29:385–422, http://dx.doi.org/10.1016/ S0924-7963(01)00025-2.
Lermusiaux, P.F.J. 2006. Uncertainty estimation and prediction for interdisciplinary ocean dynamics. Journal of Computational Physics 217:176–199, http://dx.doi.org/ 10.1016/j.jcp.2006.02.010. Lermusiaux, P.F.J. 2007. Adaptive modeling,
adap-tive data assimilation and adapadap-tive sampling. Physica D 230:172–196, http://dx.doi.org/ 10.1016/j.physd.2007.02.014.
Lermusiaux, P.F.J., C.-S. Chiu, G.G. Gawarkiewicz, P. Abbot, A.R. Robinson, R.N. Miller, P.J. Haley, W.G. Leslie, S.J. Majumdar, A. Pang, and F. Lekien. 2006. Quantifying uncertainties in ocean predictions. Oceanography 19(1):90–103, http://dx.doi.org/10.5670/oceanog.2006.93. Lermusiaux, P.F.J., and A.R. Robinson. 1999. Data
assimilation via Error Subspace Statistical Estimation: Part I. Theory and schemes. Monthly Weather Review 127:1,385–1,407, http://dx.doi.org/10.1175/1520-0493(1999) 127<1385:DAVESS>2.0.CO;2.
Lermusiaux, P.F.J., A.R. Robinson, P.J. Haley, and W.G. Leslie. 2002. Advanced interdisciplinary data assimilation: Filtering and smoothing via error subspace statistical estimation. Pp. 795–802 in Proceedings of the OCEANS 2002 MTS/IEEE Conference. October 29–31, 2001, Biloxi, MS, Holland Publications. Lermusiaux, P.F.J., J. Xu, C.F. Chen, S. Jan, L.Y. Chiu, and Y.-J. Yang. 2010. Coupled ocean-acoustic prediction of transmis-sion loss in a continental shelfbreak region: Predictive skill, uncertainty quantification and dynamical sensitivities. IEEE Journal of Oceanic Engineering 35:895–916, http://dx.doi.org/ 10.1109/JOE.2010.2068611.
Liang, W.-D., T.Y. Tang, Y.J. Yang, M.-T. Ko, and W.-S. Chuang. 2003. Upper-ocean currents around Taiwan. Deep-Sea Research Part II 50:1,085–1,105, http://dx.doi.org/ 10.1016/S0967-0645(03)00011-0.
Liu, K.K., G.-C. Gong, S. Lin, C.Y. Yang, C.L. Wei, S.-C. Pai, and C.-K. Wu. 1992. The year-round upwelling at the shelf break near the northern tip of Taiwan as evidenced by chemical hydrog-raphy. Terrestrial Atmospheric and Oceanic Sciences 3:243–275.
Logutov, O.G., and P.F.J. Lermusiaux. 2008. Inverse barotropic tidal estimation for regional ocean applications. Ocean Modelling 25:17–34, http:// dx.doi.org/10.1016/j.ocemod.2008.06.004. Maximenko, N., P.P. Niiler, L. Centurioni,
M.-H. Rio, O. Melnichenko, D. Chambers, V. Zlotnicki, and B. Galperin. 2009. Mean dynamic topography of the ocean derived from satellite and drifting buoy data using three
different techniques. Journal of Atmospheric and Oceanic Technology 26:1,910–1,919, http:// dx.doi.org/10.1175/2009JTECHO672.1. Morimoto, A., S. Kojima, S. Jan, and D. Takahashi.
2009. Movement of the Kuroshio axis to the northeast shelf of Taiwan during typhoon events. Estuarine, Coastal, and Shelf Science 82:547–552, http://dx.doi.org/10.1016/ j.ecss.2009.02.022.
Niiler, P.P. 2001. The world ocean surface circula-tion. Pp. 193–204 in Ocean Circulation and Climate. G. Siedler, J. Church, and J. Gould, eds, Academic Press.
Rudnick, D., S. Jan, L. Centurioni, C.M. Lee, R.-C. Lien, J. Wang, D.-K. Lee, R.-S. Tseng, Y.Y. Kim, and C.-S. Chern. 2011. Seasonal and mesoscale variability of the Kuroshio near its origin. Oceanography 24(4):52–63, http:// dx.doi.org/ 10.5670/oceanog.2011.95. Scott, R.B., B.K. Arbic, E.P. Chassignet,
A.C. Coward, M. Maltrud, W.J. Merryfield, A. Srinivasan, and A. Varghese. 2010. Total kinetic energy in four global eddying ocean circulation models and over 5000 current meter records. Ocean Modelling 32:157–169, http:// dx.doi.org/10.1016/j.ocemod.2010.01.005. Tang, T.Y., Y. Hsueh, Y.J. Yang, and J.C. Ma.
1999. Continental slope flow north-east of Taiwan. Journal of Physical Oceanography 29:1,353–1,362, http:// dx.doi.org/10.1175/1520-0485(1999) 029<1353:CSFNOT>2.0.CO;2. Tang, T.-Y., J.H. Tai, and Y.J. Yang. 2000. The
flow pattern north of Taiwan and the migra-tion of the Kuroshio. Continental Shelf Research 20:349–371, http://dx.doi.org/10.1016/ S0278-4343(99)00076-X .
Yang, Y., C.T Liu, J.-H. Hu, and M. Koga. 1999. Taiwan Current (Kuroshio) and impinging eddies. Journal of Oceanography 55:609–617. Zhang, D.X., T.N. Lee, W.E. Johns, C.T. Liu,
and R. Zantopp. 2001. The Kuroshio east of Taiwan: Modes of variability and relationship to interior ocean mesoscale eddies. Journal of Physical Oceanography 31:1,054–1,074, http://dx.doi.org/10.1175/1520-0485(2001) 031<1054:TKEOTM>2.0.CO;2.