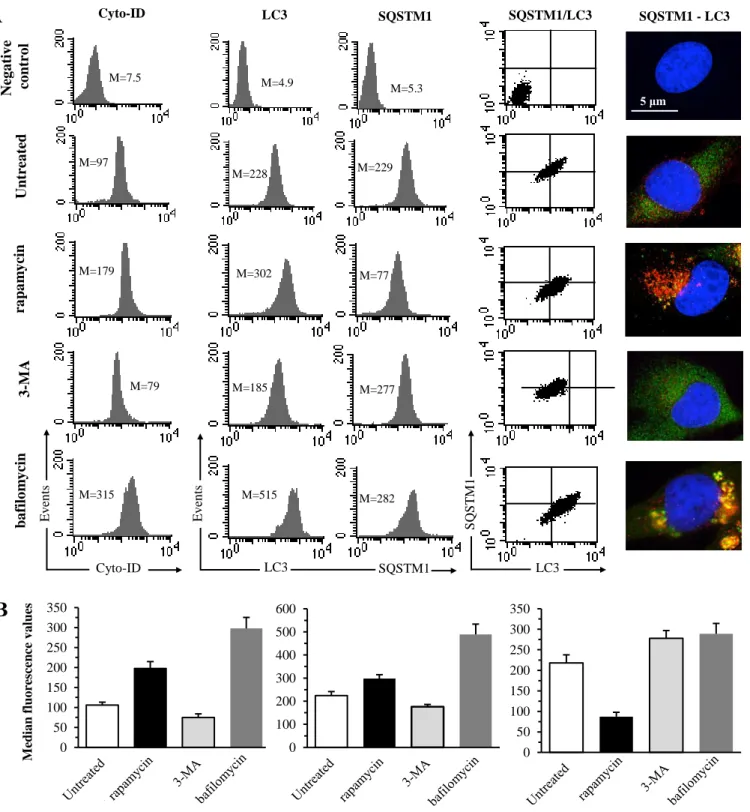
Figure S1. Autophagy evaluation performed by flow and static cytometry in 2FTGH cells under different experimental conditions. 2FTGH fibroblasts were treated or not with 50 nM rapamycin (Enzo Life Sciences, BML-A275-0025) for 4 h, 10 mM 3-MA Aldrich, M9281) overnight, or 1 μM bafilomycin (Sigma-Aldrich, B1793) for 4 h. At the end of treatment cells were harvested and analyzed by flow cytometry after single staining with Cyto-ID autophagy detection kit (Enzo Life Sciences, ENZ-51031-K200, left panel), or double staining, after fixation and permeabilization, with LC3 (mouse, Invitrogen, GT3612) and anti-SQSTM1 (rabbit, Abcam, ab91526) primary antibodies followed by anti-mouse Alexa Fluor 488 (Invitrogen, A32723, red in figure) and anti-rabbit Alexa Fluor 594-conjugated (Invitrogen, A32740, green in figure) secondary antibodies (central panels), as reported in Material and Methods section. For fluorescence microscopy cells were fixed, permeabilized and stained directly on lenticular slides (pictures in the right panel). In (A) are shown results obtained in a representative experiment. Numbers represent the median fluorescence intensity values of the histograms. Bar graphs in (B) report the mean ± SD of the results obtained in three independent experiments.
M=97 M=79 Cyto-ID Ev en ts M=228 M=185 M=277 Ev en ts LC3 SQSTM1 S QST M 1 LC3 Cyto-ID LC3 SQSTM1 SQSTM1/LC3 SQSTM1 - LC3 Neg a tiv e co ntr o l Unt re a ted ra pa m y cin 3 -MA ba filo m y cin M=315 M=7 M=7.5 M=4.9 M=5.3 M=302 M=77 M=179 M=515 M=229 M=282
A
5 μm M ed ia n flu o re sc e n ce v a lu es Cyto-ID LC3 SQSTM1B
0 50 100 150 200 250 300 350 0 100 200 300 400 500 600 0 50 100 150 200 250 300 350FRET
Negative control
Untreated cells
Demecolcine
Paclitaxel
Anti-TUBA Anti-TUBB TUBA-TUBB
M=21 M=24 M=19 M=27 M=23 M=29 0 1 2 3 4
Untreated Demecolcine Paclitaxel
FR E T ef ficie n c y FL3 (FRET) E v en ts
A
B
26.1 9.7 49.5 anti-mouse PEFigure S2. As positive control for FRET method, 2FTGH fibroblasts were treated overnight with Demecolcine (0.05 μg/ml, SIGMA-Aldrich, D7385) or with Paclitaxel (10 nM, Sigma-Aldrich, T7191). At the end of treatment cells were double stained with an anti-TUBA monoclonal antibody (Sigma-Aldrich, T9026) and an anti-TUBB polyclonal antibody (Thermo Fisher Scientific, PA1-41331) followed by a goat anti-rabbit IgG H&L (Cy5) preadsorbed (Abcam, ab6564), and a goat F(ab')2 anti-mouse IgG-Fc (PE) pre-adsorbed (Abcam, ab5881) to quantify molecular association TUBA-TUBB by quantitative FRET. As expected, treatment with Demecolcine, able to depolymerizes microtubules, significantly reduced the molecular association TUBA-TUBB compared to untreated cells. In contrast, Paclitaxel, known to stabilize microtubule polymer, induced a significant increase in the molecular association between TUBA and TUBB. Importantly, the treatment with either drugs did not induce a substantial alteration of the expression of the two proteins (see numbers in A), but only modified their degree of association, as revealed by quantification of FRET efficiency by Riemann's algorithm (bar graph at the bottom). (A) FACS histograms showing results obtained in representative experiments. Numbers represent median fluorescence intensity (in first and second columns) or the percentage of FL3-positive cells (in third column). (B) Bar graph reporting the mean ± SD of the results obtained from three independent acquisitions.
FED HBSS 0 10 20 30 40
m
m
2E
R
/A
M
B
R
A
1
/E
R
L
IN
1
n.s. ER -GF P ER L IN1 AMB R A1 Control HBSS mm 2 E R :ERLI N1 :AMB R A1 p er ce ll Control HBSS Me rg e Figure S3. AMBRA1-ERLIN1-ER association during autophagy induction. 2F cells expressing ER-GFP (green in figure) were treated or not with HBSS 1 h and stained with anti-AMBRA1 (Cy3, red in figure), anti-ERLIN1 (Alexa Fluor 647, blue in figure) and with DAPI (Turquoise). Images were acquired using a LSM 900, Airyscan SR Zeiss confocal microscopy and the co-localization of ERLIN1 with AMBRA1 and ER-GFP was was measured using ZEN 3.0 Blue edition software and expressed as mm2 per cell. A minimum of 30 cells/ sample was analyzed and the statistical analysis was performed using Student’s t-test.ERLIN1
HSP90AA1
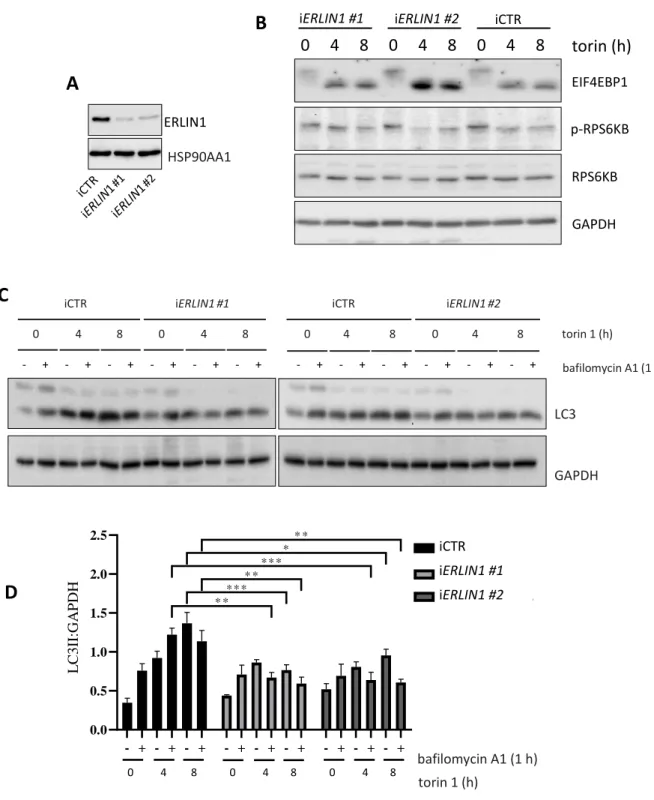
A
Figure S4. Autophagy flux evaluation in ERLIN1 downregulated cells treated with 100 nM torin 1. (A) ERLIN1 expression was downregulated by siRNA using two different oligonucleotides in 2F cells and western blotting was performed to evaluate ERLIN1 levels from three independent experiments; *p≤0.05. (B) Inhibition of MTOR activity by ERLIN1 downregulated 2F cells was evaluated by western blotting using anti p-RPS6KB1, anti-RPS6KB1 and anti-EIF4EBP1 antibodies. (C) siERLIN1 cells were treated with torin 1 (100 nM) for the indicated time points and incubated with the lysosome inhibitor bafilomycin A1 or vehicle for 1 h before lysis. LC3 lipidation was detected by immunoblotting
using a specific antibody; GAPDH was incubated as a loading control. (D) The graph reports mean ± SD of LC3-II - GAPDH from three independent experiments; *p≤0.05, **p≤0.01, ***p≤0.001using ANOVA 2-way test for repeated samples.
0 4 8 0 4 8 iCTR iERLIN1 #1 0 4 8 0 4 8 iCTR iERLIN1 #2 - + - + - + - + - + - + - + - + - + - + - + - + torin 1 (h) bafilomycin A1 (1 h) LC3 GAPDH - + - + - + - + - + - + - + - + - + 0.0 0.5 1.0 1.5 2.0 2.5 L C 3 / G A P D H iCTR iERLIN1 #1 Bafilomycin A1 (1h) TORIN (hrs) 0 4 8 0 4 8 iERLIN1 #2 * * ** * ** * * * * * * 0 4 8
D
EIF4EBP1 p-RPS6KB RPS6KB GAPDH 0 4 8 0 4 8 0 4 8 torin (h)C
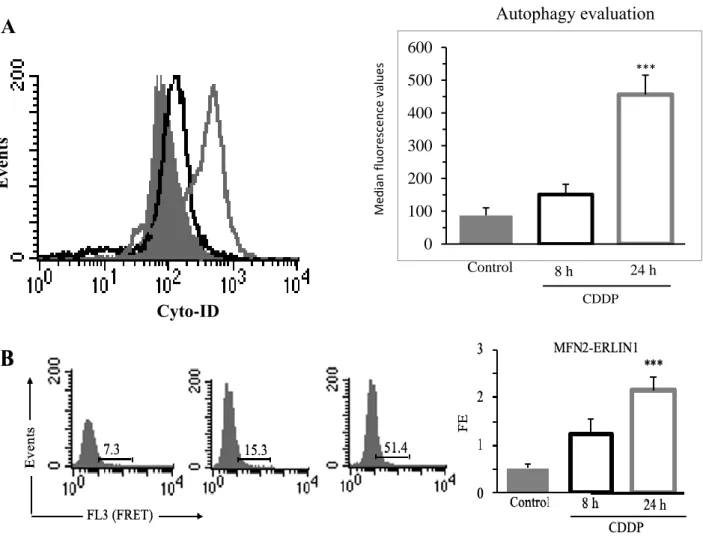
iCTR iERLIN1 #1 iERLIN1 #2 torin 1 (h) bafilomycin A1 (1 h) 0 4 8 0 4 8 0 4 8 L C 3 II :G A P DHE ve n ts Cyto-ID Me d ian fl u o re sc e n ce valu e s Control 8 h 24 h CDDP 0 100 200 300 400 500 600
A
*** Autophagy evaluationFigure S5. CDDP cell treatment induced autophagy and MFN2-ERLIN1 association. (A) Flow cytometry analysis of autophagy in untreated cells (Control, full gray curves) and after treatment with 8 μM CDDP for 8 h (empty black curve) or 24 h (empty grey curve) performed with a Cyto-ID Autophagy Detection kit. Numbers represent the mean ± SD of the median fluorescence intensity obtained in three independent experiments. A representative experiment among three is shown. Bar graph shows the mean ± SD obtained from three independent experiments. *** p ≤0.001 vs Control. (B) Quantitative evaluation of MFN2, considered a marker of MAM, and ERLIN1 molecular association by FRET technique in cells untreated (Control) or treated with CDDP 8 μM for 8 h or 24 h, as revealed by flow cytometry analysis. Numbers indicate the percentage of FL3-positive events (FRET channel), obtained in one experiment representative of three. Bar graphs on the right show the FRET efficiency, calculated according to the Riemann’s algorithm. Data are reported as mean ± SD from three independent experiments.
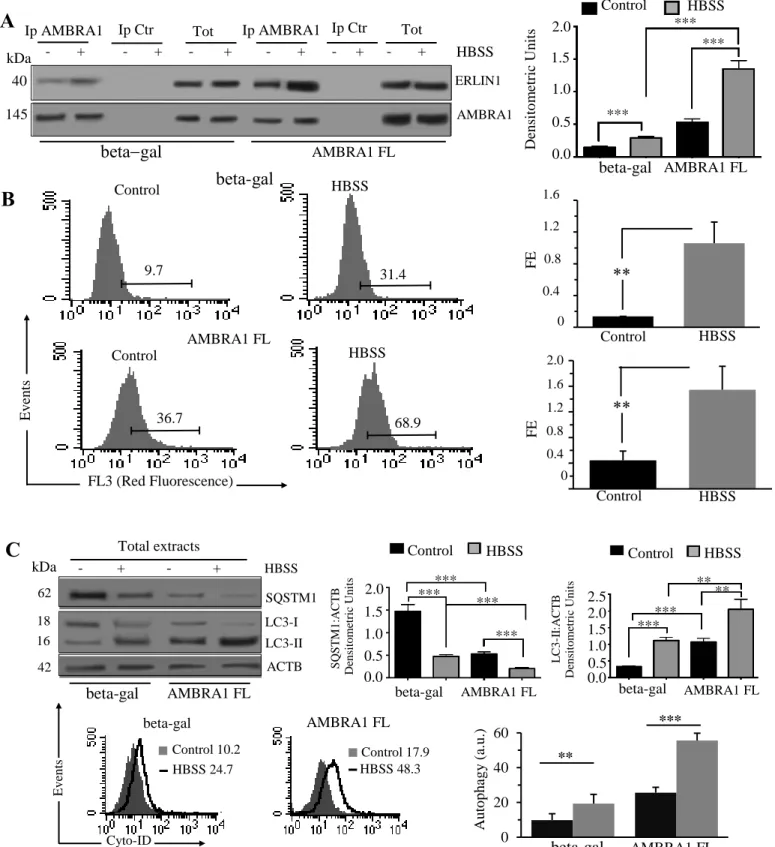
Figure S6. AMBRA1-ERLIN1 association during autophagy induction in AMBRA1 FL cells. (A) 2F cells were infected with
retroviral vectors encoding MYC-tagged AMBRA1 FL or (MYC-tagged beta-gal), untreated or treated with HBSS for 1 h, were lysed in lysis buffer. Protein extracts were subjected to IP using an anti-AMBRA1 PAb. A rabbit IgG isotypic control (IpCtr) was employed. The immunoprecipitates were analyzed for the presence of ERLIN1 by western blot analysis using anti-ERLIN1 MAb. A representative experiment among 3 is shown. ***p≤0.001. As a control, the immunoprecipitates were assessed by immunoblot with anti-AMBRA1 MAb. (B) Quantitative evaluation of AMBRA1-ERLIN1 association by FRET technique in both MYC-tagged AMBRA1 FL and MYC-tagged beta-gal, untreated or treated with HBSS, as revealed by flow cytometry analysis. Numbers in the first and second panels indicate the percentage of FL3-positive events (FRET channel), obtained in one experiment representative of 3. Bar graphs on the right show the FRET efficiency, calculated according to the Riemann’s algorithm, of AMBRA1 and ERLIN1 molecular association. Data are reported as mean ± SD from 3 independent experiments. (C) Upper panels, autophagy analysis by western blot, using rabbit anti-LC3 PAb or rabbit anti-SQSTM1 MAb. Loading control was evaluated using anti-ACTB MAb. Bar graph on the right panel shows densitometric analysis. Lower panels, semiquantitative flow cytometry analysis performed with a Cyto-ID Autophagy detection kit; on the right panel shows densitometric analysis. Results represent the mean ± SD from 3 independent experiments. **p≤0.01 and ***p≤0.001
betagal AMBRA1 FL ERLIN1 AMBRA1 kDa 145 Ip AMBRA1 Tot - + - + - + - + - + - + HBSS 40 AMBRA1 FL 0.0 0.5 1.0 1.5 *** *** beta-gal Den si to m etr ic U n its Control HBSS 9.7 31.4 beta-gal FL3 (Red Fluorescence) E v en ts Control HBSS 36.7 68.9 AMBRA1 FL
B
AMBRA1FL Control HBSS beta-gal S Q S T M 1 :A C T B D en si to me tr ic U n it s *** *** *** *** 0.0 0.5 1.0 1.5 2.0 HBSS beta-gal AMBRA1FL *** *** ** ** L C 3 -I I: A C T B D en si to me tr ic U n it s 0.0 0.5 1.0 1.5 2.0 2.5 kDa HBSS 62 18 16 42 - + - + SQSTM1 LC3-I LC3-II ACTB Total extracts beta-gal AMBRA1 FL HBSS 24.7 Control 10.2 HBSS 48.3 Control 17.9 Cyto-ID Ev en tsC
beta-gal AMBRA1 FL 0 20 40 60 ** *** beta-gal AMBRA1 FL Au to p h a g y ( a. u .) FE ** 0 0.4 0.8 1.2 1.6 Control HBSS ** 0 0.4 0.8 1.2 1.6 2.0 FE Control HBSS ** ControlFigure S7. A summary scheme showing as the knocking down MFN2, ST8SIA1 or ERLIN1 expression impairs the interaction AMBRA1-ERLIN1 and AMBRA1-MFN2 hindering autophagy.
HBSS
AMBRA1-ERLIN1 association AMBRA1-MFN2 associationAutophagy induction
AMBRA1 ERLIN1 MFN2 GD3MAM
MAM
AMBRA1 ERLIN1 MFN2 GD3Mult
imol
ecu
la
r
com
pl
ex
Autophagy stimuli
affinity purification and LC/Orbitrap.
A
Gene Names
Protein
Descriptions Uniprot Proteins
Peptides (seq) Sequence Coverage [%] PEP AMBRA1;KIAA1736 Isoform 1 of BECN1; Isoform3 of BECN1 Q9C0C71;Q9C0C7; B4DZ97;Q9C0C7-3;Q9C0C7-2 3 69 58.3 0 ERLIN1;C10orf69;KE04;KEO4; SPFH1;RP11-316M21.1-003 ER lipid raft associated 1 O75477;B2RDK6; B4DPN7;B0QZ43 2 9 25.6 4.01E-90 B Exp1a Ratio Ambra FLAG-HA/Ambra untagged Exp1a Ratio Ambra FLAG-HA/Ambra untagged Exp1a Ratio Ambra FLAG-HA/Ambra untagged Exp1a Ratio Ambra FLAG-HA/Ambra untagged Exp1a Ratio Ambra FLAG-HA/Ambra untagged Exp1a Ratio Ambra FLAG-HA/Ambra untagged 7.26 135.70 1233 7.74 139.53 1232 1.46 59.58 37 1.62 50.59 37 C Exp2a Ratio Ambra FLAG-HA/Ambra untagged Exp2a Ratio Ambra FLAG-HA/Ambra untagged Variability [%] Exp2a Ambra FLAG-HA/Ambra untagged Count Exp2b Ratio Ambra FLAG-HA/Ambra untagged
Exp2b Ratio Ambra FLAG-HA/Ambra untagged Variability [%] Exp2b Ambra FLAG-HA/Ambra untagged Count 77.32 100.91 144 1.24 24.18 219 2.19 9.68 3 1 D Exp3a Ratio Ambra FLAG-HA/Ambra untagged Exp3a Ratio Ambra FLAG-HA/Ambra untagged Exp3a Ratio Ambra FLAG-HA/Ambra untagged Exp3a Ratio Ambra FLAG-HA/Ambra untagged Exp3a Ratio Ambra FLAG-HA/Ambra untagged Exp3a Ratio Ambra FLAG-HA/Ambra untagged 21.36 65.25 70 0.67 41.12 106 2.54 11.90 3 1.06 0.82 2
Experiments were performed using SILAC-labeled cells as described [Antonioli et al. 2014]. Results from three independent experiments performed in duplicate are reported.
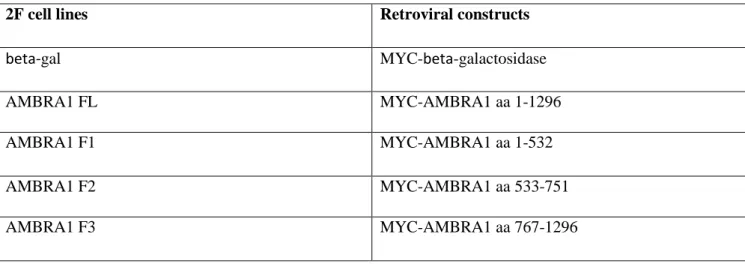
Table S2. Cell lines used in the study
2F cell lines Retroviral constructs
beta-gal MYC-beta-galactosidase
AMBRA1 FL MYC-AMBRA1 aa 1-1296
AMBRA1 F1 MYC-AMBRA1 aa 1-532
AMBRA1 F2 MYC-AMBRA1 aa 533-751
Gene Names Protein Descriptions Uniprot Proteins Peptides (seq) Sequence Coverage [%] PEP Exp1a Ratio Ambra FLAG-HA/Ambra untagged Exp1a Ratio Ambra HA/Ambra untagged Variability [%] Exp1a Ambra HA/Ambra untagged Count Exp1b Ratio Ambra HA/Ambra untagged Exp1b Ratio Ambra FLAG-HA/Ambra untagged Variability [%] Exp1b Ambra FLAG-FLAG-HA/Ambra untagged Count Exp2a Ratio Ambra FLAG-FLAG-HA/Ambra untagged Exp2a Ratio Ambra FLAG-FLAG-HA/Ambra untagged Variability [%] Exp2a Ambra FLAG-HA/Ambra untagged Count Exp2b Ratio Ambra FLAG-HA/Ambra untagged Exp2b Ratio Ambra FLAG-HA/Ambra untagged Variability [%] Exp2b Ambra FLAG-HA/Ambra untagged Count Exp3a Ratio Ambra FLAG-HA/Ambra untagged Exp3a Ratio Ambra FLAG-HA/Ambra untagged Variability [%] Exp3a Ambra FLAG-HA/Ambra untagged Count Exp3b Ratio Ambra FLAG-HA/Ambra untagged Exp3b Ratio Ambra FLAG-HA/Ambra untagged Variability [%] Exp3b Ambra FLAG-HA/Ambra untagged Count
AMBRA1;KIAA1736 Isoform 1 of Activating molecule in BECN1-regulated autophagy protein 1;Isoform 3 of Activating molecule in BECN1-regulated autophagy protein 1;Isoform 2 of Activating molecule in BECN1-regulated autophagy protein 1 Q9C0C7-1;Q9C0C7;B4DZ97;Q9C0C7-3;Q9C0C7-2 3 69 58.3 0 7.26 135.70 1233 7.74 139.53 1232 77.32 100.91 144 1.24 24.18 219 21.36 65.25 70 0.67 41.12 106
ERLIN1;C10orf69;KE04;KEO4;SPFH1;RP11-316M21.1-003 ER lipid raft associated 1;ER lipid raft associated 1 O75477;B2RDK6;B4DPN7;B0QZ43 2 9 25.6 4.01E-90 1.46 59.58 37 1.62 50.59 37 2.19 9.68 3 1 2.54 11.90 3 1.06 0.82 2