HAL Id: inserm-00663912
https://www.hal.inserm.fr/inserm-00663912
Submitted on 27 Jan 2012
HAL is a multi-disciplinary open access
archive for the deposit and dissemination of
sci-entific research documents, whether they are
pub-lished or not. The documents may come from
teaching and research institutions in France or
abroad, or from public or private research centers.
L’archive ouverte pluridisciplinaire HAL, est
destinée au dépôt et à la diffusion de documents
scientifiques de niveau recherche, publiés ou non,
émanant des établissements d’enseignement et de
recherche français ou étrangers, des laboratoires
publics ou privés.
microarray experiments.
Magalie Celton, Alain Malpertuy, Gaëlle Lelandais, Alexandre de Brevern
To cite this version:
Magalie Celton, Alain Malpertuy, Gaëlle Lelandais, Alexandre de Brevern. Comparative analysis of
missing value imputation methods to improve clustering and interpretation of microarray experiments..
BMC Genomics, BioMed Central, 2010, 11 (1), pp.15. �10.1186/1471-2164-11-15�. �inserm-00663912�
R E S E A R C H A R T I C L E
Open Access
Comparative analysis of missing value imputation
methods to improve clustering and interpretation
of microarray experiments
Magalie Celton
1,2, Alain Malpertuy
3, Gaëlle Lelandais
1,4, Alexandre G de Brevern
1,4*Abstract
Background: Microarray technologies produced large amount of data. In a previous study, we have shown the interest of k-Nearest Neighbour approach for restoring the missing gene expression values, and its positive impact of the gene clustering by hierarchical algorithm. Since, numerous replacement methods have been proposed to impute missing values (MVs) for microarray data. In this study, we have evaluated twelve different usable methods, and their influence on the quality of gene clustering. Interestingly we have used several datasets, both kinetic and non kinetic experiments from yeast and human.
Results: We underline the excellent efficiency of approaches proposed and implemented by Bo and co-workers and especially one based on expected maximization (EM_array). These improvements have been observed also on the imputation of extreme values, the most difficult predictable values. We showed that the imputed MVs have still important effects on the stability of the gene clusters. The improvement on the clustering obtained by hierarchical clustering remains limited and, not sufficient to restore completely the correct gene associations. However, a common tendency can be found between the quality of the imputation method and the gene cluster stability. Even if the comparison between clustering algorithms is a complex task, we observed that k-means approach is more efficient to conserve gene associations.
Conclusions: More than 6.000.000 independent simulations have assessed the quality of 12 imputation methods on five very different biological datasets. Important improvements have so been done since our last study. The EM_array approach constitutes one efficient method for restoring the missing expression gene values, with a lower estimation error level. Nonetheless, the presence of MVs even at a low rate is a major factor of gene cluster instability. Our study highlights the need for a systematic assessment of imputation methods and so of dedicated benchmarks. A noticeable point is the specific influence of some biological dataset.
Background
Numerous genomes from species of the three kingdoms are now available [1,2]. A major current aim of biologi-cal research is to characterize the function of genes, for instance their cellular regulation pathways and implica-tions in pathology [3-7]. High-throughput analyses (e.g., Microarrays) combined with statistical and bioinfor-matics data analyses are necessary to decipher such complex biological process [8,9]. Microarrays technolo-gies allow the characterization of a whole-genome
expression by measuring the relative transcript levels of thousand of genes in one experiment [10,11]. For instance, their relevancies were proved for the classifica-tion/identification of cancer subtype or diseases [12-17].
However, technical limitations or hazards (dust, scratches) lead to corrupted spots on microarray [18]. During the image analysis phase, corrupted or suspi-cious spots are filtered [11], generating missing data [18]. These missing values (MVs) disturb the gene clus-tering obtained by classical clusclus-tering methods, e.g., hierarchical clustering [19], k-means clustering [20], Kohonen Maps [21,22] or projection methods, e.g., Prin-cipal Component Analysis [23]. In practice, three differ-ent options can be considered. The first method leads * Correspondence: [email protected]
1
INSERM UMR-S 726, Equipe de Bioinformatique Génomique et Moléculaire (EBGM), DSIMB, Université Paris Diderot - Paris 7, 2, place Jussieu, 75005, France
© 2010 Celton et al; licensee BioMed Central Ltd. This is an Open Access article distributed under the terms of the Creative Commons Attribution License (http://creativecommons.org/licenses/by/2.0), which permits unrestricted use, distribution, and reproduction in any medium, provided the original work is properly cited.
to the elimination of genes, i.e., information loss [5]. The eliminated genes may be numerous and among them some may be essential for the analysis of the stu-died mechanism [24]. The second method corresponds to the replacement by zero [13]; it brings up a different problem in the analysis. Indeed, real data close to 0 will be confused with the MVs. Thus to limit skews related to the MVs, several methodologies using the values pre-sent in the data file to replace the MVs by estimated values have been developed [25].
The most classical method to estimate these values is the k-nearest neighbours approach (kNN), which com-putes the estimated value from the k closest expression profiles among the dataset [26]. This approach was applied to DNA chips by Troyanskaya and collaborators [27] and rapidly became one of the most popular meth-ods. Since this pioneer study, more sophisticated approaches have been proposed, like Sequential kNN (SkNN) [28].
Simple statistical methods have been also proposed as the Row Mean [29]/Row Average method [28], or approaches based on the Expectation Maximisation algorithm (EM), e.g., EM_gene and EM_array [29]. Prin-ciple of least square (LS) has been also widely used, e.g.,
LSI_gene, LSI_array, LSI_combined and LSI_adaptative [29]. Kim and co-workers have extended the Least Square Imputation to Local Least Square Imputation (LLSI) [28]. However this method is only based on the similarity of genes for estimating the missing data. Others more sophisticated methods like the Bayesian Principal Component Analysis (BPCA) [30] combines a principal component regression, a Bayesian estimation and a variational Bayes (VB) algorithm.
The MVs replacement in microarrays data is a recent research field and numerous new and innovative meth-odologies are developed. We can noticed the work of Bar-Joseph et al. who described a model-based spline fitting method for time-series data [31] and Schliep et
al. who used hidden Markov models for imputation [32]. Tuikkala and co-workers have investigated the interest to use GO annotation to increase the imputa-tion accuracy of missing values [33] as Kim et al. [34]. Hu et al. and Jörnsten et al. have incorporated informa-tion from multiple reference microarray dataset to improve the estimation [35,36], while Gan co-workers takes into consideration the biological characteristics of the data [37]. Hua and Lai did not propose a new method, but assess the quality of imputation on the con-cordance of gene prioritization and estimation of true/ false positives [38].
In addition we can list the following relevant meth-odologies applied in MVs replacement for microarray analysis: Support Vector Regression [39], Factor Analysis
Regression [40], Ordinary Least Square Impute [41],
Gaussian Mixture Clustering[42], LinCmb [43],
Collat-eral Missing Value Estimation[44], Linear based model
imputation[45], Dynamic Time Warping [46] or
itera-tive kNN[47,48].
In a previous study, we estimated the influence of MVs on hierarchical clustering results and evaluated the effectiveness of kNN approach [49]. We observed that even a low rate of missing data can have important effects on the clusters obtain by hierarchical clustering methods. Recently, this phenomenon was confirmed by Wong and co-workers for other particular clustering methods [50].
Since our work, numerous replacement methods (see Table 1 and previous paragraphs) have been developed to estimate MVs for microarray data. Most of the time, the new approaches are only compared to kNN. In this study, we decided to evaluate the quality of MV imputa-tions with all usable methods, and their influence on the quality of gene clustering. The present paper undertakes a large benchmark of MVs replacement methods to ana-lyze the quality of the MVs evaluation according to experimental type (kinetic or not), percentage of MVs, gene expression levels and data source (Saccharomyces
cerevisiae and human).
Results
General principle
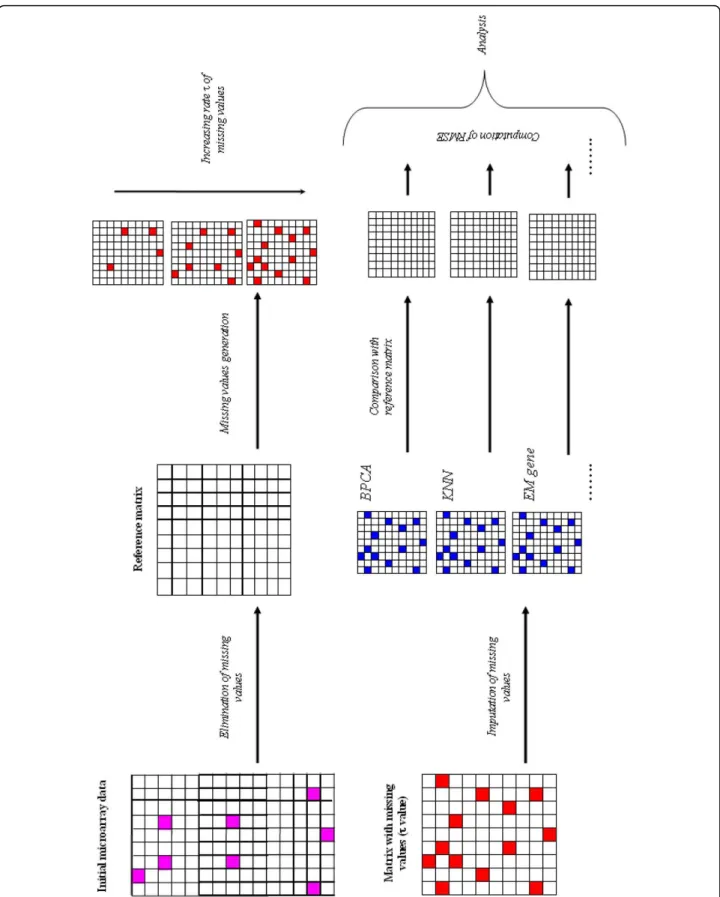
Figure 1 shows the general principle of the analysis. From the initial gene expression datasets, the series of observations with missing values are eliminated to create a Reference matrix. Then simulated missing values are generated for a fixed τ percentage and are included in the Reference matrix. In a second step, these simulated missing values are imputed using the different available methods. Difference between the replaced values and the original true values is finally evaluated using the root mean square error (RMSE) (see Methods). In this work, we chose 5 microarray datasets, very different one from the other, i.e., coming from yeasts and human cells, and with or without kinetics (see Table 2). The idea was to have the broadest possible vision types of expression data [see Additional file 1 for more details [49,51-54]].
Our goals were also (i) to evaluate methods that experimental scientists could use without intervention, (ii) to select only published methods, and (iii) to analyse influence of the gene clusters. Indeed, some studies have been done to compare numerous methods, e.g., [55], but does not go through the clustering; while less frequent researches goes through the clustering, but test only a limited number of imputation methods as [56]. We so have searched all kinds of published imputation meth-ods with available dedicated softwares or codes, when-ever the Operating System, language or software. From
this search, we selected 12 available replacement meth-ods, which were compatible with high-throughput com-putation. Others methods had not been used due to the unavailability of the program despite the indication in the corresponding papers or to impossibility to modify the source code to used our microarrays data.
Error rate for each replacement method
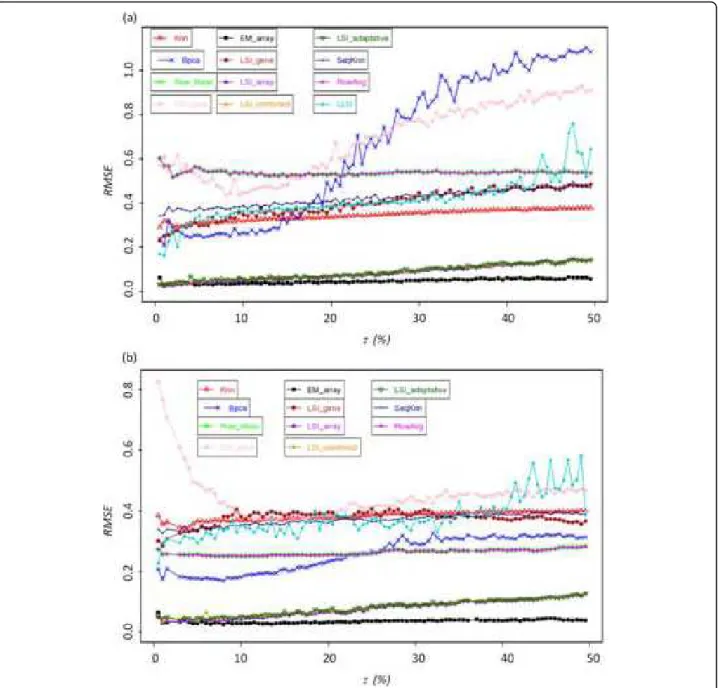
Figure 2 shows the dispersion of expected and true values, for three given imputation methods. On one hand, kNN and EM_gene approaches exhibit a high dis-persion between expected and true values; the correla-tions R equal respectively 0.33 and 0.32 (see Figures 2a and 2b). On the other hand EM_array approach pre-sents a highly better agreement with a R value of 0.97 (see Figure 2c). Figure 3 shows the evolution of RMSE values for τ ranging between 0.5 and 50% using the two datasets GHeat and OS. These two examples are good illustrations of the different behaviours observed with the different replacement methods. Some have initial high RMSE values and remains quite consistent, while others have lower initial RMSE values but are very sen-sitive to an increased rate of MVs. Moreover,
performances for the different methods appeared to be dependant of the used dataset.
• EM_gene[29]: This method is always associated to very high RMSE values, which range in an interval from 0.6 to 0.7 for a rate τ ranging from 0.5 to 3.0% (see Fig-ure 3b) and decrease for values from 0.30 to 0.40. Such a curved profile is observed for the datasets OS and GH2O2 (see Figure 3a). For the other dataset, RMSE increases as expected (see Figure 3a), but is always asso-ciated to high RMSE values.
• kNN[27]: Its RMSE values for all six data files always range between 0.3 and 0.4. The increase of τ only affects slightly the kNN approximation, at most 0.05 for the datasets B and OS. This constancy of RMSE values implies that for high rates of missing data (more than 20% of missing data) the RMSE values remain acceptable.
• SkNN[28]: Despite the fact that SkNN is an improve-ment of kNN, their RMSE values are surprisingly always higher than the one of kNN (from 0.01 to 0.08). Only with the dataset B, SkNN performs slightly better than
kNN(RMSE difference of 0.076).
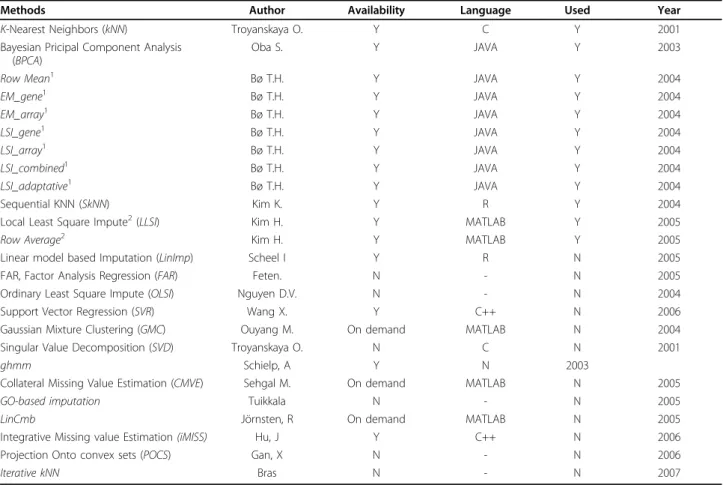
Table 1 Different missing values replacement methods.
Methods Author Availability Language Used Year K-Nearest Neighbors (kNN) Troyanskaya O. Y C Y 2001 Bayesian Pricipal Component Analysis
(BPCA)
Oba S. Y JAVA Y 2003
Row Mean1 Bø T.H. Y JAVA Y 2004
EM_gene1 Bø T.H. Y JAVA Y 2004 EM_array1 Bø T.H. Y JAVA Y 2004 LSI_gene1 Bø T.H. Y JAVA Y 2004 LSI_array1 Bø T.H. Y JAVA Y 2004 LSI_combined1 Bø T.H. Y JAVA Y 2004 LSI_adaptative1 Bø T.H. Y JAVA Y 2004 Sequential KNN (SkNN) Kim K. Y R Y 2004
Local Least Square Impute2(LLSI) Kim H. Y MATLAB Y 2005
Row Average2 Kim H. Y MATLAB Y 2005
Linear model based Imputation (LinImp) Scheel I Y R N 2005 FAR, Factor Analysis Regression (FAR) Feten. N - N 2005 Ordinary Least Square Impute (OLSI) Nguyen D.V. N - N 2004 Support Vector Regression (SVR) Wang X. Y C++ N 2006 Gaussian Mixture Clustering (GMC) Ouyang M. On demand MATLAB N 2004 Singular Value Decomposition (SVD) Troyanskaya O. N C N 2001
ghmm Schielp, A Y N 2003
Collateral Missing Value Estimation (CMVE) Sehgal M. On demand MATLAB N 2005
GO-based imputation Tuikkala N - N 2005
LinCmb Jörnsten, R On demand MATLAB N 2005
Integrative Missing value Estimation (iMISS) Hu, J Y C++ N 2006 Projection Onto convex sets (POCS) Gan, X N - N 2006
Iterative kNN Bras N - N 2007
Is given the name of the methods, the authors, its availability, if we have used it (Y) or not (N) and the publication year.
1
Package Bø T.H.
Figure 1 Principle of the method. The initial data matrix is analyzed. Each gene associated to at least one missing value (in pink) is excluded given a Reference matrix without any missing value. Then missing values are simulated (in red) with a fixed rate τ. This rate τ goes from 0.5% to 50% of missing values by step of 0.5%. 100 independent simulations are done each time. Missing values are then imputed (in blue) for each simulations by the selected methods. RMSE is computed between the estimated values of missing values and their true values.
Table 2 The different datasets used
Ogawa et al., 2000 Gasch et al., 2000 Bohen S.P et al., 2002
Lelandais et al., 2005 Organism Saccharomyces cerevisiae Saccharomyces cerevisiae human
Saccharomy-ces cerevisiae
Initial gene number 6013 6153 16523 5261
Initial number of conditions 8 178 16 6
Missing values (%) 0.8 3 7.6 11.4
Genes with missing values (%)
3,8 87,7 63,6 88.29
Genes erased from the study
230 NA NA 616
Conditions erased from the study 0 136 0 0 Ogawa_Complet (OC) Ogawa_subset (OS) Gasch HEAT (GHeat) Gasch H2O2 (GH2O2) Bohen (B) Lelandais (L) Kinetics N N Y N N Y
Final gene numbers 5783 827 523 717 861 4645
Final condition number 8 8 8 10 16 6
Figure 2 Example of three methods. Distribution of predicted values (y-axis) in regards to true values (x-axis). Estimation of the missing values has been done (a) by kNN approach, (b) EM_gene and (c) EM_array. The dataset used is the Bohen set with τ values ranging from 0.5% to 50% of missing values with a step of 0.5. 10 independent simulations have been done for each τ value.
• LLSI[57]: The average RMSE values of LLSI ranges mainly from 0.34 to 0.41 for most of the dataset. Its per-formance could be considered as median and its effec-tiveness is close to the LSI_gene method. Its RMSE values increase gradually with the increase of τ, i.e., 0.1 from 0.5 to 50% of missing data. It is the less efficient method based on least square regressions. However for the dataset L, this method is the most powerful after the
LSIsmethods (see below).
• LSI_gene[29]: The effectiveness of LSI_gene is slightly affected by the increase in the percentage of missing data. For each data file, the values of RMSE range
between 0.3 and 0.4. These results are close to those observed for methods LLSI and kNN, i.e., methods giv-ing of the medium results ranggiv-ing between the best (LSI_array) and the less efficient methods (EM_gene).
• Row Mean[29] and Row Average [57]: Low RMSE values are observed for L (0.23) and B (0.28) datasets. Only for dataset GHeat, the RMSE value is high (0.54). Strikingly this method shows equivalent and or better results than more elaborated approaches.
• BPCA[30]: For the OC, OS and GH2O2 datasets, and for τ comprises in the range 0.5 to 10-15% of missing data, BPCA appears to have one of the lowest RMSE Figure 3 Missing value imputation. RMSE value for (a) GHeatsubset and (b) for OS for rate of missing value going from 0.5% to 50% by step of
values [see Additional file 2], only bypass by two other approaches. This method is powerful for low rates of missing values. However it should be noted that the effi-ciency of BPCA is strongly reduced when the rate of missing data increases. This is particularly notable in the case of the GHeat dataset. The values of the RMSE increases from 0.2 to 1.1 (see Figure 3a). For a τ value higher than 30%, BPCA performs worst than most of the imputation methods. This observation is less striking for the other datasets. For B and OS datasets, RMSE values increase by a maximum of 0.1 for τ increasing from 0.5 to 50%. It is a good illustration of the dataset specificity related to the quality of the imputation methods.
• LSI_array, LSI_combined, LSI_adaptative and
EM_array[29]: Their RMSE values are always lower than 0.1. Remarkably, it is true even for a rate of miss-ing data that equals 50%. The average RMSE values of
EM_array are slightly lower than the ones of the three other methods. It is striking when the rate of missing data exceeds 20%. A pair-wise comparison shows that
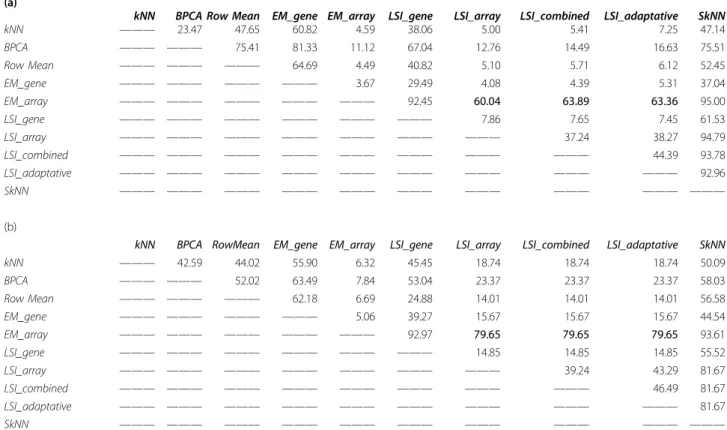
EM_array is better than the three other methods; its approximation is better in 2/3 of the case. If τ is higher than of 33%, this method remains the best one in 80% of the cases (see Table 3 for two examples).
The different datasets influence the quality of the imputation
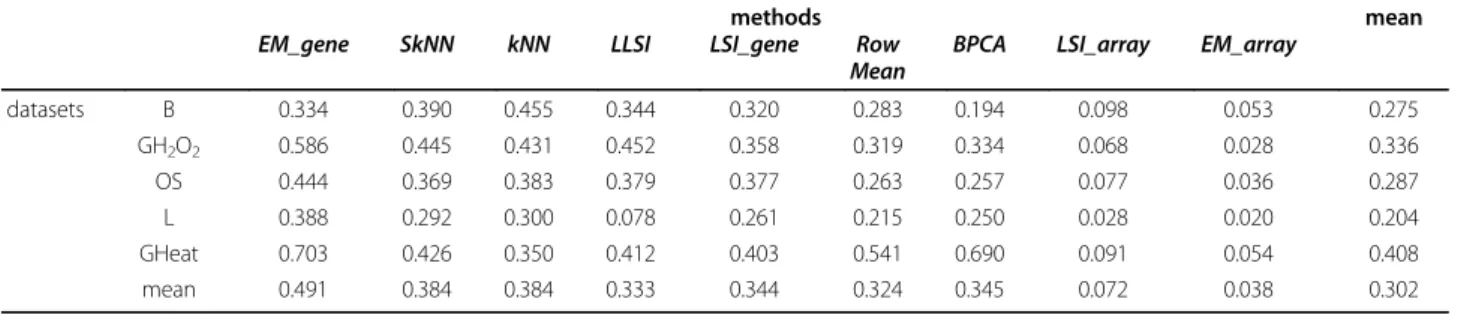
Table 4 shows the average RMSE values for each impu-tation methods. They are given as the average of all the simulations ranging from τ = 0.5 to 50% (50,000 inde-pendent simulations per imputation method). This table highlights the differences that were observed between the datasets. Nonetheless, it allowed us to rank the methods in term of efficiency. Roughly, we could iden-tify three groups: The first one comprise four methods (EM_array, LSI_array, LSI_combined and
LSI_adapta-tive) for which small RMSE values were always observed (EM_array always exhibited the best performances); (2) the second group comprised 4 methods, i.e., BPCA, Row
Mean, LSI_gene and LLSI; (3) and finally the third group, which can be considered as the last group, com-prised three methods, i.e., kNN, SkNN and EM_gene.
Notably, this order depends on the dataset, but still the changes are often limited. For instance, EM_gene per-forms better than kNN and SkNN for B dataset, but does not perform better than the others. Strong changes could be noted for OS that allows SkNN to be better than LLSI and LSI_gene. Nonetheless, it is mainly due to the poor quality of the estimation of these two methods with this dataset. For the L dataset, we observed that LLSI method
Table 3 Pairwise comparison of imputation method.
(a)
kNN BPCA Row Mean EM_gene EM_array LSI_gene LSI_array LSI_combined LSI_adaptative SkNN kNN ——— 23.47 47.65 60.82 4.59 38.06 5.00 5.41 7.25 47.14 BPCA ——— ——— 75.41 81.33 11.12 67.04 12.76 14.49 16.63 75.51 Row Mean ——— ——— ——— 64.69 4.49 40.82 5.10 5.71 6.12 52.45 EM_gene ——— ——— ——— ——— 3.67 29.49 4.08 4.39 5.31 37.04 EM_array ——— ——— ——— ——— ——— 92.45 60.04 63.89 63.36 95.00 LSI_gene ——— ——— ——— ——— ——— ——— 7.86 7.65 7.45 61.53 LSI_array ——— ——— ——— ——— ——— ——— ——— 37.24 38.27 94.79 LSI_combined ——— ——— ——— ——— ——— ——— ——— ——— 44.39 93.78 LSI_adaptative ——— ——— ——— ——— ——— ——— ——— ——— ——— 92.96 SkNN ——— ——— ——— ——— ——— ——— ——— ——— ——— ——— (b)
kNN BPCA RowMean EM_gene EM_array LSI_gene LSI_array LSI_combined LSI_adaptative SkNN kNN ——— 42.59 44.02 55.90 6.32 45.45 18.74 18.74 18.74 50.09 BPCA ——— ——— 52.02 63.49 7.84 53.04 23.37 23.37 23.37 58.03 Row Mean ——— ——— ——— 62.18 6.69 24.88 14.01 14.01 14.01 56.58 EM_gene ——— ——— ——— ——— 5.06 39.27 15.67 15.67 15.67 44.54 EM_array ——— ——— ——— ——— ——— 92.97 79.65 79.65 79.65 93.61 LSI_gene ——— ——— ——— ——— ——— ——— 14.85 14.85 14.85 55.52 LSI_array ——— ——— ——— ——— ——— ——— ——— 39.24 43.29 81.67 LSI_combined ——— ——— ——— ——— ——— ——— ——— ——— 46.49 81.67 LSI_adaptative ——— ——— ——— ——— ——— ——— ——— ——— ——— 81.67 SkNN ——— ——— ——— ——— ——— ——— ——— ——— ——— ———
Is given the percentage of better approximation of one method versus another for a rate of missing value t equal to (a) 32% and (b) 48.5% with the OS dataset. The percentage is given in regards to the method given at the left.
performs well and remains better than other LSIs and
EM_arraymethods. GHeat dataset that is associated to the highest average RMSE values has strong particulari-ties as (i) kNN performs better than BPCA, Row Mean,
LSI_geneand LLSI, and (ii) BPCA and Row Mean per-forms poorly compared to other methods, being only slightly better than EM_gene. Hence, it appears that GHeat is a more difficult dataset to impute.
Extreme values
The same methodology was followed to analyze the extreme values, i.e., 1% of the microarray measurements with the highest absolute values. They have major biolo-gical key role as they represent the highest variations in regards to the expression reference [see Additional file 3]. Figure 4 presents similar examples to these of Figure 3, but this time, only extreme values were used in the
Table 4 Mean RMSE value for the different datasets
methods mean
EM_gene SkNN kNN LLSI LSI_gene Row Mean
BPCA LSI_array EM_array
datasets B 0.334 0.390 0.455 0.344 0.320 0.283 0.194 0.098 0.053 0.275 GH2O2 0.586 0.445 0.431 0.452 0.358 0.319 0.334 0.068 0.028 0.336 OS 0.444 0.369 0.383 0.379 0.377 0.263 0.257 0.077 0.036 0.287 L 0.388 0.292 0.300 0.078 0.261 0.215 0.250 0.028 0.020 0.204 GHeat 0.703 0.426 0.350 0.412 0.403 0.541 0.690 0.091 0.054 0.408 mean 0.491 0.384 0.384 0.333 0.344 0.324 0.345 0.072 0.038 0.302
Figure 4 Extreme values (representing 1% of the missing values). Evolution of RMSE according to τ ranging (a) from 0.5% to 30% of the extreme values for the Bohen dataset and (b) from 0.5% to 50% of the extreme values) for the Ogawa dataset.
analysis. Thus, the percentage of missing values τ can be differently apprehend, i.e., τ = 10% corresponds to 10% of the extreme missing values, so 0.1% of the values of the dataset. At one exception, all the replacement meth-ods decrease in effectiveness for the estimate of the extreme values. Performance of the methods also greatly depends on the used dataset and especially -in agree-ment with previous observation - in the case of the GHeat dataset. A description of the behaviour of each method is presented in Additional file 3. kNN [27] is the less powerful method in most of the case (see Figures 4a and 4b). Its average RMSE value is often 0.5 higher than the second poorest imputation method. Interestingly, in the case of the extreme values, SkNN improved greatly.
EM_gene[29] remains one of the less powerful methods for the imputation of missing values. LLSI [57] method effectiveness remains similar compared to the other methods of its group. Row Mean [29] and Row Average
[57] have RMSE values increased by 0.2 to 0.4 for the yeast dataset, which is correct in regards to other meth-ods (see Figures 6). Their efficiencies are median com-pared to the other methods. BPCA [30] has a correct behaviour. But contrary to most of them, it is very sensi-tive to the datasets. LSI_gene [29] has the lowest RMSE values observed after EM_array, LSI_array,
LSI_com-binedand LSI_adaptative. This result shows that LSIs, whatever the specificity of their implementations, are effective to impute the values missing.
EM_array method is again the most performing method (see previous section). Its RMSE values are almost identical to the ones previously computed.
LSI_array, LSI_combined and LSI_adaptative are slightly less efficient than previously seen. Thus, the clustering we have proposed remains pertinent when only the extreme values are implicated. LSI_array, LSI_combined,
LSI_adaptativeand EM_array are always good, and the
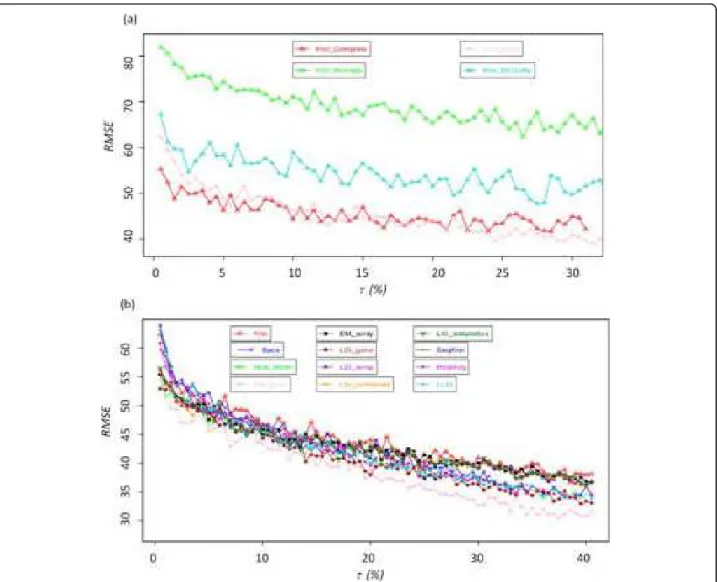
Figure 5 CPP of hierarchical clustering approach algorithm. (a) with complete, average, ward and McQuitty algorithm for OS with kNN and (b) with Ward algorithm for Ogawa dataset for the different imputation methods.
less efficient methods can be associated now to consid-erable RMSE values. Noticeably, kNN efficiency col-lapses and the influence of datasets on the imputation quality is sharpened.
Clustering in question
A critical point in the analysis of DNA data is the clus-tering of genes according to their expression values. Missing values have an important influence on the stabi-lity of the gene clusters [49,58]. Imputations of missing values have been used both to do hierarchical clustering (with seven different algorithms) and k-means [20] (see Methods).
Figure 5a shows the Cluster Pair Proportions (CPP, [49] see Methods section) of OS using hierarchical clus-tering with complete linkage, average linkage, McQuitty and Ward algorithm. CPP values of average linkage ranges between 78 and 68%, those of McQuitty between 58 and 45%, those of Ward between 57 and 35% and finally those of complete linkage between 50 and 41%. We obtain for the 7 hierarchical clustering algorithms the same behaviours than previously observed [49]: ran-ging from high CPP values for single linkage to low CPP values for Ward. This observation can be explained by the topology given by each algorithm, e.g., Ward gives well equilibrated clusters whereas single linkage creates few major clusters and numerous adjacent singletons.
For every hierarchical clustering methods the CPP values are different, but the general tendencies remain the same: (i) imputation of small rate τ of MVs has always a strong impact on the CPP values, and (ii) the
CPP values slowly decreased with the increased of τ. Between 0.5 and 3% of MVs and the CPP values decrease by 1 to 3% per step of 0.5% of MVs. From τ equals 3.5 to 20% of MVs, the values of CPP decrease overall by 10%. For higher rate of MVs the decreasing of CPP is slower. This loss of stability is present in the case of the k-means method and for each type of hier-archical classification (except for the methods single
linkageand centroid linkage, due to the building of the clusters).
Individual evaluation of the methods highlights the lack of efficiency of the EM_gene imputation method; it obtains always the lowest CPP values, i.e., 1.37 to 5.34% less than other approaches. At the opposite, EM_array,
LSI_array, LSI_combined and LSI_adaptative are
associated to the highest CPP values. In the case of the methods with a median efficiency, e.g., Row_Mean, their
CPP values could be assigned as median compared to the values of the other methods. Figure 5b shows the particular example of OS dataset. CPP values of BPCA (average value equals 42.6%) are close to the most powerful methods (42.8% for the four methods). More-over, in the classical range of τ less than 20%, it is the best. As seen in Table 4, BPCA is one of the best approaches for this dataset. Hence, common trends can be found between the quality of the imputation method and the gene cluster stability.
In addition, evaluation of imputation methods shows that the cluster quality depends on the dataset. For instance, with the dataset OS, imputation of missing values with kNN method gives an average CPP value (for the Ward algorithm) that equals 42.9%, while the average CPP values for all the other methods only equals 40.6% whereas its RMSE value is one of highest (see Table 4). The CPP differences are mainly bellow 5%. These results show that an improvement has been obtained since last study. Nonetheless, no new approaches had drastically improved the quality of the clustering. Interestingly, k-means approach had similar tendencies, underlining that this low improvement is not due to hierarchical clustering.
Another question is the comparison between hierarch-ical clustering algorithms and k-means. Nonetheless, comparison only between hierarchical clustering algo-rithms is already a difficult task. Comparison with
k-meansis so more difficult. Indeed, the use of the same number of clusters to compare the hierarchical cluster-ing algorithms with k-means can leads to a wrong con-clusion. Indeed, for an equivalent number of clusters, most of the CPP values of k-means are lower than CPP values obtained with hierarchical clustering algorithms. However, it is only due to the dispersion of observations within the clusters obtained by k-means approach. Thus, to have an unbiased comparison, the dispersion of genes within cluster between k-means and hierarchical cluster-ing algorithms must be computed. It had been done, as previously described [49]. Following this approach,
Ward and complete linkages were defined as the best approaches to assess an unbiased comparison. They have both CPP values lower than k-means CPP values. The differences were often higher than 5% underlining the interest of k-means approach to cluster gene expres-sion profiles.
Distribution of the observations
When index CPP is calculated, only one group is taken into account. To go further, we used another index, named CPPfthat allows to take into account the five
closer groups, and to check the pairs of genes remaining joint partners. The values of CPPfare higher than those
of the CPP, e.g., 20% for the Ward. Methods associated to high CPP values have also high CPPfvalues, while
methods with low CPP values have also a lower CPPf
values. These weak variations shows that often a part of the observations, not associated to the original cluster could be find in its vicinity. These results are entirely in agreement with our previous results [49]. It shows here that the novel imputation methods have not permit to get closer related genes with better improvement.
The analysis of associations could also take into account the non-associations. For this purpose, Cluster-ing Agreement Ratio (CAR, see Methods section) has been used which considers both associated and non-associated genes. CAR values are higher than the one of the CPP due to the calculation of the pairs of genes remaining dissociated. Indeed, it is more probable than the genes are dissociated than associated according to the number of treated genes and the number of gener-ated groups. For the OS dataset, the highest values of the index CAR concerns Ward classification and are ranging between 88.2 and 91.2%. For the GHeat dataset, it ranges between 91.0 and 94.1%. Complete linkage,
average linkage and McQuitty have lower CAR values (80%). For k-means classification, the values are higher 1 to 2% compared to Ward classification, 10% better than
McQuitty and Complete linkage and 13% to average
linkage. This results underlines that K-means allows so a better stability of gene clusters.
Discussion
Imputation
Since our previous analysis [49], numerous new MVs imputation methods have been proposed. Some appeared to be true improvements in regards to the computation of RMSE. In particular, EM_array is clearly the most efficient methods we tested. For τ < 35%, it is the best imputation method for 60% of the values, and for τ > 35%, in 80%. This feature was confirmed by the analysis of extreme values. LSI_array, LSI_combined and
LSI_adaptativefollow closely the efficiency of
EM_ar-ray. We have unsuccessfully tried to combine these four different methods to improve the RMSE values. No combination performs better than EM_array.
We can underline four interesting points:
i. As expected, the imputation quality is greatly affected by the rate of missing data, but surprisingly it is also related to the kind of data. BPCA is a perfect illustra-tion. For non-kinetic human dataset, MVs estima-tions were correct, whereas for the GHeat dataset the error rate appeared to be more important.
ii. The efficiency of Row_Mean (and Row_Average) is surprisingly good in regards to the simplicity of the methodology used (with the exception of GHeat dataset).
iii. Even if kNN is the most popular imputation method; it is one of the less efficient, compared to other meth-ods tested in this study. It is particularly striking when analyzing the extreme values. SkNN is an improvement of kNN method, but we observed that RMSE values of SkNN were not better than ones of
kNN. It could be due to the use of non-optimal num-ber of neighbours (k), as for kNN. It must be noticed we used koptdefined by [27], this choice has a direct impact on the imputation values.
Extreme values are the ones that are the most valuable for the experiments. The imputation of extreme value missing data shows that -except for EM_array- the effectiveness of all the methods is affected.
Our results are so in good accordance with the results of Brock and co-workers [55] who found that methods from Bo and co-workers [29], Kim and co-workers [57] and Oba and co-workers [30] are highly competitive. However, they consider “that no method is uniformly superior in all datasets” [29]. Our results are simpler to summarize as we observe -thanks to our distance cri-teria- a grading between the effectiveness of the meth-ods. LLSI of Kim and co-workers [57] has a correct behavior for all datasets while BPCA of Oba and co-workers [30] is strongly dependant of the dataset. At the opposite, the methods implemented by Bo and co-work-ers [29] remain the most efficient in all cases. Moreover, some implemented methods of Bo and co-workers [29] have not been tested by [55], but are the most efficient. All these results are reinforced by the analyses of extreme value imputations.
An important point must be not forgotten, we have, as the other authors, e.g., [24,55,56], used the entire data-set, i.e., no specific selection of interesting profile gene had been done. It could have importance in terms of quality of the imputation values and consequence on the clustering.
Clustering
A strong assumption of the microarray data analysis is that genes with similar expression profiles are likely to be co-regulated and thus involved in the same or similar biological processes. Different types of clustering and classification methods have been applied to microarray data, e. g., some classical as k-means clustering [20], self-organizing maps [21,22,59], hierarchical clustering [19,60], Self Organizing Tree Algorithm [61-63], and some dedicated approaches as DSF_Clust [64], re-sam-pling based tight clustering [65], cluster affinity search technique [66], multivariate Gaussian mixtures [67], model-based clustering algorithms [68,69], clustering of change patterns using Fourier coefficients [70], Nearest Neighbor Networks [71], Fuzzy clustering by local Approximation of membership [72] or Multi-Dimen-sional Scaling [73].
Given one particular dataset, different clustering algo-rithms are very likely to generate different clusters [74]. This is true when large-scale gene expression data from microarrays are analyzed [58,75,76]. Comparison of dif-ferent clusters even obtained with the same classification approach is still a difficult task [see Additional file 4 [69,77-79]]. Thus, to assess the relevance of missing value imputation methods, we observed the behaviours of different hierarchical clustering methods and k-means clustering using CPP, CPPf [49] and newly introduce
CARindex. Results follow exactly the observations done on RMSE values (see previous section). Only one method seems ambiguous: kNN. Indeed, its CPP and
CPPf are higher than expected. It is mainly due to the selection of the genes in the different datasets. We have decided at the beginning to not discard any genes, i. e., we have absolute no a priori. Thus very flat profiles have been conserved and empower kNN that prefers to predict values closer to zero than the other methods (see Figure 4 of [49]). It generates clusters with lot of zero, these clusters are so stable. For the majority of the methods, the order of effectiveness of the methods for the maintenance of stability within the groups between various classifications is identical. Combination of CPP,
CPPfand CAR index underlines the interest of k-means clustering in regards to hierarchical clustering methods. For comparable clusters, k-means gives better values.
Wang and co-workers does not found a strong differ-ence between the three imputation methods they used, i.e.,
kNN, BPCA and LLS, in the classification performance [24]. The only comparable extensive study has been done by Tuikkala and co-workers [56], they have focussed inter-estingly on the GO term class and use k-means. They have tested six different methods with less simulation per miss-ing value rates and less missmiss-ing value rates. But, the important point is they have not tested the methods found the most efficient by our approach. We also slightly dis-agree with their conclusion about the quality of BPCA [56]. It can be easily understand as only a very limited number of clusters has been tested (5 clusters); in our case, we have supervised the choice of cluster numbers (see Method section), leading to a higher number of clus-ters. This higher number is so more sensitive to the quality of clustering. It must be noticed we have used Euclidean distance and not Pearson correlation, it was mainly to (i) stay consistent with our previous research, and (ii) as we have not filtered the data, Pearson correlation could have aggregated very different profiles. As the time computation was very important, it was not possible to test the two possibilities.
Conclusions
The DNA microarrays generate high volume of data. However they have some technical skews. Microarrays
studies must take into account the important problem of missing values for the validity of biological results. Numerous methods exist to replace them, but no sys-tematic and drastic comparisons have been performed before our present work. In this study, we have done more than 6.000.000 independent simulations, to assess the quality of these imputation methods. Figure 6 sum-marizes the results of our assessment. The method
EM_array, LSI_array, LSI_combined and LSI_adaptative are the most performing methods. BPCA is very effec-tive when the rate of missing values is lower than 15%,
i.e., for classical experiments. The values estimated by the Row_Mean are quite correct in regards to the sim-plicity of the approach. kNN (and SkNN) does not give impressive results, it is an important conclusion for a method used by numerous scientists. The methods
LSI_-gene and EM_gene are not effective but they are to be tested with data files made up of little of genes and a great number of experiments. These conclusions are to be taken carefully because the quality of the imputations depends on the used datasets.
A major disadvantage of numerous methods is their accessibilities. We have tested here only a part of the methods as some are unavailable and others had not worked properly. Some methods used here could not be used easily by a non-specialist. It could be interesting so to have implementation of all the different methods in a useful manner with the standardized input and output file format. In the second time, graphic interfaces for the methods could be helpful. These remarks are parti-cularly relevant in regards to recent papers that pro-posed novel approaches as SLLSimpute [80] or interesting comparison [55,56] that do not compare with the methods that had been considered as the most efficient in this study.
Methods
Datasets
We used 5 data sets for the analysis [see Additional file 1]; they were mainly coming from the SMD database [81]. The first one, named Ogawa set, was initially com-posed of N = 6013 genes and n = 8 experimental condi-tions about the phosphate accumulation and the polyphosphate metabolism of the yeast Saccharomyces
cerevisiae[51]. The second one corresponds to various environmental stress responses in S. cerevisiae [52]. This set, named Gasch set, contains N = 6153 genes and n = 178 experimental conditions. Due to the diversity of conditions in this set, we focused on two experimental subsets corresponding to heat shock and H2O2 osmotic shock respectively. Bohen and co-workers have analyzed the patterns of gene expression in human follicular lym-phomas and the interest of treatment by rituximab [53]. This dataset is composed of N = 16.523 genes and n =
16 experimental conditions. The last dataset has been obtained by Lucau-Danila, Lelandais and co-workers [54]. To precisely describe the very early genomic response developed by yeast to accommodate a chemical stress, they performed a time course analyses of the yeast gene expression which follows the addition of the antimitotic drug benomyl. The dataset is a kinetic that comprised N = 5.621 genes for n = 6 kinetic time (30 seconds, 2, 4, 10, 20 and 40 minutes).
Datasets refinement: missing values enumeration
From the original datasets, we built complete datasets without MVs. All the genes containing at least one missing value were eliminated from the Ogawa set (noted OS). The resulting OS set contains N = 5783 genes and n = 8 experimental conditions. The second set without MVs was taken from Gasch et al. and called GS. The experimental conditions (column) con-taining more than 80 MVs were removed. The result-ing GS matrix contains N = 5843 genes and n = 42 experimental conditions. Two subsets were generated from GS and have been noted GHeat and GH2O2. They correspond to specific stress conditions as described previously. GHeat and GH2O2 contain respectively N = 3643 genes with n = 8 experimental conditions and N = 5007 genes with n = 10 experi-mental conditions.
To test the influence of the matrix size, i.e., the num-ber of genes, we built smaller sets corresponding to 1/7 of OS, GS, GHeat and GH2O2. Principles are described in [49]. For the dataset of Bohen et al. (noted B), we have done the same protocol and used a subset repre-senting 1/7 of B, i.e., N = 861 genes. For the dataset of Lucau-Danila et al.: [54], 11.4% of the genes have at least one missing values. The dataset with no missing values (noted L) was so composed of N = 4645 genes.
Missing values generation
From the sets without MVs, we introduced a rate τ of genes containing MVs (τ = 1 to 50.0%), these MVs are randomly drawn. Each random simulation is generated at least 100 times per experiment to ensure a correct sampling. It must be notices that contrary to our previous work, each gene could contain more than one MV [49].
Replacement methods
The different packages have been downloaded from the authors’ websites (see Table 1). kNN has been computed using the well-known KNNimpute developed by Troyanskaya and co-workers [27]. The determined kopt value is associated with a minimal global error rate as defined by Troyanskaya and co-workers [27]. BPCA was used without its graphical interface [30] as for the Bo et al. package (Java) [29]. For LLSI and Row_Average, we have modified the original Matlab code to use our own
microarray datasets [57]. SkNN was performed with R software [28].
Hierarchical Clustering
The hierarchical clustering (HC) algorithm allows the construction of a dendogram of nested clusters based on proximity information [19]. The HC have been per-formed using the “hclust” package in R software [82]. Seven hierarchical clustering algorithms have been tested: average linkage, complete linkage, median
link-age, McQuitty, centroid linkage, single linkage and Ward
minimum variance [83].
The distance matrix between all the vectors (i.e., genes) is calculated by using an external module written in C language. We used the normalized Euclidean dis-tance d* to take account of the MVs:
d n m vi wi i n *
(
v w,)
= −(
−)
=∑
1 2 1 (1)vand w are two distinct vectors and m is the number of MVs between the two vectors. Thus, (vi- wi) is not computed if viand/or wiis a missing value
An index for clustering results comparison: Conserved Pairs Proportion (CPP)
To assess the influence of missing data rates and differ-ent replacemdiffer-ent methods into clustering results (see Figure 1), we have analysed the co-associated genes of an original dataset (without MVs) compared to these genes location in a set with MVs. A similar approach has been used by Meunier et al. on proteomic data [84]. Hence, we realized in a first step the clustering with the data sets without MV by each aggregative clustering algorithm. The results obtained by these first analyses are denoted reference clustering (RC). In a second step, we generated MVs in data. The MVs are replaced by using the different replacement methods. Then we per-formed the hierarchical clustering for each new set. The results obtained by these second analyses are denoted generated clustering (GC).We compared the resulting clusters defined in RC and GC and assessed the diver-gence by using an index named Conserved Pair Propor-tions (CPP). The CPP is the maximal proportion of genes belonging to two clusters, one from the RC and the other one from the GC (cf. Figure 1 of [49] and Additional file 5 for more details).
Clustering Agreement Ratio (CAR)
The Clustering Agreement Ration (CAR) is the concor-dance index measuring the proportion of genes pairs, either belonging to a same cluster (resp. different clus-ters) in the reference clustering (RC) and found again in a same cluster (resp. different clusters) in the clustering (GC) obtained without or after replacing the MVs.
The index CAR is defined by the following equation: CAR ij ref ijnew ij ref ijnew j i i G algo ( ) ( ) ( = ⋅ + − ⋅ − ⎢ ⎣⎢ ⎥ ⎦⎥ < ∑ ∑ ⋅ 1 1 G G−1 2) / (2)
where ijref and ijnew specify the co-presence of two genes in a same cluster, i.e., they take the value 1 when the genes i and j belong to a same cluster in the cluster-ing RC and GC respectively. The numbers of pairs in G genes is G.(G - 1)/2. The first term of the numerator corresponds to the co-presence of the pair (i, j) in a same cluster for RC and GC, and, the second term the co-absence of this pair in a same cluster.
Additional file 1: Dataset details. Click here for file
[ http://www.biomedcentral.com/content/supplementary/1471-2164-11-15-S1.DOC ]
Additional file 2: RMSE of OS with BPCA imputing method. RMSE value for OS for rate of missing value going from 0.5% to 20% by step of 0.5% with the L dataset.
Click here for file
[ http://www.biomedcentral.com/content/supplementary/1471-2164-11-15-S2.DOC ]
Additional file 3: Extreme values. Distribution of the values observed in OS dataset. The extreme values are highlighted on each size of the histogram.
Click here for file
[ http://www.biomedcentral.com/content/supplementary/1471-2164-11-15-S3.DOC ]
Additional file 4: Comparing clustering algorithms. Click here for file
[ http://www.biomedcentral.com/content/supplementary/1471-2164-11-15-S4.DOC ]
Additional file 5: Details of CPP and CPPf. Click here for file
[ http://www.biomedcentral.com/content/supplementary/1471-2164-11-15-S5.DOC ]
Acknowledgements
We would like to thanks all the scientists who have deposited their experiments and make them freely available to the scientific community. In the same way, we would like to thanks all the scientists who have developed and distributed missing value replacement methods. This work was supported by grants from the Ministère de la Recherche, from French Institute for Health and Medical Research (INSERM), Université Paris Diderot -Paris 7, Institut National de Transfusion Sanguine (INTS) and Genopole®. Clustering Agreement Ration (CAR) was proposed by late Pr. Serge Hazout. Author details
1INSERM UMR-S 726, Equipe de Bioinformatique Génomique et Moléculaire
(EBGM), DSIMB, Université Paris Diderot - Paris 7, 2, place Jussieu, 75005, France.2
UMR 1083 Sciences pour l’Œnologie INRA, 2 place Viala, 34060 Montpellier cedex 1, France.3Atragene Informatics, 33-35, Rue Ledru-Rollin
94200 Ivry-sur-Seine, France.4INSERM UMR-S 665, DSIMB, Université Paris
Diderot - Paris 7, Institut National de Transfusion Sanguine (INTS), 6, rue Alexandre Cabanel, 75739 Paris cedex 15, France.
Authors’ contributions
MC done all the computational and analysis works. AdB wrote the paper, conceived of the study and carried out the MVs generation. AM and GL participated in the design of the study and coordination. All authors read and approved the final manuscript.
Competing interests
The authors declare that they have no competing interests. Received: 2 September 2009
Accepted: 7 January 2010 Published: 7 January 2010
References
1. Liolios K, Tavernarakis N, Hugenholtz P, Kyrpides NC: The Genomes On Line Database (GOLD) v.2: a monitor of genome projects worldwide. Nucleic Acids Res 2006, , 34 Database: D332-334.
2. Bernal A, Ear U, Kyrpides N: Genomes OnLine Database (GOLD): a monitor of genome projects world-wide. Nucleic Acids Res 2001, 29(1):126-127. 3. Muro S, Takemasa I, Oba S, Matoba R, Ueno N, Maruyama C, Yamashita R,
Sekimoto M, Yamamoto H, Nakamori S, et al: Identification of expressed genes linked to malignancy of human colorectal carcinoma by parametric clustering of quantitative expression data. Genome Biol 2003, 4(3):R21. 4. Perou CM, Sorlie T, Eisen MB, Rijn van de M, Jeffrey SS, Rees CA, Pollack JR,
Ross DT, Johnsen H, Akslen LA, et al: Molecular portraits of human breast tumours. Nature 2000, 406(6797):747-752.
5. Statnikov A, Aliferis CF, Tsamardinos I, Hardin D, Levy S: A comprehensive evaluation of multicategory classification methods for microarray gene expression cancer diagnosis. Bioinformatics 2005, 21(5):631-643. 6. Imai K, Kawai M, Tada M, Nagase T, Ohara O, Koga H: Temporal change in
mKIAA gene expression during the early stage of retinoic acid-induced neurite outgrowth. Gene 2005, 364:114-122.
7. Raab RM: Incorporating genome-scale tools for studying energy homeostasis. Nutr Metab (Lond) 2006, 3:40.
8. Fellenberg K, Busold CH, Witt O, Bauer A, Beckmann B, Hauser NC, Frohme M, Winter S, Dippon J, Hoheisel JD: Systematic interpretation of microarray data using experiment annotations. BMC Genomics 2006, 7:319. 9. Hoheisel JD: Microarray technology: beyond transcript profiling and
genotype analysis. Nat Rev Genet 2006, 7(3):200-210.
10. DeRisi JL, Iyer VR, Brown PO: Exploring the metabolic and genetic control of gene expression on a genomic scale. Science 1997, 278(5338):680-686. 11. Clarke JD, Zhu T: Microarray analysis of the transcriptome as a stepping
stone towards understanding biological systems: practical considerations and perspectives. Plant J 2006, 45(4):630-650.
12. Zhang W, Rekaya R, Bertrand K: A method for predicting disease subtypes in presence of misclassification among training samples using gene expression: application to human breast cancer. Bioinformatics 2006, 22(3):317-325.
13. Alizadeh AA, Eisen MB, Davis RE, Ma C, Lossos IS, Rosenwald A, Boldrick JC, Sabet H, Tran T, Yu X, et al: Distinct types of diffuse large B-cell lymphoma identified by gene expression profiling. Nature 2000, 403(6769):503-511.
14. Pham T, Wells C, Crane D: Analysis of microarray gene expression data. Current Bioinformatics 2006, 1(1):37-53.
15. Asyali MH, Colak D, Demirkaya O, Inan MS: Gene expression profile classification: A review. Current Bioinformatics 2006, 1(1):55-73.
16. Wei JS, Greer BT, Westermann F, Steinberg SM, Son CG, Chen QR, Whiteford CC, Bilke S, Krasnoselsky AL, Cenacchi N, et al: Prediction of clinical outcome using gene expression profiling and artificial neural networks for patients with neuroblastoma. Cancer Res 2004, 64(19):6883-6891. 17. Gruzdz A, Ihnatowicz A, Slezak D: Interactive gene clustering - a case
study of breast cancer microarray data. Inf Syst Front 2006, 8:21-27. 18. Schuchhardt J, Beule D, Malik A, Wolski E, Eickhoff H, Lehrach H, Herzel H:
Normalization strategies for cDNA microarrays. Nucleic Acids Res 2000, 28(10):E47.
19. Everitt B: Cluster Analysis. Heinemann Educ 1974.
20. Hartigan JA, Wong MA: k-means. Applied Statistics 1979, 28:100-115. 21. Kohonen T: Self-organized formation of topologically correct feature
maps. Biol Cybern 1982, 43:59-69.
22. Kohonen T: Self-Organizing Maps. Springer, 3 2001.
23. Mardia K, Kent J, Bibby J: Multivariate Analysis. Academic Press 1979. 24. Wang D, Lv Y, Guo Z, Li X, Li Y, Zhu J, Yang D, Xu J, Wang C, Rao S, et al:
Effects of replacing the unreliable cDNA microarray measurements on the disease classification based on gene expression profiles and functional modules. Bioinformatics 2006, 22(23):2883-2889.
25. Grużdź A, Ihnatowicz A, Ślęzak D: Gene Expression Clustering: Dealing with the Missing Values. Intelligent Information Processing and Web Mining 2005, 521.
26. Fix E, Hodges J: Discriminatory analysis, nonparametric discrimination: Consistency properties. Technical Report 4, USAF School of Aviation Medicine Randolph Field, Texas 1951.
27. Troyanskaya O, Cantor M, Sherlock G, Brown P, Hastie T, Tibshirani R, Botstein D, Altman RB: Missing value estimation methods for DNA microarrays. Bioinformatics 2001, 17(6):520-525.
28. Kim KY, Kim BJ, Yi GS: Reuse of imputed data in microarray analysis increases imputation efficiency. BMC Bioinformatics 2004, 5:160. 29. Bo TH, Dysvik B, Jonassen I: LSimpute: accurate estimation of missing
values in microarray data with least squares methods. Nucleic Acids Res 2004, 32(3):e34.
30. Oba S, Sato MA, Takemasa I, Monden M, Matsubara K, Ishii S: A Bayesian missing value estimation method for gene expression profile data. Bioinformatics 2003, 19(16):2088-2096.
31. Bar-Joseph Z, Gerber GK, Gifford DK, Jaakkola TS, Simon I: Continuous representations of time-series gene expression data. J Comput Biol 2003, 10(3-4):341-356.
32. Schliep A, Schonhuth A, Steinhoff C: Using hidden Markov models to analyze gene expression time course data. Bioinformatics 2003, 19(Suppl 1):i255-263.
33. Tuikkala J, Elo L, Nevalainen OS, Aittokallio T: Improving missing value estimation in microarray data with gene ontology. Bioinformatics 2006, 22(5):566-572.
34. Kim DW, Lee KY, Lee KH, Lee D: Towards clustering of incomplete microarray data without the use of imputation. Bioinformatics 2007, 23(1):107-113.
35. Hu J, Li H, Waterman MS, Zhou XJ: Integrative missing value estimation for microarray data. BMC Bioinformatics 2006, 7:449.
36. Jornsten R, Ouyang M, Wang HY: A meta-data based method for DNA microarray imputation. BMC Bioinformatics 2007, 8:109.
37. Gan X, Liew AW, Yan H: Microarray missing data imputation based on a set theoretic framework and biological knowledge. Nucleic Acids Res 2006, 34(5):1608-1619.
38. Hua D, Lai Y: An ensemble approach to microarray data-based gene prioritization after missing value imputation. Bioinformatics 2007, 23(6):747-754.
39. Wang X, Li A, Jiang Z, Feng H: Missing value estimation for DNA microarray gene expression data by Support Vector Regression imputation and orthogonal coding scheme. BMC Bioinformatics 2006, 7:32. 40. Feten G, Almoy T, Aastveit AH: Prediction of missing values in microarray
and use of mixed models to evaluate the predictors. Stat Appl Genet Mol Biol 2005, 4:Article10.
41. Nguyen DV, Wang N, Carroll RJ: Evaluation of Missing Value Estimation for Microarray Data. Journal of Data Science 2004, 2:347-370.
42. Ouyang M, Welsh WJ, Georgopoulos P: Gaussian mixture clustering and imputation of microarray data. Bioinformatics 2004, 20(6):917-923. 43. Jornsten R, Wang HY, Welsh WJ, Ouyang M: DNA microarray data imputation and significance analysis of differential expression. Bioinformatics 2005, 21(22):4155-4161.
44. Sehgal MS, Gondal I, Dooley LS: Collateral missing value imputation: a new robust missing value estimation algorithm for microarray data. Bioinformatics 2005, 21(10):2417-2423.
45. Scheel I, Aldrin M, Glad IK, Sorum R, Lyng H, Frigessi A: The influence of missing value imputation on detection of differentially expressed genes from microarray data. Bioinformatics 2005, 21(23):4272-4279.
46. Tsiporkova E, Boeva V: Two-pass imputation algorithm for missing value estimation in gene expression time series. J Bioinform Comput Biol 2007, 5(5):1005-1022.
47. Bras LP, Menezes JC: Dealing with gene expression missing data. Syst Biol (Stevenage) 2006, 153(3):105-119.
48. Bras LP, Menezes JC: Improving cluster-based missing value estimation of DNA microarray data. Biomol Eng 2007, 24(2):273-282.
49. de Brevern AG, Hazout S, Malpertuy A: Influence of microarrays experiments missing values on the stability of gene groups by hierarchical clustering. BMC Bioinformatics 2004, 5:114.
50. Wong DS, Wong FK, Wood GR: A multi-stage approach to clustering and imputation of gene expression profiles. Bioinformatics 2007, 23(8):998-1005.
51. Ogawa N, DeRisi J, Brown PO: New components of a system for phosphate accumulation and polyphosphate metabolism in
Saccharomyces cerevisiae revealed by genomic expression analysis. Mol Biol Cell 2000, 11(12):4309-4321.
52. Gasch AP, Spellman PT, Kao CM, Carmel-Harel O, Eisen MB, Storz G, Botstein D, Brown PO: Genomic expression programs in the response of yeast cells to environmental changes. Mol Biol Cell 2000, 11(12):4241-4257. 53. Bohen SP, Troyanskaya OG, Alter O, Warnke R, Botstein D, Brown PO, Levy
R: Variation in gene expression patterns in follicular lymphoma and the response to rituximab. Proc Natl Acad Sci USA 2003, 100(4):1926-1930. 54. Lucau-Danila A, Lelandais G, Kozovska Z, Tanty V, Delaveau T, Devaux F,
Jacq C: Early expression of yeast genes affected by chemical stress. Mol Cell Biol 2005, 25(5):1860-1868.
55. Brock GN, Shaffer JR, Blakesley RE, Lotz MJ, Tseng GC: Which missing value imputation method to use in expression profiles: a comparative study and two selection schemes. BMC Bioinformatics 2008, 9:12.
56. Tuikkala J, Elo LL, Nevalainen OS, Aittokallio T: Missing value imputation improves clustering and interpretation of gene expression microarray data. BMC Bioinformatics 2008, 9:202.
57. Kim H, Golub GH, Park H: Missing value estimation for DNA microarray gene expression data: local least squares imputation. Bioinformatics 2005, 21(2):187-198.
58. Cox B, Kislinger T, Emili A: Integrating gene and protein expression data: pattern analysis and profile mining. Methods 2005, 35(3):303-314. 59. Tamayo P, Slonim D, Mesirov J, Zhu Q, Kitareewan S, Dmitrovsky E, Lander
ES, Golub TR: Interpreting patterns of gene expression with self-organizing maps: methods and application to hematopoietic differentiation. Proc Natl Acad Sci USA 1999, 96(6):2907-2912.
60. Eisen MB, Spellman PT, Brown PO, Botstein D: Cluster analysis and display of genome-wide expression patterns. Proc Natl Acad Sci USA 1998, 95(25):14863-14868.
61. Herrero J, Valencia A, Dopazo J: A hierarchical unsupervised growing neural network for clustering gene expression patterns. Bioinformatics 2001, 17(2):126-136.
62. Dopazo J, Carazo JM: Phylogenetic reconstruction using an unsupervised growing neural network that adopts the topology of a phylogenetic tree. J Mol Evol 1997, 44(2):226-233.
63. Yin L, Huang CH, Ni J: Clustering of gene expression data: performance and similarity analysis. BMC Bioinformatics 2006, 7(Suppl 4):S19. 64. Fu X, Teng L, Li Y, Chen W, Mao Y, Shen IF, Xie Y: Finding dominant sets
in microarray data. Front Biosci 2005, 10:3068-3077.
65. Tseng GC, Wong WH: Tight clustering: a resampling-based approach for identifying stable and tight patterns in data. Biometrics 2005, 61(1):10-16. 66. Ben-Dor A, Shamir R, Yakhini Z: Clustering gene expression patterns. J
Comput Biol 1999, 6(3-4):281-297.
67. Qu Y, Xu S: Supervised cluster analysis for microarray data based on multivariate Gaussian mixture. Bioinformatics 2004, 20(12):1905-1913. 68. Yeung KY, Fraley C, Murua A, Raftery AE, Ruzzo WL: Model-based
clustering and data transformations for gene expression data. Bioinformatics 2001, 17(10):977-987.
69. Yeung KY, Haynor DR, Ruzzo WL: Validating clustering for gene expression data. Bioinformatics 2001, 17(4):309-318.
70. Kim J, Kim H: Clustering of Change Patterns Using Fourier Coefficients. Bioinformatics 2007.
71. Huttenhower C, Flamholz AI, Landis JN, Sahi S, Myers CL, Olszewski KL, Hibbs MA, Siemers NO, Troyanskaya OG, Coller HA: Nearest Neighbor Networks: clustering expression data based on gene neighborhoods. BMC Bioinformatics 2007, 8:250.
72. Fu L, Medico E: FLAME, a novel fuzzy clustering method for the analysis of DNA microarray data. BMC Bioinformatics 2007, 8:3.
73. Lelandais G, Vincens P, Badel-Chagnon A, Vialette S, Jacq C, Hazout S: Comparing gene expression networks in a multi-dimensional space to extract similarities and differences between organisms. Bioinformatics 2006, 22(11):1359-1366.
74. Datta S, Datta S: Evaluation of clustering algorithms for gene expression data. BMC Bioinformatics 2006, 7(Suppl 4):S17.
75. Allison DB, Cui X, Page GP, Sabripour M: Microarray data analysis: from disarray to consolidation and consensus. Nat Rev Genet 2006, 7(1):55-65. 76. Handl J, Knowles J, Kell DB: Computational cluster validation in
post-genomic data analysis. Bioinformatics 2005, 21(15):3201-3212. 77. Wu LF, Hughes TR, Davierwala AP, Robinson MD, Stoughton R, Altschuler
SJ: Large-scale prediction of Saccharomyces cerevisiae gene function using overlapping transcriptional clusters. Nat Genet 2002, 31(3):255-265. 78. Thalamuthu A, Mukhopadhyay I, Zheng X, Tseng GC: Evaluation and
comparison of gene clustering methods in microarray analysis. Bioinformatics 2006, 22(19):2405-2412.
79. Swift S, Tucker A, Vinciotti V, Martin N, Orengo C, Liu X, Kellam P: Consensus clustering and functional interpretation of gene-expression data. Genome Biol 2004, 5(11):R94.
80. Zhang X, Song X, Wang H, Zhang H: Sequential local least squares imputation estimating missing value of microarray data. Comput Biol Med 2008, 38:1112-1120.
81. Gollub J, Ball CA, Binkley G, Demeter J, Finkelstein DB, Hebert JM, Hernandez-Boussard T, Jin H, Kaloper M, Matese JC, et al: The Stanford Microarray Database: data access and quality assessment tools. Nucleic Acids Res 2003, 31(1):94-96.
82. Ihaka R, Gentleman R: R: a language for data analysis and graphics. J Comput Graph Stat 1996, 5:299-314.
83. Quackenbush J: Computational analysis of microarray data. Nat Rev Genet 2001, 2(6):418-427.
84. Meunier B, Dumas E, Piec I, Bechet D, Hebraud M, Hocquette JF: Assessment of hierarchical clustering methodologies for proteomic data mining. J Proteome Res 2007, 6(1):358-366.
doi:10.1186/1471-2164-11-15
Cite this article as: Celton et al.: Comparative analysis of missing value imputation methods to improve clustering and interpretation of microarray experiments. BMC Genomics 2010 11:15.
Submit your next manuscript to BioMed Central and take full advantage of:
• Convenient online submission
• Thorough peer review
• No space constraints or color figure charges
• Immediate publication on acceptance
• Inclusion in PubMed, CAS, Scopus and Google Scholar
• Research which is freely available for redistribution
Submit your manuscript at www.biomedcentral.com/submit

![Figure 5a shows the Cluster Pair Proportions (CPP, [49] see Methods section) of OS using hierarchical clus-tering with complete linkage, average linkage, McQuitty and Ward algorithm](https://thumb-eu.123doks.com/thumbv2/123doknet/14658658.553645/11.892.88.436.135.228/figure-cluster-proportions-methods-hierarchical-complete-mcquitty-algorithm.webp)