© 2020 Wiley-VCH GmbH
Supporting Information
for Advanced Materials Interfaces, DOI: 10.1002/admi.202001227
Carbon-Assisted Stable Silver Nanostructures
S. Narjes Abdollahi, Efraín Ochoa Martínez, Cédric Kilchoer,
Geoffroy Kremer, Thomas Jaouen, Philipp Aebi, Tim Hellmann,
Thomas Mayer, Yibei Gu, Ulrich B. Wiesner, Ullrich Steiner, Bodo D.
Wilts, and Ilja Gunkel*
Carbon–assisted stable silver nanostructures
Supporting Information
S. Narjes Abdollahi
1, Efra´ın Ochoa Mart´ınez
1, C ´edric Kilchoer
1, Geoffroy Kremer
2,
Thomas Jaouen
2, Philipp Aebi
2, Tim Hellmann
3, Thomas Mayer
3, Yibei Gu
4,5, Ulrich B.
Wiesner
4, Ullrich Steiner
1, Bodo D. Wilts
1and Ilja Gunkel
1*1Adolphe Merkle Institute, University of Fribourg, Chemin des Verdiers 4, CH-1700 Fribourg, Switzerland 2D ´epartement de Physique and Fribourg Center for Nanomaterials, Universit ´e de Fribourg, CH-1700 Fribourg,
Switzerland
3Department of Materials Science, Technical University of Darmstadt, Otto-Berndt-Straße 3, D-64287, Darmstadt,
Germany
4Department of Materials Science and Engineering, Cornell University, 330 Bard Hall, Ithaca, NY 14853-1501, USA 5Present address: TeraPore Technologies, Inc., 407 Cabot Road, South San Francisco, CA 94080, USA
*e-mail: [email protected]
Keywords: 3D plasmonic nanostructures, silver, long-term stability, argon plasma treatment, graphitic layer
References
1. J. S. Pan, A. T. S. Wee, C. H. A. Huan, H. S. Tan, K. L. Tan. Journal of Applied Physics 1996, 79, 6 2934. 2. W. M. Lau, L. J. Huang, I. Bello, Y. M. Yiu, S. Lee. Journal of Applied Physics 1994, 75, 7 3385. 3. H. Estrade-Szwarckopf. Carbon 2004, 42, 8 1713 .
30 35 40 45 50 C PS 296 292 288 284 280
Binding Energy (eV)
536 532 528
Binding Energy (eV)
Ag Gyroid - Ar Sputtered 538 536 534 532 530 528 296 292 288 284 280
In
te
ns
ity
Binding Energy (eV)
Ag Gyroid - Ar Plasma Ag Gyroid - Ar SputteredIn
te
ns
ity
Binding Energy (eV)
Ag Gyroid - Ar PlasmaAg Gyroid - Ar Sputtered
Binding Energy (eV)
Binding Energy (eV)
280 284 288 292 296 528 530 532 534 536 538
d
b
c
Ar sputtered Ag gyroid
sp2 satellite C–O C–O C=O C=O K–OH K 2p3/2 K 2p1/2 Ag–O C–CBinding Energy (eV)
364 368 372 376 380 Ag 3d 5/2 Ag 3d 3/2 PL PL
Ag
0Ag
0 Ag–O Ag–OIntensity
Intensity
Intensity
a
Intensity
e
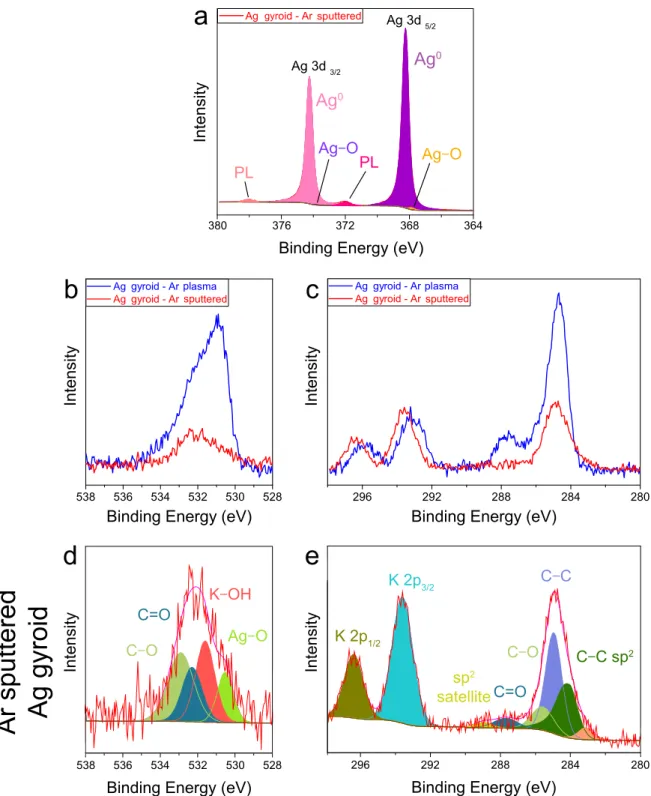
C–C sp2 gy sp gy pl sp gy gy pl gy spFig. 1 | XPS analysis of the effect of Ar sputtering on Ag gyroid surfaces. Ag 3d XPS spectrum of an Ar plasma-etched Ag
gyroid after additional Ar sputtering (a). The colored shading corresponds to fits assuming binding energies of the indicated
bonds (cf. Fig. 3). XPS spectra of the O 1s (b) and C 1s (c) regions of an Ar plasma-etched Ag gyroid (blue) and the same
sample after additional Ar sputtering (red). The peaks corresponding to organic contamination are substantially reduced after Ar sputtering. Fits (shaded region) of the XPS spectra of the O 1s (d) and C 1s (e) regions of an Ar plasma-etched Ag gyroid after
additional Ar sputtering (cf. Fig. 4). The additional peak at 283.12 eV is likely induced by Ar sputtering and associated with the formation of either carbides1or defects in the carbonaceous material2, 3.
Sample
Ag gyroid - Ar plasma Ag gyroid - Ar sputteredBE (eV) FWHM (eV)
Ag 3d 5/2 (Ag0)Area (cps)
Ag 3d C 1s O 1s K 2p Ag 3d 5/2 (Ag–O) Ag 3d 3/2 (Ag0) Ag 3d 3/2 (Ag–O) C–O C=O K–OH Ag–O C–O C=O C C–C sp2 K 2p3/2 K 2p1/2 C–C 368.21 0.51 374.22 0.51 367.81 0.44 373.83 0.37 158228.23 110229.51 4526.86 9532.17 285.57 1.54 293.09 1.58 284.66 1.02 287.68 1.59 530.55 0.80 532.02 1.35 295.99 1.58 531.10 0.99 533.22 1.89 2674.03 3143.18 2001.82 5952.22 2483.49 4625.43 3973.24 1570.72 2738.96 Ag 3d 5/2 (Ag0) Ag 3d C 1s O 1s K 2p Ag 3d 5/2 (Ag–O) Ag 3d 3/2 (Ag0) Ag 3d 3/2 (Ag–O) C–O C=O K–OH Ag–O C–O C=O K 2p3/2 K 2p1/2 C–C 368.23 0.51 374.24 0.50 367.85 0.44 373.83 0.37 226873.13 159631.33 523.70 2099.30 285.58 1.50 293.58 1.38 284.95 1.10 287.68 1.60 530.54 1.00 532.31 1.25 296.36 1.27 531.61 1.19 532.91 1.60 550.00 2717.40 251.60 1740.00 524.73 627.99 953.34 1265.00 1125.18 284.10 1.18 283.12 1.02 1290.00 192.10Fig. 2 | Summary of peak-fitting parameters in the XPS analysis of Ag gyroid samples. The binding energy (BE),
full-width-at-half-maximum (FWHM) and peak area values were determined from the fits of the spectra of an Ar plasma-etched Ag gyroid and the sample same after an additional Ar sputtering. The values for each bond are color-coded according to the associated fits shown in Fig. 3, Fig. 4 and Fig.1. The ratio of the metallic Ag0to Ag−O in oxidized silver Ag 3d5/2peak areas changed from 94.0:6.0 for the Ar plasma treated Ag gyroid to 99.0:1.0 for the same sample after additional Ar sputtering.
20 30 40 50 60 70 80 90
In
te
ns
ity
(C
ou
nt
s)
2θ (deg)
0 3 6 9 12 15In
te
ns
ity
(c
ps
/e
V)
Energy (KeV)
a
b
C Si Au Ag O Au Au Ag Ag AgAg Ag SnO2Fig. 3 | Elemental and crystallographic analysis of Ag gyroid samples. a, EDS spectrum of an Ag gyroid atop a Au-coated
Si wafer substrate, confirming that the gyroid sample contains Ag, C and O in addition to Au and Si originating from the substrate.b, XRD spectrum of a Ag gyroid on an FTO-coated glass substrate, revealing metallic Ag0(JCPDS card No. 04-0783)
with additional peaks stemming from the SnO2layer of the substrate (JCPDS card No. 77-0452).
a
b
Fig. 4 | SEM images of a silver gyroid network. a, Air-plasma etched and b, the same sample after 1-month storage under
ambient lab condition. The color change of the samples over time is obvious (the inset images). Scale bars: 1 µ m .