Separate density and viscosity measurements of unknown liquid using quartz
crystal microbalance
Feng Tan, , Du-Yu Qiu, Lian-Ping Guo, Peng Ye, Hao Zeng, Jun Jiang, Yong Tang, and Yi-Cheng Zhang
Citation: AIP Advances 6, 095313 (2016); doi: 10.1063/1.4963298 View online: http://dx.doi.org/10.1063/1.4963298
View Table of Contents: http://aip.scitation.org/toc/adv/6/9 Published by the American Institute of Physics
Separate density and viscosity measurements of unknown
liquid using quartz crystal microbalance
Feng Tan,1,aDu-Yu Qiu,1Lian-Ping Guo,1Peng Ye,1Hao Zeng,1Jun Jiang,1
Yong Tang,2and Yi-Cheng Zhang2
1School of Automation Engineering, University of Electronic Science and Technology of China, No.2006, Xiyuan Ave., West Hi-Tech Zone, 611731 Chengdu, Sichuan, P.R.China
2Department of Physics, University of Fribourg, Chemin du Mus´ee 3, CH-1700 Fribourg, Switzerland
(Received 19 June 2016; accepted 9 September 2016; published online 19 September 2016)
Aqueous liquids have a wide range of applications in many fields. Basic physical properties like the density and the viscosity have great impacts on the functional-ities of a given ionic liquid. For the millions kinds of existing liquids, only a few have been systematically measured with the density and the viscosity using tradi-tional methods. However, these methods are limited to measure the density and the viscosity of an ionic liquid simultaneously especially in processing micro sample volumes. To meet this challenge, we present a new theoretical model and a novel method to separate density and viscosity measurements with single quartz crystal microbalance (QCM) in this work. The agreement of experimental results and theo-cratical calculations shows that the QCM is capable to measure the density and the viscosity of ionic liquids. © 2016 Author(s). All article content, except where oth-erwise noted, is licensed under a Creative Commons Attribution (CC BY) license (http://creativecommons.org/licenses/by/4.0/). [http://dx.doi.org/10.1063/1.4963298]
The quartz crystal microbalance (QCM) is a piezoelectric quartz crystal disc sandwiched between two electrodes, and it works in the thickness-shear mode when a voltage is applied across the elec-trodes. QCM translates the mass change on its surface into frequency shift and this qualifies QCM as a mass-sensitive device.
When a rigid film coats on the surface of a QCM, there will be a linear relationship between frequency shift and mass change on its surface. The quantitative equation was first proposed by Sauerbrey in 19591as
∆f= −2nf02√ ρ∆m
qµq
, (1)
where f0 is the fundamental frequency of the quartz crystal, ρ0 is the quartz density, µq is the quartz shear elastic constant, ∆m is the mass change, and n is the number of overtones. However, the Sauerbery’s equation can only be used for thin films rigidly attached to QCM surface in gas phase.
In fact, QCM is also a powerful device in a variety of technological applications and a versatile tool in a number of research fields. It is widely used to detect a variety of nanoscale target analytes in liquid environment, due to the advantages such as its simple operation, real-time output, and label-free analysis.2–5The applications of QCM in liquids are attracting increasing attentions.6The mechanism is not fully understood but prime factors causing the frequency changes are the viscosity and density of the liquids.6,7
When QCM is in contact with a liquid, the relation in Eq.1breaks down and a more complex relation exists between contacting liquid and frequency shift, due to the coupling of the crystal motion vibration with the surrounding liquid. Kanazawa and Gordon calculated the frequency change when one side of a quartz resonator is in contact with a liquid8and revealed that the frequency response of the QCM depends on the product of the density and the viscosity of the liquid. However, in the
aElectronic mail:[email protected]
095313-2 Tan et al. AIP Advances 6, 095313 (2016)
Kanazawa theory, the density and the viscosity can not be measured separately and the mass effect of the liquid is omitted, these greatly limit the application of the Kanazawa theory in liquids.
Due to the viscous coupling of the liquid medium to the QCM surface, device mass sensitivity is preserved.9 It is also demonstrated that QCM driven in the thickness-shear-wave mode produces
longitudinal pressure waves.10Martin and Allen tried to measure the density and the viscosity of
a liquid separately by using two quartz resonators, a smooth-surface QCM and a textured-surface QCM.11Based on the Martin’s theory, Atsushi Itoh et al. combined the frequency shift of QCM with
admittance analysis (QCM-A) to measure the density and the viscosity of a liquid separately by using a textured-surface resonator.12Although these approaches mentioned above tried to discriminate the density and the viscosity measurements of a liquid but failed to separate changes in surface mass from changes in liquid properties when only the resonant frequency is monitored, and further concluded that it is impossible to separate liquid density and viscosity measurements with single QCM based on the frequency shift of QCM.11,12
In this work, we present a novel theoretical model and a new method to separate density and viscosity measurements of liquids only using a single smooth surface QCM based on the frequency response analysis.
When QCM sensor works in air or vacuum, it is only impacted by the stress. When there’s liquid on the surface of the sensor, the sensor will be impacted by both the stress and the liquid pressure. And the frequency shift of the QCM sensor will be a result of the combined effects of both the stress and pressure variations:
∆f= KPf∆Pf0+ KTf∆Tf0 (2)
where KPf is the pressure-frequency sensitivity coefficient, KTf is the stress-frequency sensitivity coefficient, ∆P is the pressure variation, ∆T is the stress variation, f0is the reference frequency. The
stress change caused by the liquid properties is:
∆T= CLf√ ρLηL, (3)
where CLf is a coefficient describing the frequency shift of the bulk acoustic wave resonator sensor induced by the liquid property, ρLis the liquid density, ηLis the liquid viscosity.
The pressure change induced by the added liquid on upper surface of QCM sensor can be given as:
∆P= ρLCPfVL, (4)
where CPf is the pressure frequency coefficient, VL is the liquid volume loaded onto the sensor surface.
Obviously, once a liquid sample is loaded on QCM, the stress variation of the QCM sensor induced by the liquid viscosity and density is determined and the frequency shift induced by the liquid property is also determined, KTf∆Tf0will be a constant. It’s the frequency variations resulted
from different volumes of liquid that can approach the density of it and then the viscosity. Theoretical expressions of the density ρLand the viscosity ηLare:
ρL= nD(∆f2− ∆f1) KPfCPf∆Vf02 (5) and ηL= KPfCPf (∆f2− ∆f1)f0∆V [∆f1∆V − VL1(∆f2− ∆f1) KTfCLf ] 2 (6) respectively, where n is the overtone number, D is the diameter of QCM electrodes, ∆V is the volume increment after the second liquid addition, ∆f1 is the frequency shift after the first liquid addition,
∆f2 is the frequency shift after the second liquid addition, f0 is the reference frequency, KPf is the pressure-frequency sensitivity coefficient and KPf=f0Kf/nD, Kfis pressure-frequency coefficient and
Kf = −23.3 × 10⁻¹⁵(msN−1), KTf= −2.75 × 10⁻¹¹(m2/N) is the stress-frequency sensitivity coef-ficient,13,14 CPf is the pressure-frequency coefficient in liquid phase, CLf is the liquid phase stress-frequency coefficient in liquid phase, VL 1is the first volume of liquid added to the QCM.
Fig. 1 shows the schematic of the experimental setup consisting of a micro-pipet (Model EpT.I.P.S®10µL, Eppendorf), a Universal Counter (Model 53132A, Agilent), and a QCM sensor
FIG. 1. Schematic of measuring liquid properties with QCM.
driving circuit. In this study, an AT-cut QCM with 3rdovertone at 10MHz and conventional thermally evaporated gold electrodes are used (Tongfang Guoxin Electronics Co., Ltd.). The diameter of the gold electrode is 5mm.
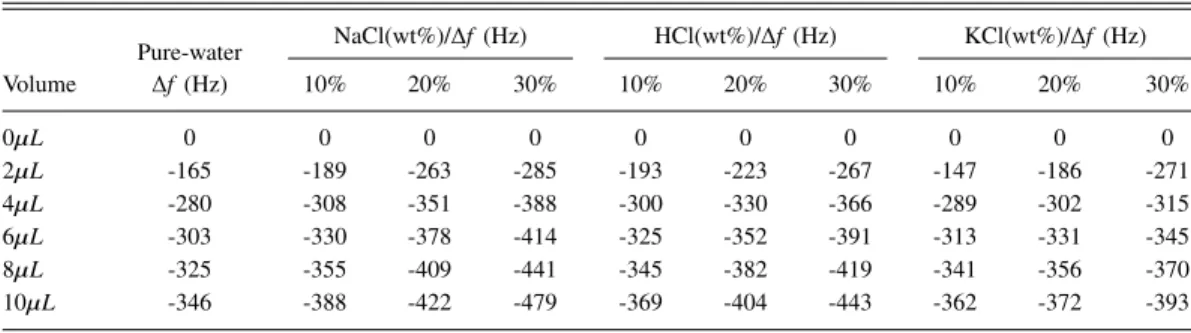
Pure water is chosen as the reference sample and aqueous solutions with NaCl concentrations of 10%, 20%, and 30% are prepared as target samples. NaCl is obtained from Sigma Aldrich and diluted with DI water. Measurements are performed at room of 25◦C and frequency shifts are recorded. TableI
shows the frequency shifts for NaCl solution with different concentrations, where V is the volume of the liquid added to the electrode.
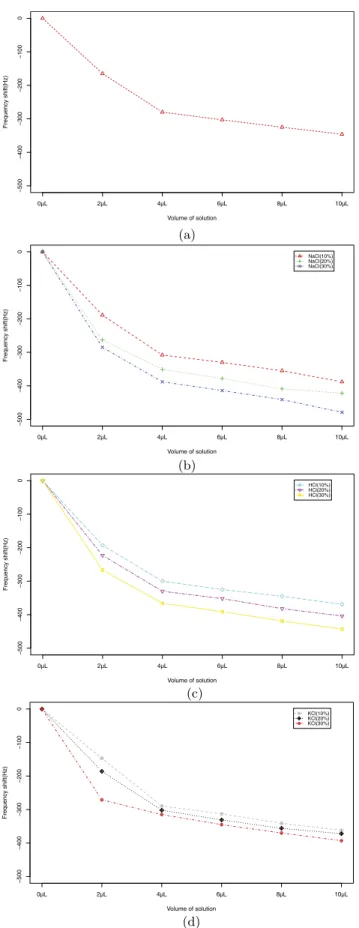
During the experiments, if the volume of the liquid is less than 4µL, the electrode of the QCM cannot be covered completely. If the electrode of the QCM is not covered completely, the frequency shift varies nonlinearly as the liquid volume changes. Only when the liquid covers the electrode completely, there exists a linear relationship between the frequency shift and the added liquids in some volume ranges. Fig.2shows the fitting plots of the frequency shifts of QCM for pure water, NaCl, HCl and KCl solutions with different volumes. It can be concluded that for a given liquid, it features determined attributes (density and viscosity), causing constant QCM frequency shift. When the QCM electrode is covered incompletely, the liquid attributes and the liquid mass effect work together to make the frequency vary nonlinearly. After the electrode is covered completely, only the liquid mass effect works, which makes a linear frequency variation.
In this work, take the pure water as a reference sample, and the parameters ρW= 1.0 × 10³kg/m3 and ηW= 8.949 × 10⁻⁴Pa · s, where ρWand ηWdenote the density and the viscosity of the pure water, respectively. We first determine coefficients of CPf= 7.3903×10⁴m/s2and CLf= −1.2877×10⁶m
3 √
s2.
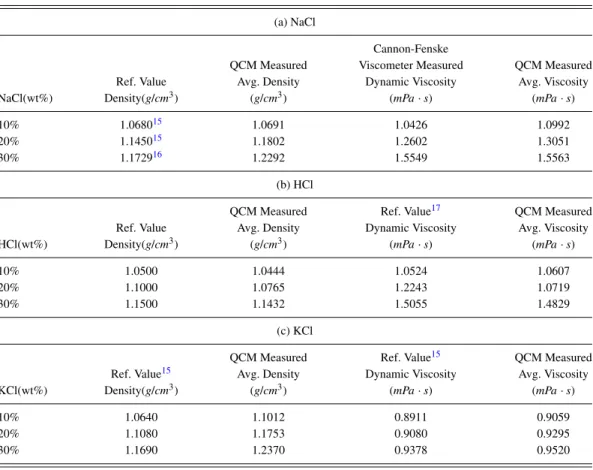
And then, let ∆f1be the frequency shift at V= 4µL, and ∆f2is frequency shift at V= 6µL, 8µL and
10µL, respectively. With Eq.5and Eq.6, the density and viscosity of the NaCl, HCl and KCl solutions with different concentrations are calculated and given in TableII. To test our analysis module, we use Cannon-Fenske viscometer(Aldrich) in a thermostated bath tested the viscosity of the three NaCl solution samples of different density respectively. For the other two liquids, we compared the results with the data in literatures.15–17Comparing our experiment results, we find there are errors between
our results by using QCM sensor and results in literatures and the results by using Cannon-Fenske
TABLE I. Frequency shifts in different volumes of liquid samples.
Pure-water NaCl(wt%)/∆f (Hz) HCl(wt%)/∆f (Hz) KCl(wt%)/∆f (Hz) Volume ∆f (Hz) 10% 20% 30% 10% 20% 30% 10% 20% 30% 0µL 0 0 0 0 0 0 0 0 0 0 2µL -165 -189 -263 -285 -193 -223 -267 -147 -186 -271 4µL -280 -308 -351 -388 -300 -330 -366 -289 -302 -315 6µL -303 -330 -378 -414 -325 -352 -391 -313 -331 -345 8µL -325 -355 -409 -441 -345 -382 -419 -341 -356 -370 10µL -346 -388 -422 -479 -369 -404 -443 -362 -372 -393
095313-4 Tan et al. AIP Advances 6, 095313 (2016)
TABLE II. Density and viscosity of NaCl, HCl and KCl solutions at 25◦C. (a) NaCl
Cannon-Fenske
QCM Measured Viscometer Measured QCM Measured
Ref. Value Avg. Density Dynamic Viscosity Avg. Viscosity
NaCl(wt%) Density(g/cm3) (g/cm3) (mPa · s) (mPa · s)
10% 1.068015 1.0691 1.0426 1.0992
20% 1.145015 1.1802 1.2602 1.3051
30% 1.172916 1.2292 1.5549 1.5563
(b) HCl
QCM Measured Ref. Value17 QCM Measured
Ref. Value Avg. Density Dynamic Viscosity Avg. Viscosity
HCl(wt%) Density(g/cm3) (g/cm3) (mPa · s) (mPa · s)
10% 1.0500 1.0444 1.0524 1.0607
20% 1.1000 1.0765 1.2243 1.0719
30% 1.1500 1.1432 1.5055 1.4829
(c) KCl
QCM Measured Ref. Value15 QCM Measured
Ref. Value15 Avg. Density Dynamic Viscosity Avg. Viscosity
KCl(wt%) Density(g/cm3) (g/cm3) (mPa · s) (mPa · s)
10% 1.0640 1.1012 0.8911 0.9059
20% 1.1080 1.1753 0.9080 0.9295
30% 1.1690 1.2370 0.9378 0.9520
Viscometer. The error depends on the following aspects: (1) The cleanness of the QCM sensor surface. The cleaner QCM surface is, the smaller the error is. Before each measurement, the sensor must be cleaned and dried completely. (2) The work state of the driving circuit of QCM sensor. If the work state of the driving circuit is unstable, the frequency of the QCM sensor will jump in experiment and the error will get bigger. So it’s important to maintain a stable work state of the driving circuit. (3) Environment. Putting the sensor and the driving circuit in a thermostatic chamber can lower the error. (4) The stability and accuracy of reference source of the frequency meter. A reference source with high stability and high accuracy to the frequency meter can help to lower the error. Testing accuracy is influenced by the parameters of QCM, accuracy of liquid concentration, environment temperature, and reference clock source in Counter, etc. Of course, the working state of the QCM driving circuit is a very important factor as well.
In conclusion, this paper presents a new model and a novel method to separate density and viscos-ity measurements of liquids based on the frequency response analysis of QCM, and the experimental results demonstrate its feasibility. The authors will focus on improving the accuracy in the future work.
This work was financially supported by the Fundamental Research Funds for the Central Univer-sities (NO.ZYGX2014J067, ZYGX2015J077) and the Innovation Program from Ministry of Science and Technology (NO. 2013IM020400), and the authors wish to thank Zi-Yang Jia for assistance.
1G. Sauerbrey,Zeitschrift f¨ur Physik155, 206 (1959).
2E. J. Cho, L. Yang, M. Levy, and A. D. Ellington,Journal of the American Chemical Society127, 2022 (2005). 3M. Hieda, R. Garcia, M. Dixon, T. Daniel, D. Allara, and M. H. W. Chan,Applied Physics Letters84, 628 (2004). 4P. Wang, J. Su, W. Dai, G. Cernigliaro, and H. Sun,Applied Physics Letters104, 043504 (2014).
5J. Lee, J. Jang, D. Akin, C. A. Savran, and R. Bashir,Applied Physics Letters93, 013901 (2008). 6C. Barnes,Sensors and Actuators A: Physical30, 197 (1992).
7D. M. Soares, W. Kautek, C. Frub¨ose, and K. Doblhofer,Berichte der Bunsengesellschaft f¨ur physikalische Chemie98, 219 (1994).
095313-6 Tan et al. AIP Advances 6, 095313 (2016) 9M. D. Ward, D. A. Buttry et al.,Science249, 1000 (1990).
10S. M. Reddy, J. P. Jones, and T. J. Lewis,Journal of Applied Physics83, 2524 (1998).
11S. J. Martin, K. Wessendorf, C. Gebert, G. Frye, R. Cernosek, L. Casaus, and M. Mitchell, “Measuring liquid properties with smooth-and textured-surface resonators,” Tech. Rep. (Sandia National Labs., Albuquerque, NM (United States), 1993). 12A. Itoh and M. Ichihashi,Measurement Science and Technology22, 015402 (2011).
13J. M. Ratajski, in 20th Annual Symposium on Frequency Control. 1966 (IEEE, 1966), pp. 33–49. 14E. EerNisse,Journal of Applied Physics43, 1330 (1972).
15F. A. Gonc¸alves and J. Kestin,Berichte der Bunsengesellschaft f¨ur physikalische Chemie81, 1156 (1977).
16A.-M. R. L. G. Andrei Ionut¸ Simion and C.-G. Grigoras¸, Journal of Agroalimentary Processes and Technologies 21, 41–52 (2015).