Institut d’Informatique
Multi-Level Energy Efficiency for Heterogeneous Data Centers
parMascha Kurpicz-Briki Th`ese
pr´esent´ee `a la Facult´e des Sciences
pour l’obtention du grade de Docteur `es Sciences
Accept´ee sur proposition du jury:
Prof. Pascal Felber, Directeur de th`ese Universit´e de Neuchˆatel, Suisse
Dr. Anita Sobe, Co-Directrice de th`ese Accenture Z¨urich, Suisse
Dr. Sonia Ben Mokhtar CNRS, France
Prof. R¨udiger Kapitza
Technische Universit¨at Braunschweig, Allemagne
Prof. Peter Kropf Universit´e de Neuchˆatel, Suisse
2000 Neuchâtel - Suisse Tél: + 41 (0)32 718 2100 E-mail: [email protected]
Imprimatur pour thèse de doctorat www.unine.ch/sciences
IMPRIMATUR POUR THESE DE DOCTORAT
La Faculté des sciences de l'Université de Neuchâtel
autorise l'impression de la présente thèse soutenue par
Madame Mascha KURPICZ-BRIKI
Titre:
“Multi-Level Energy Efficiency for
Heterogeneous Data Centers”
sur le rapport des membres du jury composé comme suit:
- Prof. Pascal Felber, directeur de thèse, Université de Neuchâtel, Suisse - Prof. Peter Kropf, Université de Neuchâtel, Suisse
- Dr Sonia Ben Mokhtar, Université Claude Bernard, LIRIS, Lyon, France - Prof. Rüdiger Kapitza, TU Braunschweig, Allemagne
- Dr Anita Sobe, Accenture, Zürich, Suisse
List of Tables vii
List of Figures viii
Acknowledgements xiii
Abstract xv
R´esum´e xvii
Zusammenfassung xix
List of Publications xxi
1 Introduction 1
1.1 Problem Statement . . . 1
1.2 Motivation . . . 4
1.3 Contribution . . . 5
2 Background and Related Work 9 2.1 Hardware . . . 9
2.2 Metrics . . . 10
2.2.1 Power vs. Energy . . . 10
2.2.2 Physical Power Meters . . . 11
2.2.3 Thermal Design Power . . . 12
2.3 Impact of Hardware Features on the Power Consumption . . . 12
2.3.1 Impact of DVFS and Turbo features . . . 14
2.3.2 Impact of HyperThreading . . . 14
2.4 Impact of Temperature . . . 15
2.5 The ParaDIME Project . . . 18
2.6 Related Work . . . 19
2.6.1 Power Models . . . 19
3 Using Power Measurements as a Basis for Workload Placement in
Hetero-geneous Multi-Cloud Environments 27
3.1 Introduction . . . 27 3.2 Experimental Setup . . . 29 3.2.1 Hardware . . . 29 3.2.2 Workloads . . . 30 3.2.3 Metrics . . . 31 3.3 Results . . . 31
3.3.1 CPU and Memory Power Consumption . . . 31
3.3.2 Disk Power Consumption . . . 39
3.3.3 Discussion . . . 40
3.4 Summary . . . 41
4 How much does a VM cost? Energy-Proportional Accounting in VM-based Environments 43 4.1 Introduction . . . 43
4.2 Energy Attribution with EPAVE . . . 46
4.2.1 Static Costs . . . 48
4.2.2 Dynamic Costs . . . 48
4.3 Use Cases . . . 49
4.4 Energy Mapping with PowerIndex . . . 54
4.4.1 Offline Profiling . . . 54 4.4.2 Online Monitoring . . . 56 4.4.3 Toy Example . . . 56 4.5 Discussion . . . 59 4.6 Outlook . . . 61 4.6.1 Pricing Models . . . 61
4.6.2 SLA with Renewable Energy Sources . . . 62
4.6.3 User-Oriented Utilization . . . 62
4.6.4 Open Questions . . . 62
4.7 Summary . . . 63
5 BitWatts: Process-Level Power Estimation in VM-based Systems 65 5.1 Introduction . . . 65
5.3.1 Architecture Overview . . . 70
5.3.2 Power Meter Middleware Toolkit . . . 70
5.3.3 Power Consumption Communication Channels . . . 73
5.4 Process-level Power Models . . . 74
5.4.1 Multi-core CPU Power Model . . . 74
5.4.2 Virtual CPU Power Model . . . 80
5.5 Evaluation of BitWatts . . . 81
5.5.1 Experimental Setup . . . 81
5.5.2 Scaling the Number of VMs . . . 83
5.5.3 Scaling the Number of Hosts . . . 84
5.6 Summary . . . 88
6 Impact of Mobile Applications on Battery Life: Power Characterization and Mitigation Measures 91 6.1 Introduction . . . 91
6.2 Characteristics of Mobile Workloads . . . 92
6.2.1 Power Traces . . . 92
6.2.2 Thesis . . . 93
6.3 Impact of Uneven Patterns . . . 94
6.3.1 Synthetic Workload . . . 94
6.3.2 Real-World Applications . . . 95
6.4 Using a Capacitor to Reduce Peaks . . . 96
6.5 Evaluation . . . 97
6.5.1 Setup . . . 97
6.5.2 Size of the Capacitor . . . 98
6.5.3 Passive System . . . 99
6.5.4 Energy Transfer System . . . 101
6.6 Discussion and Future Work . . . 104
6.7 Summary . . . 106
7 Conclusion and Future Work 107 7.1 Summary of Contributions . . . 107
7.2 Future Directions . . . 109
7.2.1 Comprehensive Power Estimation . . . 109
7.2.2 Towards a Completely Energy-Aware Data Center . . . 109
1.1 Hardware characteristics of machines m1 and m2. . . 4 2.1 Hardware characteristics of the selected systems. . . 10 3.1 Different workload placements and total energy costs in a fictive data center. 40 4.1 VM types. . . 49 4.2 Power Table for %usr and %sys utilization for machine m1 and machine
m2. . . 56 4.3 Utilization Mapping Table from reference machine m1 to machine m2 for
%usr and %sys. . . 57 4.4 Utilization trace for the simple workload w1 on machine m1. . . 57 4.5 Expected utilization trace for the simple workload w1 on machine m2. . . 58 5.1 Experiments performed using SPECjbb (BE: backend, VM: virtual
ma-chine, t: threads). . . 85
1.1 Cloud computing consumed more electricity than countries like India or Germany (from Greenpeace [1]) in 2007. . . 1 1.2 Main components of electricity consumption for the ICT sector, 2012 vs.
2017 (from [2]). . . 2 1.3 Power trace of the Bonnie++ workload on machines m1 and m2. . . 5 2.1 The power consumption of m3 is lower, but the execution time is longer,
and thus, we consume more energy for the calculation. . . 11 2.2 Median power consumption for load on an increasing number of cores. . . 13 2.3 Median power consumption for load on an increasing number of cores
(pinned). . . 14 2.4 Median power consumption during stress on 2 and 4 cores for different
CPU frequencies. . . 15 2.5 Median power consumption for load on an increasing number of cores. . . 16 2.6 Values reported by the physical powermeter for a load on 5 cores with
standard settings. . . 17 2.7 Evolution of the temperature during 30 seconds load on a different number
of cores. . . 17 2.8 The ParaDIME infrastructure. . . 18 3.1 Idle power consumption (only OS, no workload) of the different systems. 29 3.2 Median power consumption for CPU stress on all available cores. . . 32 3.3 Power values for the CPU stress on 1-4 cores on the Intel i3 machine. . . 33 3.4 Execution time and median power of a factorial computation on different
machines. . . 33 3.5 Throughput per Watt for the factorial computation (based on median
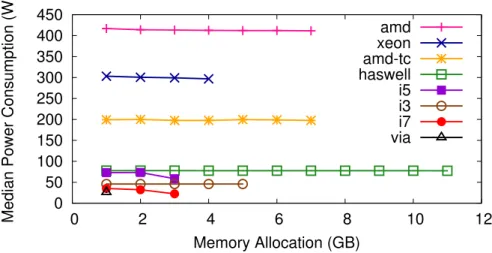
power consumption). . . 34 3.6 Median power consumption for memory stress from 1 GB to the number
of GB of RAM available minus one. . . 35 3.7 Power consumption of the SPECjbb workload on the i3 machine. . . 36
3.10 Performance per Watt for SPECjbb workload. . . 37
3.11 Bonnie++ workload for 1) sequential write by character, 2) sequential write by block, 3) modifying of blocks, 4) sequential read by character, 5) sequential read by block and 6) random seeks on the i3. . . 38
3.12 Disk on i3 put to standby and turning back to active state. . . 38
3.13 Write and read rate respectively divided by median power during execu-tion of Bonnie++ during phases of block writing and block reading. . . . 39
4.1 Example of maximum costs distribution among different types of VM. . . 47
4.2 Example of maximum cost distribution among different types of VM for a homogeneous cluster. . . 50
4.3 Example of maximum cost distribution among different types of VM for a heterogeneous cluster with unbalanced idle power for the server archi-tectures. . . 51
4.4 Power profile of the wordcount workload using all available cores. . . 52
4.5 Costs of two parallel workloads with a reservation of one core and twelve cores. . . 53
4.6 Costs of two workloads with underutilization of reserved cores. . . 53
4.7 Costs of two workloads with predetermined reservation time of 20 minutes per VM. . . 54
4.8 Energy estimation of the parsec workloads on the reference machine Sagit-taire. . . 59
4.9 Energy estimation of the parsec workloads on the Taurus machine. . . . 60
5.1 Example for BitWatts acting in a multi-tenant virtual environment. . . . 67
5.2 BitWatts middleware architecture. . . 70
5.3 BitWatts middleware implementation. . . 72
5.4 Core i3 and Xeon topologies. . . 75
5.5 Decreasing load of stress on i3 in the host, compared to RAPL. . . 76
5.6 Relative error distribution of the PARSEC benchmarks on the i3 processor. 77 5.7 Relative error distribution of the PARSEC benchmarks on the Xeon pro-cessor. . . 78
5.8 Process-level power consumption of BitWatts, x264, and freqmine on the Xeon processor. . . 79
5.9 Core i3 and Xeon VM topologies. . . 80
5.12 Power consumption of the host when scaling PARSEC on multiple VMs. 83 5.13 Power consumption during the execution of SPECjbb on the i3 with 2
threads. . . 85
5.14 Median power consumption for SPECjbb on i3 with different resources assigned to a single or multiple VMs on one host. . . 86
5.15 Median power consumption for SPECjbb on i3 for a distributed setup, virtualized and non-virtualized. . . 87
6.1 Power consumption (W) of the powerpoint workload. . . 94
6.2 Average power (with boxes), maximum power, and minimum power (W). 95 6.3 Average power and mean absolute deviation (W). . . 96
6.4 Power profile of a simple workload (5000 samples per second). . . 97
6.5 Average power and MAD of the simple workload and two benchmarks (geekbench and unity). . . 98
6.6 Energy gain for the average power trace of the simple workload, and two benchmarks (geekbench and unity), comparing an old and a new battery. The values are computed by dividing the extracted energy by the datasheet energy of the battery. . . 99
6.7 Extracted energy of the default power trace and an ideal power trace (average), comparing a new and an old battery. The values are computed by dividing the extracted energy by the datasheet energy of the battery. . 100
6.8 Architecture of the passive system. . . 100
6.9 Architecture of the energy transfer system. . . 101
6.10 Simplified power trace illustrating the concept of crossings. . . 101
6.11 Expected capacitor size vs. ideal gain. The expected size of the capacitor is represented by the average energy per crossing (J). The ideal gain is computed by the (extracted energy of the average trace - extracted energy of the original trace) / extracted energy of the original trace (%). . . 102
6.12 Energy gain for geekbench comparing the original trace to filtered traces with different time constants and the average power trace. . . 103
6.15 Different capacitors for the angrybirds workload. . . 103
6.13 Energy gain of the passive system compared to the MAD. . . 104
6.14 Different capacitors for the geekbench workload. . . 105
I want to thank my advisors, Prof. Pascal Felber and Dr. Anita Sobe, for their precious help over the last few years. I learnt a lot and gained many new skills thanks to you. Furthermore I want to thank Dr. Sonia Ben Mokhtar, Prof. R¨udiger Kapitza and Prof. Peter Kropf for being part of my jury.
I want to thank my colleagues from the IIUN for the technical and non-technical dis-cussions, the coffee breaks, the ice cream breaks with view on the lake, the aperos, the table tennis competitions, the BCN tours and the climbing adventures. I have spent an unforgettable time the last past years, thanks to you all.
Thanks to the HiPEAC framework and ARM Research in Cambridge (UK) I had the amazing chance to gain some industry insights and to collaborate with brilliant people.
I want to thank all my friends for supporting me and forgiving my last-minute dinner cancellations due to paper deadlines. The journey of my thesis would not have been the same without you!
Des Weiteren m¨ochte ich mich bei meiner Familie bedanken: ohne eure Unterst¨utzung und Ermutigung w¨are all das, was ich ¨uber die letzten Jahre erreicht habe, nicht m¨oglich gewesen.
Tout particuli`erement, j’aimerais remercier mon mari pour son soutien quotidien ind´efectible et sa joie de vivre qui me permet de r´eussir dans tout ce que je fais.
The ICT sector has an important impact on global energy consumption (building de-vices, building networks, operation, air-conditioning and more). Studies show that cloud computing as a whole consumes more energy than entire countries like Germany or In-dia. Furthermore, recent estimates have shown that the cloud computing sector, and thus the energy consumed by data centers, is still increasing.
The major goal of this thesis is to increase the energy awareness in heterogeneous data centers and thus contribute to the reduction of energy consumption in the ICT sector. To improve the energy awareness, we need to know how much energy is spent. This is influenced not only by the infrastructure, but by every single application running in the data center. Unfortunately we cannot measure application energy consumption with physical power meters. Therefore, this thesis contains real-world models to estimate the energy consumption at different levels.
This work is organized as a stack with 3 layers: (1) data center, (2) host/virtualiza-tion, (3) end user applications. At the data center layer, we first study the impact of different workloads running on heterogeneous machines. In a second step, we de-velop EPAVE, a model for energy-proportional accounting in VM-based environments. EPAVE is supported by PowerIndex, a profiling and energy estimation framework. At the host/virtualization layer, we present BitWatts, a middleware toolkit for building software-defined power meters. With BitWatts we cross the boundaries of virtual envi-ronments and provide an estimation of the power consumption of applications running within virtual machines.
At the bottom of the stack we look into battery modelling to extend the battery life of mobile devices.
Keywords: virtualized systems, energy estimation, power estimation, energy awareness, heterogeneous environments, accounting, battery modelling
Le secteur des TIC (Technologies de l’Information et de la Communication) est grand consommateur d’´energie (assemblage d’appareils, constructions de r´eseaux, op´erations, refroidissement et autres). Des ´etudes montrent que l’ensemble des activit´es de l’informatique en nuage consomme plus d’´energie que des pays entiers comme l’Allemagne ou l’Inde. De plus, des estimations r´ecentes montrent que le secteur de l’informatique en nuage, et donc l’´energie consomm´ee par les centres de donn´ees sur lesquels elle repose, est encore en croissance.
Dans cette th`ese, je d´eveloppe des approches pour faciliter la consommation ´energ´etique responsable des centres de donn´ees h´et´erog´enes et par cons´equent r´eduire la consomma-tion d’´energie globale du secteur des TIC. Pour faciliter la consommation ´energ´etique responsable, il faut savoir combien d’´energie est consomm´ee. Ceci est influenc´e par l’infrastructure, mais aussi par chaque application qui tourne dans le centre de donn´ees. Malheureusement, on ne peut pas appliquer un wattm`etre `a une application. Pour contourner cette limitation, cette th`ese propose des mod`eles r´ealistes pour estimer la consommation ´energ´etique `a plusieurs niveaux.
Cette th`ese est organis´ee comme une pile `a 3 niveaux: (1) centre de donn´ees, (2) vir-tualisation, (3) applications clientes. Au premier niveau des centres de donn´ees nous commen¸cons par une premi`ere phase d’´etude de l’influence de l’h´et´erog´en´eit´e mat´erielle sur la consommation de puissance des applications. Dans une deuxi`eme phase, nous d´eveloppons EPAVE, un mod`ele pour la facturation proportionnelle `a l’´energie dans les environnements virtualis´es. EPAVE est support´e par PowerIndex, un framework pour le profilage et l’estimation d’´energie. Au deuxi`eme niveau de la virtualisation nous pr´esentons BitWatts, un outil middleware pour construire des wattm`etres logiciels. Avec BitWatts, on franchit la barri`ere des environnements virtualis´es pour proposer une estimation de consommation pour des applications s’ex´ecutant au sein de machines virtuelles. Enfin, au troisi`eme niveau, nous mod´elisons les batteries d’appareils mobiles et proposons une approche pour prolonger leur dur´ee de vie.
Mots clefs: syst`emes virtualis´es, estimation d’´energie, estimation de puissance, consom-mation ´energ´etique responsable, environnements h´et´erog`enes, mod´elisation de batterie
Der ICT Sektor hat einen erheblichen Einfluss auf den globalen Energieverbrauch (Her-stellung von Ger¨aten, Netzwerke, Betrieb, K¨uhlung und so weiter). Studien zeigen, dass die Cloud insgesamt mehr Energie verbraucht als ganze L¨ander wie Deutschland oder Indien. Des Weiteren belegen k¨urzlich erstellte Sch¨atzungen, dass der Cloud Sektor weiter w¨achst, und somit der Energieverbrauch weiter steigen wird.
Das Ziel dieser Dissertation ist es, das Energiebewusstsein in Datenzentren zu erh¨ohen und somit zur Senkung des Energieverbrauchs im ICT Sektor beizutragen. Das Bewusst-sein zu mehr Energieeffizienz wird gesteigert, wenn man weiss, wie viel tats¨achlich an Energie verbraucht wird. Einfluss darauf haben nicht nur die Infrastruktur alleine, son-dern auch jede einzelne Applikation, die im Datenzentrum ausgef¨uhrt wird. Leider kann man an eine Applikation kein Wattmeter anschliessen. Deshalb befasst sich diese Dis-sertation mit realit¨atsnahmen Modellen um den Energieverbrauch auf mehreren Ebenen abzusch¨atzen.
Diese Dissertation ist als Stack mit 3 Ebenen aufgebaut: (1) Datenzentrum, (2) Host/Vir-tualisierung, (3) Anwenderapplikationen. Auf der Ebene der Datenzentren analysieren wir zuerst den Einfluss von heterogenen Maschinen auf den Stromverbrauch von Ap-plikationen. In einer zweiten Phase entwickeln wir EPAVE, ein Model f¨ur energie-proportionales Verrechnen in virtualisierten Umgebungen. EPAVE wird von PowerIndex unterst¨utzt, einem Framework f¨ur Profiling und Energiesch¨atzung. Auf der Ebene der Virtualisierung stellen wir BitWatts vor, ein Middleware Toolkit um software-basierte Strommessger¨ate zu bauen. Mit BitWatts ¨uberschreiten wir die Grenze zu virtuellen Umgebungen und sch¨atzen den Stromverbrauch von Applikationen, die in virtuellen Maschinen laufen. Auf der untersten Ebene des Stacks widmen wir uns Batteriemodel-lierung, mit dem Ziel, das Batterieleben von mobilen Ger¨aten zu verl¨angern.
Stichw¨orter: virtualisierte Systeme, Energiesch¨atzung, Stromverbrauchsch¨atzung, En-ergiebewusstsein, heterogene Umgebungen, Verrechnungssysteme, Batteriemodellierung
Kurpicz-Briki, M., S. Diestelhorst, And P. Felber.
Impact of Mobile Applications on Battery Life: Power Characterization and Mitigation Measures.
Technical report, outcome of a HiPEAC internship grant with ARM Research in Cam-bridge, UK.
Kurpicz, M., A-C. Orgerie, A. Sobe, and P. Felber.
Energy-proportional Profiling and Accounting in Heterogeneous Virtualized Environments.
Has been submitted to the Elsevier Special Issue Energy-Sim for Sustainable Computing Journal.
Kurpicz, M., A-C. Orgerie, and A. Sobe.
How much does a VM cost? Energy-proportional Accounting in VM-based Environments.
24th International Conference on Parallel, Distributed and Network-Based Processing (PDP 2016), 02/2016.
Palomar, O., S. Rethinagiri, G. Yalcin, R. Titos-Gil, P. Prieto, E. Torrella, O. Unsal, A. Cristal, P. Felber, A. Sobe, Y. Hayduk, M. Kurpicz et al.
Energy Minimization at All Layers of the Data Center: The ParaDIME Project.
2016 Design, Automation & Test in Europe Conference & Exhibition (DATE), IEEE, 2016.
Colmant, M., M. Kurpicz, P. Felber, L. Huertas, R. Rouvoy, and A. Sobe. Process-level Power Estimation in VM-based Systems.
EuroSYS, Bordeaux, France, ACM, 04/2015.
Colmant, M., M. Kurpicz, P. Felber, L. Huertas, R. Rouvoy, and A. Sobe. BitWatts: A Process-level Power Monitoring Middleware.
Middleware 2014 Poster/Demos, Bordeaux, France, ACM, 12/2014.
neous Multi-Cloud Environments.
CrossCloudBrokers ’14 (co-located to Middleware 2014), Bordeaux, France, ACM, 12/2014. Kurpicz, M., M. Colmant, L. Huertas, A. Sobe, P. Felber et R. Rouvoy.
Est-ce que ton application dans le nuage est ´econome en ´energie? Estimation de la puissance par processus dans des syst`emes virtualis´es.
ComPAS’2014 poster session, Neuchˆatel, Switzerland, 04/2014.
1.1 Problem Statement
With the paradigm shift towards cloud computing, more and more data centers appear all around the world. Even though newer generations of hardware are getting more energy-efficient, today’s cloud computing requires more electricity in the form of energy than entire countries such as India or Germany [1]. Figure 1.1 shows the electricity consumption of different countries and cloud computing in the year 2007 as reported by Greenpeace [1]. 0 500 1000 1500 2000 2500 3000 3500 4000 USA
China Russia Japan
Cloud Computing India Germany Canada France Brazil UK Electricity (Billion kwH)
Figure 1.1: Cloud computing consumed more electricity than countries like India or Germany (from Greenpeace [1]) in 2007.
Even though these numbers are from the year 2007, we know that the cloud comput-ing sector, and thus the energy consumed by cloud computcomput-ing, is still increascomput-ing [2]. Recent estimates show that the electricity consumption of data centers will increase from 15% of the total electricity consumption of the ICT sector (as of 2012) to 21%
by 2017. Figure 1.2 shows the increase of the electricity consumption of data centers and depicts that the electricity consumption for personal devices will decrease.
Figure 1.2: Main components of electricity consumption for the ICT sector, 2012 vs. 2017 (from [2]).
A more recent Greenpeace report [3] states that in 2015, 8% of the global electricity consumption is caused by the ICT sector, which is more than 2000 Terawatt-hours per year.
In many state-of-the-art works, the authors assume that data centers comprise servers with the same hardware of the same type. However, this is not realistic, as we often find different generations of the same hardware or even different types of hardware in real-world data centers [4]. The heterogeneity of data centers has an impact on the energy efficiency and we must consider this diversity when studying or estimating energy consumption.
The major goal of this thesis is to increase the energy awareness in heterogeneous data centers and thus contribute to the reduction of energy consumption in the ICT sector. To reduce the overall energy consumption in data centers, we need to have knowledge of the energy consumption of different components. Knowing the energy consump-tion of hardware with physical power meters is not enough. Abstract concepts like virtualization and distributed systems create more complexity. Furthermore, it is often not realistic (in terms of effort and costs) to instrument entire data centers with physical power meters to measure the energy directly at the hardware. We therefore need ways to estimate the energy consumption.
In this thesis I provide energy estimation at different abstraction layers. Each layer of the stack contributes to the overall energy consumed by a system. To get an understanding of the energy consumption of the entire system, we need to estimate the energy for each layer.
• Data center
• Host/virtualization • End user applications
Data centers are the top layer of the stack. To achieve energy awareness in het-erogeneous data centers, we need a prediction on how much energy a workload will consume on heterogeneous machines. This knowledge can then be applied to different tasks as energy-efficient scheduling or energy-proportional pricing models. Therefore, I want to answer the following research questions for data centers:
Is there a relevant change in the power footprint of an application when it runs on heterogeneous hardware, and how can we take advantage of this for workload placement?
How can we provide transparent, reproducible and predictive cost calculation in het-erogeneous data centers based on the energy consumption?
Host and virtualization are placed at the second layer of the stack. When it comes to energy consumption, settings made by the operating system are critical. For example, the Linux operating system can control the CPU frequency of the machine using governors.1 To achieve overall energy awareness, we need to have fine-grained knowledge of the energy consumption at a process-level. A particular challenge are virtualized operating systems, which add an additional layer of abstraction.
In this thesis I want to answer the following research question at the host and virtu-alization layer:
Which processes, on the host and in virtual machines, are consuming the most power? At the bottom of the stack we consider end user applications. Batteries are being used nowadays to power a wealth of different devices, ranging from tiny sensors to smartphones and even electrical cars. Saving energy and thus improving the battery life is a crucial concern. At the same time, modern CPUs and associated co-processors are becoming more and more powerful and energy demanding. They include multi-ple cores with various consumption characteristics, and the drained power is highly dependent on the configuration used at a given point in time. Battery lifetime can
Hardware Model Cores/Threads RAM (GB) TDP (W) m1: Intel Xeon 2x X5365 (3.0GHz) 2x 4/4 5 2x 150
m2: AMD 4x Opteron 8354 (2.2GHz) 4x 4/4 8 4x 115
Table 1.1: Hardware characteristics of machines m1 and m2.
suffer variations depending on these characteristics. The research question for this layer of the stack is as follows:
How can we take advantage of dynamic power consumption characteristics to extend the battery life of mobile devices?
In this thesis I raise the energy awareness problem and provide approaches for fine-grained energy estimation at different levels of abstraction.
1.2 Motivation
The domain of power and energy estimation is a very challenging area of research. Apart from the multiple layers discussed in the previous section, many factors impact the actual power consumption of a workload execution.
Let’s consider a very simple example where we execute a benchmark (Bonnie++2) on two different machines m1 and m2. Bonnie++ is a disk benchmark with different phases, including sequential output, sequential input and random seeks. In the phase of sequential output it writes single characters and entire blocks, and it modifies blocks. For the sequential input it reads character by character and entire blocks. In the end it comprises a phase of random seeks where the benchmark measures the physical movements of the head of the hard disk. We execute the benchmark on two different machines with hardware as shown in Table 1.1. Figure 1.3 shows the power consumption of the two machines during the benchmark execution, measured with a physical power meter.
We notice that the range of power values is already different between the two ma-chines. This is due to the different idle power. As idle power we consider the power that a machine consumes for being switched on, without running any workload. The power traces show clearly the separate phases of the benchmark. However, we see that there is a notable difference between the power behavior on machine m1 and
150 200 250 300 350 400 450 0 100 200 300 400 500 600 700 800 900 Power Consumption (W) Time (s) m2 m1
Figure 1.3: Power trace of the Bonnie++ workload on machines m1 and m2.
m2. Also, the execution time for the same workload differs slightly between the two machines.
We note that even in this simple setup where we execute the very same workload on two machines, it has a different power footprint on each system. Depending on the age of the machine, the hardware configuration and, particularly in this case, the state of the hard disk (fragmentation, file system, etc.), the power consumption is different. These are all factors that we need to consider whenever we want to make power-efficient decisions, estimate the power consumption or simply compare the power consumption of two systems. Additional factors such as hardware features and temperature are presented in more detail in the next chapter.
1.3 Contribution
As presented previously, the contributions of this thesis are presented as a stack. For data centers I studied the impact of heterogeneity on several workloads. Based on this we developed energy-proportional price models in EPAVE [5] and extended it with PowerIndex [6], an energy estimation framework.
At the second layer of the stack, I address the operating system layer with Bit-Watts [7], a toolkit for process-level power estimation on physical machines and in
virtualized environments. BitWatts allows the operating system to understand which processes are the hotspots of power consumption.
For end user applications, and in collaboration with ARM Research in Cambridge (UK),3 I tried to extend the battery life of recent smartphones.
The contributions of this thesis address the research questions as follows:
Is there a relevant change in the power footprint of an application when it runs on heterogeneous hardware, and how can we take advantage of this for workload placement? In the first contribution of this thesis, we study the per-formance and energy efficiency of a set of heterogeneous architectures for multiple micro-benchmarks (stressing CPU, memory and disk) and for a real-world cloud application. We observe from our results that some architectures are more energy-efficient for disk-intensive workloads, whereas others are better for CPU-intensive workloads. This study provides the basis for workload characterization and cross-cloud scheduling under constraints of energy efficiency. This work was presented as a paper Using Power Measurements as a Basis for Workload Placement in Hetero-geneous Multi-Cloud Environments at the CrossCloudBrokers Workshop 2014 at the ACM/IFIP/USENIX Middleware Conference in Bordeaux, France.
How can we provide transparent, reproducible and predictive cost calculation in heterogeneous data centers based on the energy consumption? As a second contribution we introduce EPAVE, a model for Energy-Proportional Accounting in VM-based Environments. EPAVE allows transparent, reproducible and predictive cost calculation for users and for cloud providers. It comes with PowerIndex, a profiling and estimation model, which is able to profile the energy costs of a VM on a given server architecture and can then estimate its energy costs on a different one. Preliminary results of this work were published in the 24th International Conference on Parallel, Distributed and Network-Based Processing (PDP 2016). An extended version with the title Energy-proportional Profiling and Accounting in Heterogeneous Virtualized Environments has been submitted to a special issue Energy-Sim for Sus-tainable Computing published by Elsevier.
Which processes, on the host and in virtual machines, are consuming the most power? The third contribution presented in this thesis is BitWatts. BitWatts is a middleware toolkit for building software-defined power meters. Such software me-ters provide an accurate alternative to dedicated hardware systems or embedded
power counters by estimating power consumption in the small, i.e., at the level of software processes. With BitWatts we cross the boundaries of virtual environments and provide an estimation of the power consumption of applications running within virtual machines (VMs). Preliminary results were presented at the Conf´erence en Parall´elisme, Architecture et Syst`eme (ComPAS) 2014 in Neuchˆatel, Switzerland and at the ACM/IFIP/USENIX Middleware Conference 2014 in Bordeaux, France at the poster sessions. The paper Process-Level Power Estimation in VM-based Systems was then published and presented in 2015 at EuroSYS in Bordeaux, France.
How can we take advantage of dynamic power consumption characteristics to extend the battery life of mobile devices? In this work, we study the impact of dynamic characteristics on battery life by collecting and analyzing real power traces. We particularly focus on uneven patterns that can adversely affect the battery life, and we propose a potential solution to mitigate their effect. This contribution is a result of a HiPEAC internship grant with ARM Research in Cambridge, where I stayed 4 months as a PhD intern.
As mentioned before, many factors influence the power consumption. In this chapter we will look into how the different factors impact the power consumption. In partic-ular, we will consider hardware features such as HyperThreading, DVFS and turbo features. Whenever a machine executes heavy calculations, the temperature of the CPU may rise. Therefore, this chapter also covers background information about temperature.
Furthermore, we present the hardware, define metrics and discuss the related work. The work presented in this thesis has been performed in collaboration with the ParaDIME project [8]. Background information about the project is given in this chapter as well.
2.1 Hardware
Table 2.1 gives an overview of the architecture characteristics of a variety of systems that comprise either AMD CPUs or Intel CPUs. In the evaluation of the chapters of this thesis, different subsets of the listed machines were used. Even though they are typically not used in data centers, we also consider mobile CPUs (i7 and VIA) as they are currently among the most energy-efficient architectures, typically running on battery power.
The selected systems include multicore CPUs or multiprocessors with frequencies between 1.6GHz and 3.4GHz. The Xeon (from 2007) has two processors with an overall of TDP of 300 W. The AMD (from 2008) with four processors and a total TDP of 460 W can also be power hungry. While the AMD, the AMD-TC and the Xeon have a high number of cores (8 to 16 cores), some of the Intel machines (i3, i5, i7, Haswell) have a lower core number but support HyperThreading.
The selected machines do not only differ by their CPU, but also by their hard disks. Most of the hard disks rotate 7200 times per minute (RPM), only the i5 and the mobile devices (i7 and VIA) have 5900 RPM and 5400 RPM respectively. The cache
Nr. Hardware Model Cores/ Threads RAM (GB) TDP (W) HDD Size RPM Cache 1 Intel i3 i3-2100 (3.1GHz) 2/4 6 65 WDC 250GB 7200 16MB 2 Intel i5 i5-650 (3.2GHz) 2/4 4 73 WDC 1TB 5900 64MB 3 Intel i7 i7-2620M (2.7GHz) 2/4 4 35 WDC 750GB 5400 8MB 4 Intel Xeon 2x X5365 (3.0GHz) 2x 4/4 5 2x 150 Seagate 250GB 7200 8MB 5 Intel Haswell i7-4770 (3.4GHz) 4/8 12 84 Seagate 2TB 7200 64MB 6 AMD 4x Opteron 8354 (2.2GHz) 4x 4/4 8 4x 115 Hitachi 500GB 7200 16MB 7 AMD-TC FX-8120 (3.1GHz) 8/8 8 125 Seagate 1TB 7200 32MB 8 VIA C7-M ULV (1.6GHz) 1/1 2 8 TOSHIBA 120GB 5400 8MB 9 Intel Xeon e5-2630 (2.3GHz) 2x 6/12 32 2x 95 - - - -10 AMD Opteron 250 (2.4GHz) 2/2 2 215 - - - -11 Intel Xeon W3520 (2.66GHz) 4/8 - 130 - - -
-Table 2.1: Hardware characteristics of the selected systems.
size generally depends on the size of the hard disk, i.e, larger disks comprise a larger cache.
2.2 Metrics
2.2.1 Power vs. Energy
The power is an instantaneous metric and is measured in Watt. The energy is defined as the power over a certain period of time. For example, if the power consumption is constant, we can compute the energy E as the median power P multiplied by the execution time T in seconds:
E = P ∗ T
If we want to compare the execution of two workloads on two different machines, we must consider the energy and not the power. It would not be fair to compare the power consumption, since the execution time can be different.
To illustrate this, consider the following example. We run a factorial computation on two different machines: m3 and m4. Figure 2.1 depicts the power consumption of the computation on both machines. The power consumption of m3 is approximately 72W and thus lower than the power consumption of m4 (around 80W). However, the execution time to complete the computation is longer on m3. Therefore, we require more energy to execute the computation on m3. It costs 3390J to run on m3 and only 1810J to run on m4.
Given this difference, we must use carefully power or energy depending on the context and depending on what we want to compare or measure.
50 55 60 65 70 75 80 0 5 10 15 20 25 30 35 40 45 50 Power Consumption (W) Time (s) m4 m3
Figure 2.1: The power consumption of m3 is lower, but the execution time is longer, and thus, we consume more energy for the calculation.
2.2.2 Physical Power Meters
Different approaches exist to measure the power consumption of single machines or in data centers. Power can be measured at different levels, for example for an entire rack of servers, for a single machine or within the components of a machine (e.g. only the processor).
In most works presented in this thesis we used a Alciom PowerSpy power meter.1 This wattmeter is attached to the power plug of a machine (or other devices) and sends in real-time power data using Bluetooth. The power meter comes with Windows drivers, but an open-source driver for Linux was developed in the context of this thesis.2
We use the values obtained from the physical power meter as a ground truth for our power estimation approaches. Furthermore, we can use the measured values to study the impact of different components on the power consumption.
1http://www.alciom.com/en/products/powerspy2-en-gb-2.html, accessed on 12.07.2016
2.2.3 Thermal Design Power
The Thermal Design Power (TDP) for a specific hardware can typically be extracted from the manufacturer’s data sheet. It corresponds to the average maximum power a processor can dissipate while running a program. This is not the maximum power that a processor can reach. There can be moments in the execution where the power is higher than the TDP, but then temperature will raise. When the temperature hits the limit, the processor can scale down the frequency of the calculations.
2.3 Impact of Hardware Features on the Power
Consumption
This section describes different factors that have an impact on the power consumption of a machine. For a CPU-intensive workload, for example, the temperature may rise with time. Also, different hardware features can impact the power consumption. Older machines tend to have simpler architectures and thus are less complex to understand in terms of power behavior.
In particular, in this thesis, I consider the following hardware features:
HyperThreading. HyperThreading technology enables multiple threads to share the same physical core.3 It allows us to run applications simultaneously but still maintaining the system responsiveness.
Dynamic Voltage and Frequency Scaling (DVFS). DVFS is a power management technique on modern computer architectures [9]. The frequency (and thus voltage) of the CPU cores is dynamically adapted, depending on current applications.
TurboBoost/TurboCORE. Another feature provided by recent computer architec-tures is TurboCORE (AMD)4 / TurboBoost (Intel).5 These features allow CPUs to temporarily run over the normally allowed operation frequency. This is done via dynamic control of the processor’s clock rate and it is activated whenever the operating system asks for the highest performance state.
3 http://www.intel.com/content/www/us/en/architecture-and-technology/hyper-threading/hyper-threading-technology.html, accessed on 12.07.2016 4http://www.amd.com/en-us/innovations/software-technologies/turbo-core, accessed on 12.07.2016 5 http://www.intel.com/content/www/us/en/architecture-and-technology/turbo-boost/turbo-boost-technology.html, accessed 12.07.2016
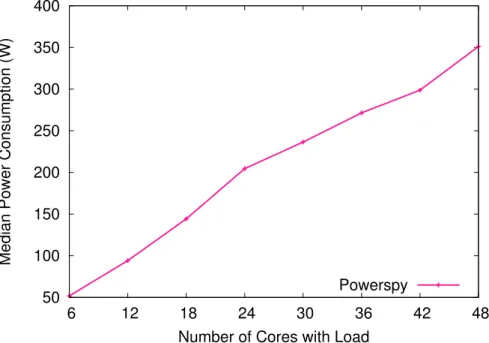
As a first example we consider a very simple AMD machine with 48 cores. It does have no HyperThreading, no DVFS and no turbo feature. We execute the stress command to generate CPU load, we load a different number of cores (i.e ., 6,12,18,24,30,36,42,48) and measure the power each time. Figure 2.2 shows the median power consumption for each configuration.
50 100 150 200 250 300 350 400 6 12 18 24 30 36 42 48
Median Power Consumption (W)
Number of Cores with Load Powerspy
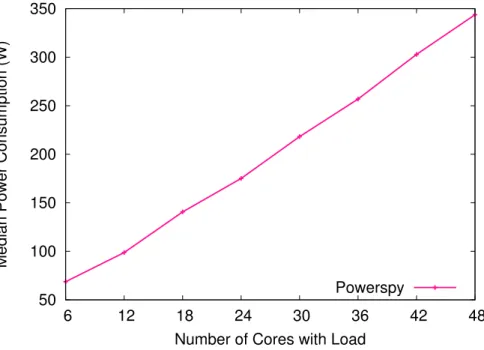
Figure 2.2: Median power consumption for load on an increasing number of cores. We notice that the curve is almost linear. The curve is slightly higher between 18 and 42 cores being stressed. This machine has four processors with 12 cores each. By default, the processes will be scheduled across the processors to obtain a load balancing for reliability. For example, when we stress four cores, the processes will be load-balanced over all four processors. Each processor will have load on one core. To make the power curve perfectly linear, we can pin the stress processes manually to the cores. When we pin the stress processes to cores, we first fill all available cores on the first processor. Then we start loading the second processor, and so on. Figure 2.3 shows the results of the same experiment, with manual assignment of processes to cores.
We notice that now the power increase is perfectly linear with increasing number of cores being stressed. This is due to the simple architecture of the machine, without particular hardware features.
50 100 150 200 250 300 350 6 12 18 24 30 36 42 48
Median Power Consumption (W)
Number of Cores with Load Powerspy
Figure 2.3: Median power consumption for load on an increasing number of cores (pinned).
2.3.1 Impact of DVFS and Turbo features
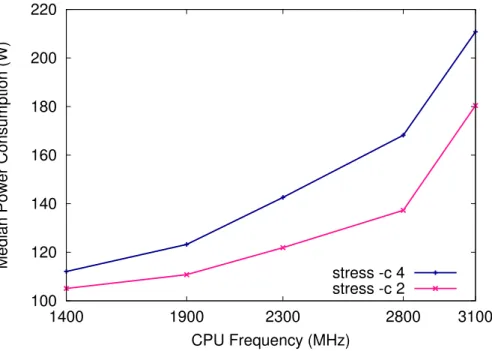
In this subsection we will look into the impact of DVFS and turbo features on the power consumption. We look at the power values of an 8-core AMD FX-8120 machine with a regular frequency of 1400MHz to 3100MHz and a turbo frequency that reaches 3400MHz on more than 4 cores and 4000MHz on 4 cores or less. Using the Linux userspace governor, we manually set the CPU frequency to the available frequencies. Figure 2.4 shows the median power consumption for load on 2 and 4 cores. Load was generated using the Linux stress utility.
The power consumption is lower for CPU load on only two cores. In both cases, the power consumption increases with a higher frequency. In this example we only reach 3100MHz, we are not able to set the turbo frequencies manually using this utility.
2.3.2 Impact of HyperThreading
Another hardware feature that has a large impact on the power behavior is Hyper-Threading.
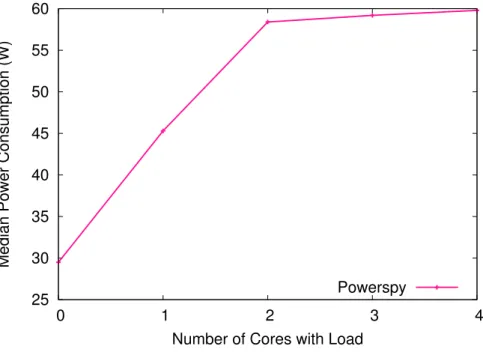
To show the impact of this technology on the power consumption, we consider an Intel i3 machine with 2 physical cores and 4 hardware threads implementing Hyper-Threading. We stress 1 to 4 cores using the Linux stress utility and compute for each
100 120 140 160 180 200 220 1400 1900 2300 2800 3100
Median Power Consumption (W)
CPU Frequency (MHz)
stress -c 4 stress -c 2
Figure 2.4: Median power consumption during stress on 2 and 4 cores for different CPU frequencies.
setup the median power. Figure 2.5 shows the results.
We notice that the power consumption increases linearly up to two cores being stressed. After that, the power curve gets almost flat. This is due to the fact that there are only two physical cores available on the machine. So even when there are 4 hardware threads, and it seems that there are 4 executions in parallel, the actual power consumed is almost the same as for 2 hardware threads.
2.4 Impact of Temperature
The temperature can have an impact on power consumption and lead to results that may be difficult to interpret. We run a simple utility to stress 5 from 6 cores of the CPU of a AMD Phenom II X6 1090T processor. When measuring the power consumption, we observe severe peaks, as shown in Figure 2.6. This is unexpected, since the workload on the CPU is constant. We would have expected a constant power curve.
Further investigations show that this behavior is related to the temperature of the machine. Using the Linux sensors utility, we observe the temperature.
The power consumption reported by the physical powermeter corresponds in the first (increasing) part to the temperature that goes up to 70 degrees. Hardware
25 30 35 40 45 50 55 60 0 1 2 3 4
Median Power Consumption (W)
Number of Cores with Load Powerspy
Figure 2.5: Median power consumption for load on an increasing number of cores.
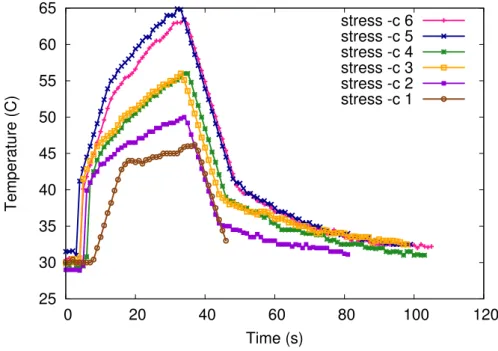
settings prevent the temperature to get higher than 70 degrees and rather decrease the frequency of the CPU. Using the Linux powertop utility, we observe that once the maximum allowed temperature is reached, part of each core’s load is scaled to a lower frequency. Figure 2.7 shows the temperature during loads of 30 seconds on one to six cores. We can observe that even for this load with a very short execution time, the temperature reaches the maximum when six cores are stressed.
60 80 100 120 140 160 180 200 220 240 0 50 100 150 200 250 300 Power Consumption (W) Time (s) stress -c 5
Figure 2.6: Values reported by the physical powermeter for a load on 5 cores with standard settings. 25 30 35 40 45 50 55 60 65 0 20 40 60 80 100 120 Temperature (C) Time (s) stress -c 6 stress -c 5 stress -c 4 stress -c 3 stress -c 2 stress -c 1
Figure 2.7: Evolution of the temperature during 30 seconds load on a different num-ber of cores.
2.5 The ParaDIME Project
The work presented in this thesis was done in the context of the European Project Parallel Distributed Infrastructure for Minimization of Energy (ParaDIME).6 Led by the Barcelona Supercomputing Center (BSC), the ParaDIME project consisted of five partners: IMEC (Belgium), Technische Universit¨at Dresden (Germany), Univer-sit´e de Neuchˆatel (Switzerland), CLOUD & HEAT Technologies GmbH (Germany) and BSC (Spain). The goal of the ParaDIME project was to come up with a new hardware-software stack, based on emerging device technologies (as heterogeneous processor architectures), new programming models, as well as new runtime and scheduling systems for data centers.
Data Center
Intra Data Center Scheduler
M u lt i D a ta C e n te r S ch e d u le r Computing Node/Stack R e a l H W JVM JVM OS OS VM VM Hypervisor Computing Node
based on Existing Hardware
Hyper JVM JVM OS VM Scala AKKA API Application/BM Computing Node/Stack R e a l H W JVM JVM OS OS VM VM Hypervisor Computing Node
based on Existing Hardware
Hyper JVM JVM OS VM Scala AKKA API Application/BM
Real Hardware & Future Devices
Real Hardware & Future Devices
ParaDIME Infrastructure
Figure 2.8: The ParaDIME infrastructure.
Figure 2.8 represents the ParaDIME infrastructure. The ParaDIME project combines several methodologies to reduce the energy consumption at different levels. The efforts of the University of Neuchˆatel were focused on the benchmark and application
selection and the programmer’s perspective on energy efficiency. In particular, this included: (1) providing a programmable energy-efficient API for message passing, (2) providing support for controlling the voltage of the underlying CPU, and (3) providing an insight on how much energy an application consumes. The contributions of this thesis are relevant in particular for providing an insight on how much energy an application consumes. Regarding the stack in Figure 2.8 my work is placed in the areas of Intra Data Center Scheduler, Real HW, Hypervisor, VM and OS. The insights I gained during the work on BitWatts [7], EPAVE [5] and PowerIndex [6], which are presented in this thesis, contribute to the goals of the ParaDIME project.
2.6 Related Work
This section contains the state-of-the-art in research related to the contributions of this thesis. In the first part, I will describe existing power models for the CPU and virtual machines. Then, I will look into the related work for data centers considering heterogeneity and power attribution. In the last part I will discuss existing battery models.
2.6.1 Power Models
Models for power estimation have been mainly studied at the level of processors, and less extensively in the context of virtualization. We give an overview of previous research on both aspects in the rest of this subsection.
CPU Power Models
As current platforms do not provide fine-grained power measurement capabilities, McCullough et al. [10] argue that power models are the first step to enabling dynamic power management for power proportionality on all levels of a system. Currently, the approach closest to hardware-based monitoring is the running average power limit (RAPL) feature available for the Intel Sandy Bridge and Ivy Bridge CPUs [11], which allows for monitoring the power consumption of the whole CPU package.
As this feature is not available on other CPUs, power models typically rely on a number of performance counters. For example Li and John [12] use 5 counters, including the instructions per cycle (IPC) counter, and rely on a regression model for estimation. Similar work has been performed by Contreras et al. [13] who addi-tionally consider different CPU frequencies, but not multi-core architectures. Bircher
and John [14] managed to reduce the error of power models to 9 % using performance counters for component-level power estimation. Other work starts with all available counters and then try to reduce their number [15] by analyzing the correlation be-tween counters of different architectures and power dissipation. Usually the accuracy of the models is validated by comparing estimates with the measures of a power meter when running benchmarks in isolation [16].
Power modeling often considers learning techniques—for example based on sam-pling [17]—that assume the proportionality of system events to power consumption. Measurements of a hardware power meter are gathered and subsequently used, to-gether with a set of normalized estimated values, in various regression models, which are so far mostly linear [10].
Kansal et al. [18] and Versick et al. [19] notably point out that linear power models depending on the CPU load are not sufficient anymore and that more parameters have to be considered. McCullough et al. [10] show that, especially in multi-core systems, linear models lead to a much higher mean relative error of 10-14 % for CPU power consumption and cannot easily be improved by applying more complex techniques. Linear models rely on the independence of the covered features, which is not realistic in current systems. Polynomial/exponential regression can cover these dependencies and, as shown in [14], a quadratic solution better fits the power modeling of multi-core systems. The described systems must however isolate processor features, such as HyperThreading and TurboBoost, to avoid hidden states. HaPPy [20] introduces a HyperThread-aware power model that differentiates between the cases where either single or both hardware threads of a core are in use.
Shen et al. [21] propose power containers to manage energy and power usage on multi-core servers and cloud computing platforms. The authors evaluate power con-tainers with multiple applications, but each of them is considered separately. Power containers are also tied to physical hosts and not evaluated in a virtual environment. VM Power Models
In data centers, the efficiency of VM consolidation, power dependent cost modeling, and power provisioning are highly dependent on accurate power models [22]. Such models are particularly needed because it is not possible to attach a power meter to a virtual machine [23]. In general, VMs can be monitored as black-box systems for coarse-grained scheduling decisions. If we want to be able to do fine-grained schedul-ing decisions—e.g., with heterogeneous hardware—we need to be able to consider
finer-grained estimation at sub-system level and might even need to step inside the VM.
So far, fine-grained power estimation of VMs required profiling each application sep-arately. One example is WattApp [24], which relies on application throughput instead of performance counters as a basis for the power model. The developers of pMapper [22] argue that application power estimation is not feasible and instead perform resource mapping using a centralized step-wise decision algorithm.
To generalize power estimation, some systems like Joulemeter [18] assume that each VM only hosts a single application and thus treat VMs as black boxes. In a multi-VM system, they try to compute the resource usage of each VM in isolation and feed the resulting values in a power model.
Bertran et al. [17] propose an approach closer to our approach (BitWatts described in Chapter 5). They use a sampling phase to gather data related to performance-monitoring counters (PMCs) and compute energy models from these samples. With the gathered energy models, it is possible to predict the power consumption of a process, and therefore apply it to estimate the power consumption of the entire VM. Another example is given by Bohra et al. in [25], where the authors propose a tool named VMeter that estimates the consumption of all active VMs on a system. A linear model is used to compute the VMs’ power consumption with the help of available statistics (processor utilization and I/O accesses) from each physical node. The total power consumption is subsequently computed by summing the VMs’ con-sumption with the power consumed by the infrastructure.
Janacek et al. [26] use a linear power model to compute the server consumption with postmortem analysis. The computed power consumption is then mapped to VMs depending on their load. This technique is not effective when runtime information is required.
In Stoess et al. [27] the authors argue that, in virtualized environments, energy mon-itoring has to be integrated within the VM as well as the hypervisor. They assume that each device driver is able to expose the power consumption of the corresponding device as well as an energy-aware guest operating system and is limited to integer applications.
2.6.2 Data Centers
Heterogeneity and Placement
Existing research often assumes that data centers consist of homogeneous hardware. However, this is not realistic in real-world data centers, as shown in [4]. We often find different generations of the same hardware in a data center, or even different types of hardware combined. This tendency led to the concept of warehouse scale computers (WSCs) [28] composed of diverse microarchitectures and configurations. Paragon is a scheduler aware of heterogeneity and interference [29] [30]. It decides for a specific workload on which server configuration it will perform best (heterogeneity). It also considers how much interference it will cause to other applications and how much interference it can tolerate regarding its own shared resources. This approach mainly focusses on performance and preserving the QoS rather than power or energy efficiency.
Another existing approach focusses more on the power aspect: It defines an intelligent workload allocation method that efficiently maps workloads to the best matching platform [31]. The authors show that their approach significantly reduces the overall power consumption of the data center (12-22% power saving over random allocation). In their evaluation, they measure power and performance across each platform and then extrapolate the measured data using a data center allocation simulator.
Idle Power Attribution
The idle power concerns the power consumed by an infrastructure which is powered on but not running any task. Typically, for a server, it consists of the energy con-sumed while idle, but fully powered on. This consumption depends on the hardware of the server, but it can also depend on the operating system installed on it as it is responsible for the background tasks running continuously on the server (like mon-itoring tasks). This power is usually not taken into account by VM-based models. For an entire data center, the idle power consumption includes all the power which does not depend on the workload.
Often only the power consumption of IT equipment is considered although air con-ditioning can consume 33% of the global power needed by a data center [32]. This cost can be reduced by free cooling techniques exploiting outside air [33]. The power consumption of such cooling techniques is tightly correlated to the weather, and thus vary over time even if the workload does not vary. Therefore, their power
consumption, which is considered to belong to the static idle part, can vary over time.
Most of the studies do not use the same definition for the energy costs of the com-puting infrastructure: for instance, the network used to link the comcom-puting resources is not taken into account most of the time. In the same way, as surveyed in [34] some works take into account only the dynamic consumption of the machines and not their static consumption (corresponding to the consumption when machines are powered on but idle) which can yet represent more than half of the total power consumption. In our context, we will consider all the equipment operated by the cloud provider: the data centers (including cooling infrastructures) and the network links inside and between the data centers.
Power Attribution Models
Benefiting from economies of scale, cloud infrastructures can effectively manage their resources and offer large storage and computing capacities while minimizing the costs for users. However, the rapid expansion of these infrastructures led to an alarming and uncontrolled increase of their power consumption. For instance, in 2010, the services offered by Google were based on 900,000 servers that consumed an average of 260 million Watts [35].
Moving from instrumenting to modeling the energy consumption is a tough but necessary task in order to improve the energy efficiency of distributed infrastructures. It is indeed essential to understand how the energy is consumed to be able to design energy-efficient policies.
Most of the models found in literature split the consumption of an entire server into the consumption of each component of the server [25] or consider that consumption is proportional to the load [36]. Several studies are focused on modeling the energy consumption of particular components: CPU [37] influenced by the frequency, voltage and workload, network card [38] with costs per packet and per byte, and disk [39] driven by the rotational speed and the read and write operations.
However, as shown in [40] the limits of these approaches are to model the energy consumption of entire servers under various workloads. Concerning the experimental approaches found in literature, they mainly consider just one type of machine, or even only one type of application [40]. So, it is necessary to design unified models closer to reality. Concerning the consumption of entire infrastructures, the authors of [41] show that computing resources represent the biggest part in cloud’s consumption. An alternative approach [42] shows that, depending on the studied scenario, the energy
costs of the network infrastructure that links the user to the computing resources can be bigger than the energy costs of the servers.
As shown in [40], simple models are not convincing in the general case and especially for multicore architectures – which tend to become widespread. It is therefore neces-sary to depend on benchmarks for the development and validation of reliable energy cost models for these heterogeneous resources. These benchmarks need to propose several kinds of workloads: computation-intensive, disk-intensive, etc.
2.6.3 Battery Models
Apart modelling the components with power plug, we need to consider mobile devices that might be powered by battery.
The most simplified battery model consists of an ideal voltage source in series with an internal resistance [43]. The drawback of this model is that it does not include the state-of-charge of the battery.
Chen et al. [44] propose a model based on usable capacity, open-circuit voltage, and transient response and implement it in the Cadence environment. The model accounts for all dynamic characteristics of the battery, from non-linear open-circuit voltage, current, temperature, cycle number, and storage-time dependent capacity to transient response. In the validation they are using a simplified model: it neglects self-discharge, cycle number, and temperature. The evaluation considers NiMH and polymer Li-ion batteries. Erdinc et al. [45] extend the previous model and establish a simulation model in a MATLAB/Simulink environment. The extension of the model consists in adding the effects of temperature and capacity fading. The drawback of these two approaches are that the parameter extraction requires experiments on physical batteries for each type of battery.
Kuhn et al. [46] propose a model based on open circuit voltage in series with a resistance and parallel RC circuit with Warburg impedance. The identification of the parameters for this approach is based on impedance spectroscopy [47], and thus rather complicated.
Badam et al. [48] implement a system that can integrate batteries of different chemistries. The approach is based on open circuit potential, internal resistance, concentration resistance, and plate capacitance (simplified Thevenin model). It consists of compo-nents across three layers: batteries and their chemistries, the battery management circuit, and the operating system. The software-defined battery (SDB) hardware supports discharging and charging across multiple heterogeneous batteries. Authors provide a hardware prototype and a multi-battery emulator to evaluate the solution.
The drawback of this solution is that the parameter extraction is complex. The four parameters required are learned during experimentation on physical batteries and, as a consequence, it might be hard to apply this model to different types of batteries. Gao et al. [49] propose a model that accounts for non-linear equilibrium potentials, rate and temperature dependencies, thermal effects, and response to transient power demand. The model is based on publicly available data (e.g., from datasheets). This approach claims to be an intermediate approach with sufficient accuracy, but avoiding detailed calculations of internal electrochemical processes. The model was tested in the Virtual Test Bed environment.
Our model which is described in detail in Chapter 6 is based on previous work of Tremblay et al. [50] [51]. Their model is based on the Shepherd model [52], with some modifications due to implementation factors. The model from Tremblay et al. is included in the SimPowerSystems simulation. The parameter extraction is very simple and all required parameters can be extracted or easily computed from the manufacturer’s datasheet. The battery model is based on a simple controlled voltage source in series with a constant resistance. The open voltage source is calculated based on the state of charge. The discharge behavior for a Li-Ion battery is modelled by formula:
Vbatt = E0− R · i − K Q
Q − it · (it + i∗) + Aexp(−B · i)
where Vbatt is the battery voltage (V), E0 is the battery constant voltage (V), K is a polarisation constant (V/(Ah)) or polarisation resistance (Ω), Q is the battery capacity (Ah), it is the actual battery charge (Ah), A is the exponential zone ampli-tude (V), B is the exponential zone time constant inverse (Ah)−1, R is the internal resistance (Ω), i is the battery current (A), and i* is a filtered current (A).
Basis for Workload Placement in
Heterogeneous Multi-Cloud
Environments
In this chapter we study the performance and energy efficiency of a set of heteroge-neous architectures for multiple applications. This chapter covers the first part of the contributions for the data center layer of the stack presented in Chapter 1. More sophisticated approaches for data centers will be presented in Chapter 4.
3.1 Introduction
Due to the environmental concerns of different energy resources and the massive power consumption of large data centers, energy efficiency becomes more and more important. Cloud computing as a whole consumes more energy than countries like Germany or India [1]. Besides the environmental reason, reducing the energy con-sumption within data centers reduces their total cost.
A first step to reduce energy consumption is making hardware more energy-efficient. One of the hardware components responsible for the highest power consumption is the CPU. The Thermal Design Power (TDP) specifies the maximum amount of heat generated by the CPU that must be dissipated by the cooling system. For example, an Intel i7 Bloomfield processor with 4 cores from 2008 has a TDP of 130W.1 In contrast, an Intel i7 Haswell-DT processor with 4 cores from 2013 has a TDP as low as 35W.2An approach to improve energy efficiency is to reduce energy and power con-sumption by energy-aware workload-scheduling. For example, Mashayekhy et al. [53] propose a scheduler where MapReduce jobs are scheduled to different machines under
1http://ark.intel.com/products/37147/Intel-Core-i7-920-Processor-8M-Cache-2 66-GHz-4
80-GTs-Intel-QPI, accessed on 17.07.2016
2http://ark.intel.com/products/75121, accessed on 17.07.2016
constraints of energy consumption. The authors developed a greedy algorithm that improves energy efficiency while still satisfying the negotiated service level agreements (SLA). With their approach, the energy consumption can be reduced by 40 %, but they only consider a single data center and assume homogeneous hardware.
The concept of sky computing was introduced by Keahey et al. [54]. The authors show that with virtualization and overlays it is possible to build a multi-cloud environment in a trusted environment. However, this brings also problems of heterogeneity (not only on the hardware level) and application scheduling becomes more challenging. One example that tackles multi-cloud scheduling is shown by Tordsson et al. [55], who optimize the placement of virtual machines among different cloud providers to achieve higher performance, lower costs and better load balancing. A cloud broker containing a scheduler implements the decision logic based on user-specified criteria, but does not in particular consider heterogeneous hardware or energy efficiency. In the Reservoir project [56] a key role is a scheduler that assigns a particular workload to the best fitting cloud. The placement is based on a load balancing policy or a power preservation policy. With the power preservation policy the virtual machines are aggregated on a minimal number of physical machines and the other machines are switched off. These two policies show that there is a tradeoff between performance and power consumption. While the reduced number of machines will reduce the overall power consumption, the challenge is to not over-commit the system to avoid SLA violations during peak phases.
Besides tackling challenges towards performance and power consumption, most of the previously described research assumes that data centers consist of homogeneous hardware. However, this assumption is not realistic in real-world data centers, as shown in [4].
In this chapter, we show that it is important that the scheduler is aware of the existing hardware as well as of the type of workload. As a basis, the scheduler needs informa-tion on the current power consumpinforma-tion as well as a noinforma-tion of current performance. We show that performance per Watt is sufficient for categorizing different resources. We categorize workload types that are either CPU-intensive or disk-intensive. Then we run them on different setups and show that for being energy-efficient, workloads have to run on the right type of hardware. This experimental study is the first step towards energy-efficient scheduling decisions in a heterogeneous multi-cloud environment. This chapter is organized as follows. In Section 3.2 we explain the experimental setup with the hardware and software specification. We further go into details on the metrics used. Section 3.3 contains an extensive discussion of the gathered results and finally we conclude the chapter.
3.2 Experimental Setup
For our experiments we selected a number of hardware setups covering recent and older architectures as well as a number of representative workloads, which we describe in the following sections.
3.2.1 Hardware
Entries numbering from 1 to 8 in Table 2.1 in Chapter 2 give an overview of the architecture characteristics of a variety of systems that comprise either AMD CPUs or Intel CPUs. These machines were used in the evaluation of this chapter.
Besides the TDP, the idle power is an important characteristic to determine energy efficiency. The idle power is the power required to run just the operating system on the hardware, hence it is typically constant and has to be considered for every workload. We therefore compare the idle power of the selected systems.
For all of our measurements, we use a highly-sensitive physical power meter (Power-Spy).3 The driver for Linux is available as open source software.4 In Figure 3.1 we see that the AMD with 387 W and the Xeon with 208 W consume already much more idle power than the other systems. The reason is that these are server architectures that do not comprise the most recent hardware parts. In comparison, the mobile devices (i7 and VIA) have a very low idle value (11W and 19W respectively) as their main target is to enhance battery life.
0 50 100 150 200 250 300 350 400
i3 i5 i7 haswell xeon amd amd-tc via
Idle Power (W)
Figure 3.1: Idle power consumption (only OS, no workload) of the different systems.
3http://www.alciom.com/fr/produits/powerspy2.html, accessed on 17.07.2016
![Figure 1.1: Cloud computing consumed more electricity than countries like India or Germany (from Greenpeace [1]) in 2007.](https://thumb-eu.123doks.com/thumbv2/123doknet/14944831.667255/25.892.168.668.524.855/figure-cloud-computing-consumed-electricity-countries-germany-greenpeace.webp)