A novel method for prenylquinone profiling in
plant tissues by ultra-high pressure liquid
chromatography-mass spectrometry
Jacopo Martinis
1, Felix Kessler
1and Gaetan Glauser
2*Abstract
Background: Prenylquinones are key compounds of the thylakoid membranes in chloroplasts. To understand the mechanisms involved in the response of plants to changing conditions such as high light intensity, the
comprehensive analysis of these apolar lipids is an essential but challenging step. Conventional methods are based on liquid chromatography coupled to ultraviolet and fluorescence detection of a single or limited number of prenylquinones at a time. Here we present an original and rapid approach using ultra-high pressure liquid chromatography-atmospheric pressure chemical ionization-quadrupole time-of-flight mass spectrometry (UHPLC-APCI-QTOFMS) for the simultaneous profiling of eleven prenylquinones in plant tissues, includinga-tocopherol, phylloquinone, plastochromanol-8 and plastoquinone-9.
Results and discussion: Mass spectrometry and chromatography parameters were optimized using pure standards. Sample preparation time was kept to minimum and different extraction solvents were evaluated for yield, ability to maintain the redox state of prenylquinones, and compatibility with chromatography. In addition to precise absolute quantification of 5 prenyllipids for which standards were available, relative quantification of 6 other related compounds was possible thanks to the high identification power of QTOFMS. Prenylquinone levels were measured in leaves of Arabidopsis grown under normal and high light intensities. Quantitatively, the obtained results were consistent with those reported in various previous studies, demonstrating that this new method can profile the full range of prenylquinones in a very short time.
Conclusion: The new profiling method proves faster, more sensitive and can detect more prenylquinones than current methods based on measurements of selected compounds. It enables the extraction and analysis of twelve samples in only 1.5 h and may be applied to other plant species or cultivars.
Keywords: Prenylquinones, ultra-high pressure liquid chromatography, quadrupole-time-of-flight mass spectrome-try, light stress, Arabidopsis thaliana
Background
The exposure to high light (HL) intensities is a normal event for plants growing under field conditions and represents a source of stress to the photosynthetic appa-ratus, both by direct photodamage and because of the formation of reactive oxygen species (ROS). Higher plants have evolved an array of mechanisms in order to dissipate the excess energy and protect themselves from
potential damage. In addition to state transition and changes in chloroplast ultrastructure, leaves acclimate to variations in light conditions through the accumulation of various antioxidants and the turnover of key photosys-tem components and reduced electron carriers. Prenyl-quinones, in particular, play a fundamental role in this process and include molecules with a broad action spec-trum [1]. Plastoquinone-9 and ubiquinone-9, for exam-ple, are the two main lipophilic electron carriers in chloroplasts and mitochondria, respectively. In chloro-plasts, a-tocopherol (vitamin E) acts as the major antioxi-dant together with the reduced form of plastoquinone-9
* Correspondence: gaetan.glauser@unine.ch
2
Chemical Analytical Service of the Swiss Plant Science Web, University of Neuchâtel, 2000 Neuchâtel, Switzerland
and its derivative plastochromanol-8, protecting mem-branes from photoxidative stress [2-8]. Phylloquinone (Vitamin K1), on the other hand, is also a strong
antioxi-dant but its main biological role is as one-electron carrier in the A1 site of photosystem I. Moreover, it has been
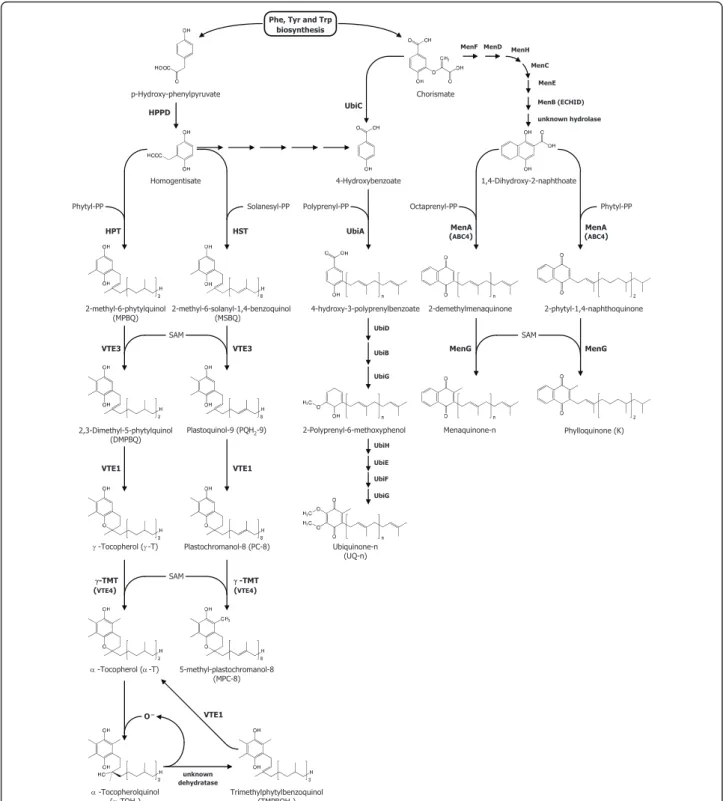
demonstrated that in cyanobacteria phylloquinone can be replaced by plastoquinone-9 in the active site, but this does not occur in higher plants [9-11]. There is increas-ing evidence that prenylquinone metabolic pathways clo-sely intersect [12] (Figure 1) and thus a suitable analytical technique enabling the detection of global and subtle changes in the profile of these thylakoid lipids is required. Most of the current methods for the analysis of prenyl-quinones are based on their extraction by an organic sol-vent followed by chromatographic analysis of selected molecules. However, the solvent choice may represent a major limiting factor for the extraction and chromatogra-phy efficiency. In addition to their variable extractive power related to the polarity of each molecule, some of the commonly used protic solvents may promote the spontaneous oxidation of the reduced forms of some lipids. The extraction protocol can also influence the sta-bility and the redox state of the extracted molecules: in particular, reduced forms can be easily oxidized by atmo-spheric oxygen if samples are exposed to air or to high temperatures for a prolonged period of time. The separa-tion and detecsepara-tion of the components of thylakoid mem-branes represents another key factor to obtain unambiguous lipid profiles. Recent methods are based on normal or reverse-phase high performance liquid chro-matography (HPLC) coupled to ultraviolet and fluores-cence detection [12-14]. These techniques require long running times (several dozens of minutes) to obtain suffi-cient resolution and the identification of lipid constitu-ents relies on the availability of pure standards. Mass spectrometry, despite its high potential for the detection and identification of various apolar lipids [15], has been scarcely employed in combination with liquid chromato-graphy for the analysis of prenyllipids in plants.
In this paper we propose a novel method for prenyl-quinone analysis using an optimized sample preparation procedure followed by ultra-high pressure liquid chro-matography-atmospheric pressure chemical ionization-quadrupole time of flight mass spectrometry (UHPLC-APCI-QTOFMS). Compared to conventional HPLC, UHPLC uses sub-2μm particle supports which allows for higher efficiency and optimal velocity [16,17]. Conse-quently, high throughput separations can be obtained by reducing column lengths and increased flow rates. The QTOF mass spectrometer is particularly well adapted to coupling with UHPLC thanks to its rapid scanning rate [18]. Moreover its high mass accuracy gives access to the determination of molecular formula, an essential fea-ture for reliable compound identification. Different
solvents were tested for their extraction yield, their abil-ity to maintain the redox state of molecules as well as their compatibility with reverse-phase UHPLC as injec-tion solvent. Chromatography and mass spectrometry parameters were optimized for speed, selectivity and sensitivity. The applicability of the developed method was illustrated with the simultaneous quantification of several prenylquinones in Arabidopsis thaliana grown under normal and high light conditions.
Results and Discussion
Optimization of MS conditions
While there have been several publications on the LC-MS analysis of tocopherols [19,20] and vitamin K homo-logues [21,22] as they are essential vitamins for human metabolism, we are not aware of any report for plasto-quinone-9 (PQ-9) and plastochromanol-8 (PC-8). Thus different QTOFMS parameters were evaluated to obtain maximal sensitivity for these latter molecules together with a-tocopherol (a-T) and phylloquinone (K). Electro-spray and APCI were compared in both positive and negative ionization modes using standard solutions at 1 μg/mL. For PQ-9, the oxidized form (PQ) was used as standard. APCI was found largely superior to electro-spray for all four compounds. K, PQ and PC-8 gave similar responses in positive and negative APCI but a-T was much better ionized in negative mode (ca. 8-fold), which was thus selected for further experiments. We then tested the effect of the probe temperature on the ionization efficiency. While a-T and K gave a higher sig-nal at lower temperatures (350-500°C), PC-8 and PQ were best ionized at higher temperatures (475-600°C). A temperature of 475°C was selected as the best compro-mise for the detection of the four compounds. The source cone voltage was varied from 15 to 50 V and the highest response was obtained at 40 V. Other source parameters such as corona current (18μA), source tem-perature (120°C) and desolvation gas flow (800 L/hr) had a less important effect on the MS signal. The influ-ence of the mobile phase composition on the ionization efficiency was evaluated. Methanol (MeOH), acetonitrile (ACN) and tetrahydrofuran (THF) were compared and MeOH gave the best signal for all compounds. For a-T and K, the intensity of MS responses in MeOH was 2-5 fold higher than in ACN or THF. For PQ and PC-8 it was 10-40 fold higher. MeOH was thus selected as the organic solvent of choice for further LC method development.
Optimization of LC conditions
Prenyllipids are traditionally separated by isocratic nor-mal-phase chromatography using diol columns and very apolar solvents or by reverse-phase (RP) chromatogra-phy using octadecyl (C18) columns and mixtures of
MeOH/Ethanol or ACN/Ethanol as mobile phases. In RP mode, small amounts of hexane are sometimes used to accelerate the elution of PQ and PC-8 which are more hydrophobic than a-T and K. Run times are quite long (typically 20-40 min) because complete resolution of the peaks is needed for accurate quantification by
ultraviolet and fluorescence detection. Using MS as a detector however, resolution becomes less important and chromatographic separations can often be shor-tened. In this study, UHPLC coupled to QTOFMS detection was evaluated for the high throughput analysis of prenyllipids. A 50 × 2.1 mm C18 column filled with
p-Hydroxy-phenylpyruvate Homogentisate 2-methyl-6-phytylquinol (MPBQ) 2-methyl-6-solanyl-1,4-benzoquinol (MSBQ) 2,3-Dimethyl-5-phytylquinol (DMPBQ) Plastoquinol-9 (PQH2-9) J -Tocopherol (J -T) D -Tocopherol (D -T) D -Tocopherolquinol (D-TQH2) Trimethylphytylbenzoquinol (TMPBQH2) Plastochromanol-8 (PC-8) 5-methyl-plastochromanol-8 (MPC-8) Chorismate 4-Hydroxybenzoate 4-hydroxy-3-polyprenylbenzoate 2-Polyprenyl-6-methoxyphenol Ubiquinone-n (UQ-n) 1,4-Dihydroxy-2-naphthoate 2-demethylmenaquinone 2-phytyl-1,4-naphthoquinone Menaquinone-n Phylloquinone (K)
Phe, Tyr and Trp biosynthesis HPPD HPT HST VTE3 VTE3 VTE1 VTE1 J-TMT (VTE4) J -TMT (VTE4) O– VTE1 unknown dehydratase MenA UbiA MenA UbiC
MenF MenD MenH MenC MenE MenB (ECHID) unknown hydrolase (ABC4) (ABC4) UbiD UbiB UbiG UbiH UbiE UbiF UbiG MenG MenG
Phytyl-PP Solanesyl-PP Polyprenyl-PP Octaprenyl-PP Phytyl-PP
SAM
SAM
SAM
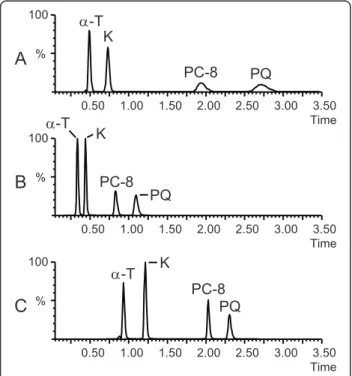
1.7μm particles was selected for the separation. We first tested an isocratic 100% MeOH mobile phase at 25°C. Adequate retention factors (k) were obtained for a-T (k = 2.3) and K (k = 3.9), but PC-8 (k = 11.7) and PQ (k = 17) were too strongly retained leading to broad peaks and a decrease in sensitivity (Figure 2A). Since the use of MeOH as organic solvent was a required condition for MS sensitivity, we could not replace it by a solvent of higher eluting power. An alternative option to decrease the retention of PC-8 and PQ was to increase the temperature of the column. At 60°C, the retention factors for PC-8 and PQ were reduced to appropriate values, respectively 4.5 and 6.3. Meanwhile, the reten-tion for a-T and K became slightly too weak with k values of 1.1 and 1.9 respectively (Figure 2B). To over-come this issue, a 1.5 min gradient from H2O/MeOH
(10:90, v/v) to 100% MeOH was implemented at the beginning of the run followed by a hold at 100% MeOH for 2.5 min. Using this optimized separation, all com-pounds of interest eluted between 0.9 and 2.5 min and gave symmetrical and sharp peak shapes (Figure 2C). We verified that no thermal degradation occurred at 60° C. Although prenyllipids are neutral molecules and their retention times are not likely to be affected by a possible
change in pH, we also tested the impact of mobile phase additives such as formic acid in terms of retention and ionization efficiency. As expected, no change in reten-tion times was observed. On the contrary, the ionizareten-tion efficiency was reduced by one order of magnitude for K and PQ, and more than two orders of magnitude for a-T and PC-8. a-This is not surprising since strong gas phase acids suppress proton transfers in negative APCI. It was found that even the injection of an acidic solution of standards could slightly reduce the ionization effi-ciency of a-T even if mobiles phases without additive were used. For this reason it is recommended to remove any trace of formic acid in the system, including the injector wash lines (if partial loop mode is employed), before prenyllipids are analyzed. Acids are also fre-quently used for lipid extractions in order to inhibit enzymatic hydrolysis. In the case of prenyllipids, this should be avoided.
Detection of prenylquinones in plant samples
To evaluate the performance of the developed UHPLC-APCI-QTOFMS method on biological samples, we extracted Arabidopsis plants grown under normal and high light conditions in a mixture of chloroform/metha-nol (CHCl3/MeOH, 30:70, v/v). a-T, K, PC-8, and the
oxidized (PQ) and reduced (PQH2) forms of PQ-9 were
easily detected. The presence of PQH2 was confirmed
by reducing the PQ standard with sodium borohydride and analyzing the resulting mixture. For these 5 mole-cules, positive identification was achieved based on the comparison of retention times and accurate masses with pure available standards. In addition, the QTOFMS allowed for the tentative identification of six other pre-nyllipids for which no standard was available, namely g-tocopherol (g-T), a-g-tocopherol quinone (a-TQ), hydro-xyplastochromanol (PC-OH), hydroxyplastoquinone (PQ-OH) and the oxidized (UQ) and reduced (UQH2)
forms of ubiquinone-9 (UQ-9). UHPLC-APCI-QTOFMS data acquired in negative and positive APCI for the identified prenyllipids are presented in Table 1.
Optimization of sample preparation
The above used extraction solvent (CHCl3/MeOH, 30:70
v/v) seemed to efficiently extract prenyllipids. However it had a serious drawback: CHCl3 is chemically poorly
compatible with the UHPLC system used which can accommodate all common solvents except chlorinated solvents. We therefore evaluated different extraction sol-vents based on the three following criteria: extraction yield for the prenylquinones, ability to maintain the redox state of PQ/PQH2 and UQ/UQH2, and
compat-ibility with UHPLC in terms of peak broadening and chemical resistance. A preliminary condition was to avoid an evaporation-redissolution step which would
% 100 0.50 1.00 1.50 2.00 2.50 3.00 3.50 Time
A
% 100 0.50 1.00 1.50 2.00 2.50 3.00 3.50 TimeB
% 100 0.50 1.00 1.50 2.00 2.50 3.00 3.50 TimeC
K PQ PC-8 D-T D-T K PQ PC-8 K D-T PC-8 PQFigure 2 Optimization of the chromatographic separation using pure standards. A. Isocratic MeOH 100% as a mobile phase, T = 25°C. B. Isocratic MeOH 100% as a mobile phase, T = 60°C. C. Optimized gradient H2O/MeOH (10:90, v/v) - MeOH 100% in 1.5
min, followed by MeOH 100% for 2.5 min, T = 60°C. Other conditions are given in Materials and Methods.a-T, a-tocopherol; K, phylloquinone; PC-8, plastochromanol-8; PQ: plastoquinone-9 (oxidized form).
lengthen the sample preparation and possibly alter PQ/ PQH2 and UQ/UQH2 redox ratios. Plants exposed to
HL intensity (500 μE·m-2·s-1) were pooled and lipids were extracted using MeOH, isopropanol (IPA), ethyla-cetate (EtAC), THF and CHCl3/MeOH (30:70, v/v) as
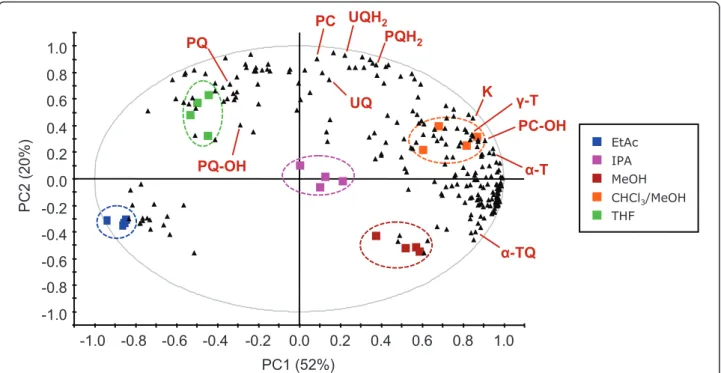
control and further analyzed by UHPLC-APCI-QTOFMS (n = 4). A principal component analysis (PCA) was performed on the obtained data. Interest-ingly, the five solvents clustered separately (Figure 3) and showed a significant selectivity for different mole-cules. In general, polar lipids including a-TQ were extracted more efficiently using MeOH, while more apo-lar solvents showed a higher extractive power for apoapo-lar prenyllipids (e.g. PQ and UQ). For all prenylquinones, the highest extraction yield was obtained with CHCl3/
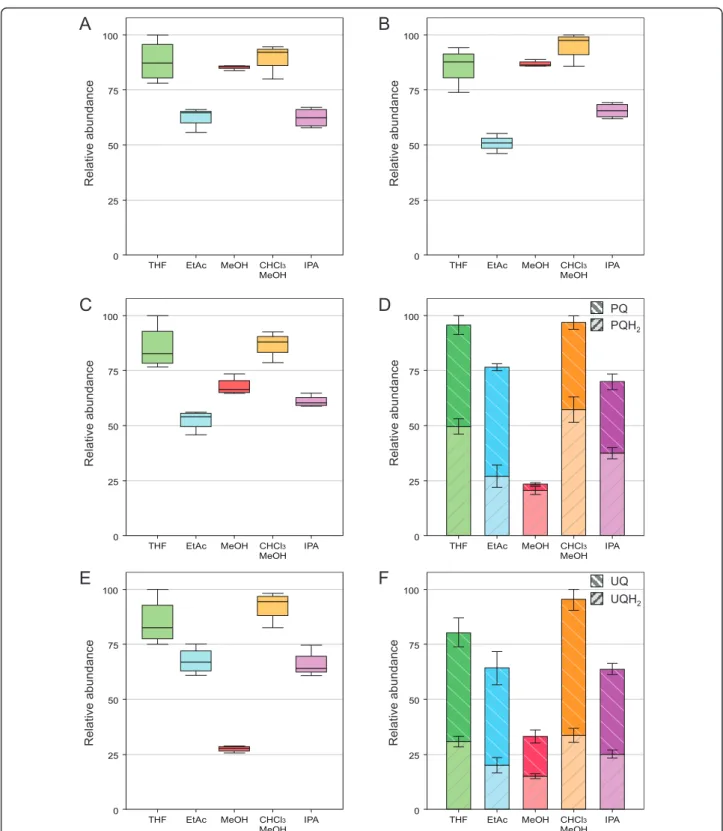
MeOH (30:70, v/v) and THF, while it was lower for EtAc and IPA (Figure 4A-F). MeOH represented a sepa-rate case because of its higher polarity, resulting in poor ability to extract PQ-9 and PC-8. Therefore MeOH is not a suitable solvent for PQ-9 and PC-8 analysis (Fig-ure 4D and 4E).
Spontaneous variations in PQ/PQH2ratio under
stan-dard working conditions were determined in the five solvents using a purified PQ standard. No spontaneous reduction was detected (data not shown). Moreover, when spiking PQ in leaf extracts, no increase in PQH2
was observed, suggesting that the reducing agents pre-sent in plant tissues are not concentrated enough to promote reduction. However, when ascorbic acid (30 mM) or butyl hydroxytoluene (BHT, 0.05%) were added to PQ solutions prepared in the different solvents, a slight reduction of PQ was observed (about 3% and 1% of the original amount of PQ using ascorbic acid or BHT, respectively). This phenomenon has previously been observed [13]. While anti-oxidant agents are often added to extraction experiments to prevent lipid
peroxidation, this procedure does not appear useful for the determination of the redox state of PQ since reduc-tion of the oxidized form may occur. When the PQ standard was chemically reduced with sodium borohy-dride and then exposed to air at room temperature, an increase of the oxidized form was detected for all sol-vents starting from 5-7 h after reduction. As a conse-quence, for the solvent to be effective in maintaining the original PQ/PQH2 ratio, it needs to oxidize the
PQH2 present in plant tissues as little as possible. Using
CHCl3/MeOH (30:70, v/v), IPA and THF, a PQH2/
PQTOT ratio≥ 0.5 was found in plants exposed to HL
conditions, while EtAc led to a PQH2/PQTOT ratio of
only 0.3 (Figure 4D). This may be due to lower extrac-tion yield for PQH2 in EtAc rather than oxidation of
PQH2into PQ. Interestingly, when plants grown under
normal light intensity (150μE·m-2·s-1) were extracted in IPA, a complete oxidation of PQH2was observed, while
this did not happen in samples extracted by CHCl3/
MeOH (30:70, v/v) and THF (data not shown). This may be explained by the higher amount of antioxidants (tocopherols or other lipid-soluble molecules) naturally present in thylakoid membranes under HL conditions, which could have protected PQH2 from spontaneous
oxidation in IPA. A similar profile was observed for UQ-9 (Figure 4F).
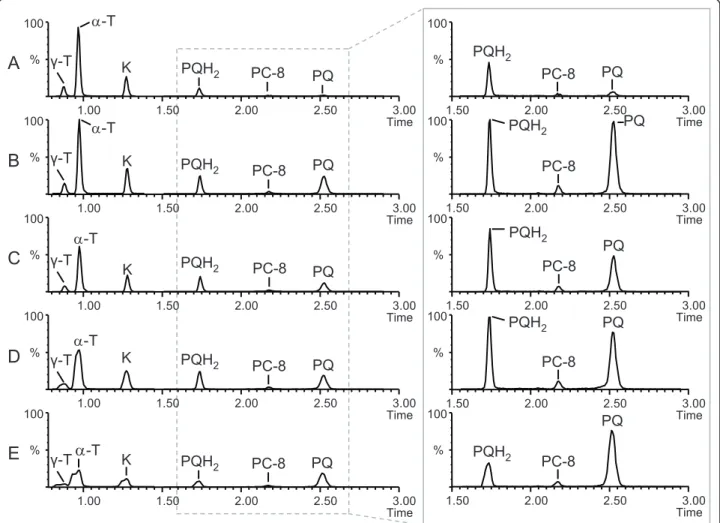
The influence of the extraction solvents on the chro-matographic performance was also evaluated. Indeed, it is well-known that injection solvents of higher elution strength than the initial mobile phase can lead to peak distortion and broadening, in particular for early eluting peaks. No significant peak broadening was observed for MeOH, CHCl3/MeOH (30:70, v/v) and IPA (Figure
5A-C). Using THF, which is a stronger solvent, g-T, a-T and K exhibited moderate peak broadening (Figure 5D). Not surprisingly, EtAc was the most problematic Table 1 Prenylquinones identified from UHPLC-APCI-QTOFMS data acquired in negative and positive ionization modes
No RT (min) APCI - m/z (-) APCI + m/z (+) formula MS/MS (-) Identification 1 0.76 (M)- 446.3763 -a -a C 29H50O3 177.0919, 163.0764 a-tocopherol-quinone 2 0.92 (M-H)- 415.3575 -a -a C 28H48O2 149.0605, 121.0655 g-tocopherol 3 1.00 (M-H)- 429.3734 (M+H)+ 431.3877 C29H50O2 163.0760, 135.0812 a-tocopherol 4 1.28 (M)- 450.3504 (M+H)+ 451.3572 C31H46O2 210.0680, 185.0607 phylloquinone 5 1.52 (M-H)- 765.6183 -a -a C53H81O3 750.5956, 149.0608 hydroxyplastochromanol 6 1.71 (M)- 764.6102 -a -a C 53H80O3 149.0604 hydroxyplastoquinone 7 1.72 (M-2H)- 748.6158 (M+H)+ 751.6385 C 53H82O2 188.0836, 149.0605 plastoquinol 8 1.89 (M-2H)- 794.6214 (M+H)+ 797.6448 C54H84O4 779.5970, 219.0661 ubiquinol 9 2.12 (M-H)- 749.6227 (M+H)+ 751.6395 C53H82O2 734.6009, 149.0608 plastochromanol-8 10 2.16 (M)- 794.6212 (M+H)+ 795.6300 C54H82O4 779.5974, 219.0655 ubiquinone 11 2.43 (M)- 748.6152 (M+H)+ 749.6232 C 53H80O2 188.0841, 149.0606 plastoquinone a
solvent: strong peak distortion was observed for g-T, a-T and K and even PQH2 was affected (Figure 5E). We
then diminished the injection volume from 5 to 2.5μL, which substantially reduced peak broadening for THF but only slightly for EtAc (data not shown). In conclu-sion, 2.5μL injections of solvents equally or more polar than THF could be used without negative effect on the chromatographic performance under the used conditions.
Overall, THF represented a good alternative to CHCl3/MeOH (30:70, v/v) since it provided high and
reproducible extraction yields, best maintained the redox state of PQ-9 and UQ-9, and was chromatogra-phically compatible. It was thus selected as the solvent of choice for the extraction of biological samples. To determine whether the volume of extraction solvent (500μL THF for 100 mg of fresh leaf material) was suf-ficient for extracting most of the prenylquinones, we extracted leaves exposed to HL in 1500 μL or 500 μL (for the latter, the extract was further diluted three times) and extraction yields were compared (n = 3). No significant difference was found, confirming that a volume of 500μL is sufficient for the extraction of 100 mg of fresh leaves. We noticed that the oxidation of PQH2 became significant about 2 and 5 hours after
extraction for plants grown under normal and high light conditions respectively. For this reason, we took good
care to always prepare and analyze samples within a maximum period of 1.5 hours. Given the speed of both extraction and analysis, 12 samples can be processed during that period of time. By performing sample pre-paration and analyses in parallel, a throughput of 100 samples in 8 h could be potentially achieved.
Extraction recovery, matrix effects and limits of quantification
To evaluate sample preparation recovery, two experi-ments were carried out: first pure standards of a-T, K, PC and PQ were submitted to the extraction procedure. Recovery greater than 95% was obtained for all mole-cules. To determine if the plant matrix had an impact on the recovery, decyl-plastoquinone was used as non-endogenous structural analogue and spiked before and after extraction of plant samples at identical concentra-tion. Again a recovery greater than 95% was obtained.
APCI is usually less prone to matrix effects than elec-trospray because ionization occurs in the gas phase. We nevertheless checked if prenyllipids were subjected to suppression or enhancement effects from the Arabidop-sis extract. Since these molecules are endogenous in Arabidopsis, a THF extract was prepared and an aliquot was spiked with standard solutions of each prenyllipid. The control extract (C), the standard solutions (SS) and the spiked extract (SE) were injected and the obtained
-1.0 -0.8 -0.6 -0.4 -0.2 0.0 0.2 0.4 0.6 0.8 1.0 -1.0 -0.8 -0.6 -0.4 -0.2 0.0 0.2 0.4 0.6 0.8 1.0 PC1 (52%) PC2 (20%) Ȗ-T PQ PQH2 PC K UQ UQH2 Į-TQ Į-T PC-OH PQ-OH EtAc IPA MeOH CHCl3/MeOH THF
Figure 3 Bi-plot derived from a principal component analysis (PCA) showing the selectivity of the extraction solvent. Plants exposed to high light were pooled and extracted using the indicated solvents. Colored squares correspond to the observations (n = 4 for each solvent) and black triangles represent the variables. PC1 and PC2 are first and second principal components, respectively, with their percentage of explained variance. The identified prenyllipids are indicated (confront with Table 1). For abbreviations, see text.
0 50 75 25 100 THF EtAc MeOH CHCl MeOH3 IPA 0 50 75 25 100 THF EtAc MeOH CHCl MeOH3 IPA 0 50 75 25 100 THF EtAc MeOH CHCl MeOH3 IPA 0 50 75 25 100 THF EtAc MeOH CHCl MeOH3 IPA 0 50 75 25 100 THF EtAc MeOH CHCl MeOH3 IPA 0 50 75 25 100 THF EtAc MeOH CHCl MeOH3 IPA
A
B
C
D
E
F
R elat ive abundan ce R elat ive abundan ce R elat ive abundan ce R elat ive abundan ce R elat ive abundan ce R elat ive abundan ce PQ PQH2 UQ UQH2Figure 4 Comparison of the extraction yields for prenylquinones with the five selected solvents. A.g-tocopherol. B. a-tocopherol. C. Phylloquinone. D. Plastoquinone-9, oxidized (PQ) and reduced (PQH2) forms. E. Plastochromanol-8. F. Ubiquinone-9, oxidized (UQ) and reduced
(UQH2) forms. Plants exposed to high light were pooled and lipids were extracted using the indicated solvents. Data are from 4 replicates (± SD).
area compared. For all the ions, the area of C+SS were equivalent to those of SE with a variation inferior to 5%. In other words, no significant matrix effect was observed for the analyzed compounds.
The quantification of prenyllipids was based on inter-nal standard calibration. Decyl-plastoquinone was found suitable as an internal standard: it was structurally close to the studied prenylquinones, was readily detected in negative APCI with high selectivity (M- ion at m/z 276.2087), eluted within the chromatographic gradient (retention time 0.44 min), and no matrix effect was observed. For a-T, PQ and PC-8, five calibrations points were used (0.05, 0.2, 1.0, 2.0, and 10.0 μg/mL for a-T; 0.05, 0.2, 1.0, 2.0, and 5.0μg/mL for PQ-9 and PC-8). When PQ was completely reduced using sodium boro-hydride, the peak corresponding to PQH2 had an
identi-cal area to that of PQ. As a result, PQH2 could be
quantified based on PQ calibration curve. For K, whose concentration does not significantly change after HL
treatment, only four calibration points were used (0.1, 0.25, 1.0, and 2.5 μg/mL). For all compounds the response was linear over the range of the chosen con-centrations with coefficients of determination > 0.99. A signal-to-noise ratio (s/n) of 10 was defined as limit of quantification (LOQ). For a-T, K and PC-8, the LOQ was 20 ng/mL. For PQ-9, an LOQ of 10 ng/mL was attained. The other identified prenyllipids (see Table 1) for which no pure standard was available were relatively quantified.
Effect of high light on prenylquinone profile
HL exposure induces biochemical and physiological changes in plants. In order to provoke a strong effect on prenyllipid content, 4 to 5-week-old Arabidopsis thali-ana (Columbia-0) plants were exposed to continuous HL intensity for a prolonged period of time (7 days) and their prenyllipid profiles were compared to those obtained from plants grown under normal light. Under
% 100 1.50 2.00 2.50 3.00 Time % 100 1.50 2.00 2.50 3.00 Time % 100 1.50 2.00 2.50 3.00 Time % 100 1.50 2.00 2.50 3.00 Time % 100 1.50 2.00 2.50 3.00 Time PQH2 PQ PQH2 PQH2 PQH2 PQ PQ PQ PQ PQH2 PC-8 PC-8 PC-8 PC-8 PC-8
A
B
C
D
E
% 100 1.00 1.50 2.00 2.50 3.00 Time % 100 1.00 1.50 2.00 2.50 3.00 Time % 100 1.00 1.50 2.00 2.50 3.00 Time % 100 1.00 1.50 2.00 2.50 3.00 Time % 100 1.00 1.50 2.00 2.50 3.00 Time K PQH2 PQH2 PQH2 PQH2 PQ PQ PQ PQ K K K D-T D-T D-TD
-T K PQ PC-8 PC-8 PC-8 PC-8 PC-8 PQH2 Ȗ-T D-T Ȗ-T Ȗ-T Ȗ-T Ȗ-TFigure 5 Extracted ion chromatograms illustrating the influence of the five extraction solvents on the chromatographic performance. A. MeOH 100%. B. CHCl3/MeOH (30:70, v/v). C. IPA. D. THF. E. EtAc. Plants exposed to high light were pooled and extracted using the indicated
solvents. 5μL was injected. Inset on the right: zoom on the peaks corresponding to PQ/PQH2and PC-8.g-T, g-tocopherol; a-T, a-tocopherol; K,
0 50 75 25 100 150 E·m ·sP – 2 – 1 500 E·m ·sP – 2 – 1 25 20 15 10 5 0 150 E·m ·sP – 2 – 1 500 E·m ·sP – 2 – 1 0 50 75 25 100 150 E·m ·sP – 2 – 1 500 E·m ·sP – 2 – 1 40 30 20 10 50 0 150 E·m ·sP – 2 – 1 500 E·m ·sP – 2 – 1 5.0 4.0 3.0 1.0 6.0 7.0 2.0 8.0 0.0 150 E·m ·sP – 2 – 1 500 E·m ·sP – 2 – 1 2.0 1.5 1.0 0.5 2.5 0 150 E·m ·sP – 2 – 1 500 E·m ·sP – 2 – 1
A
UQ UQH2B
C
D
E
F
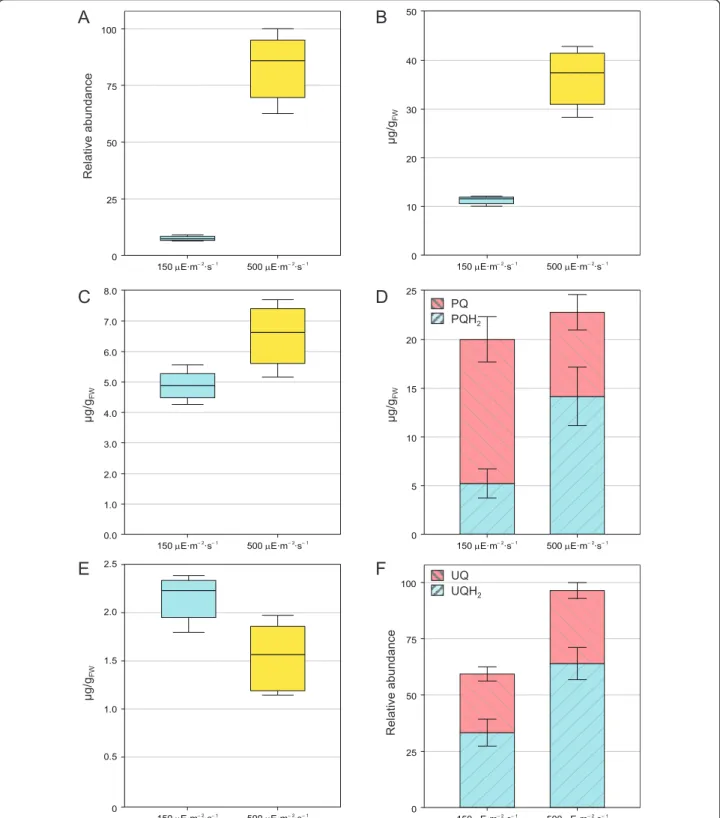
R elat ive abundan ce ȝ g/g FW ȝ g/g FW ȝ g/g FW R elat ive abundan ce ȝ g/g FW PQ PQH2Figure 6 Effect of HL exposure on the total leaf content of prenylquinones. A.g-tocopherol. B. a-tocopherol. C. Phylloquinone. D. Plastoquinone-9, oxidized (PQ) and reduced (PQH2) forms. E. Plastochromanol-8. F. Ubiquinone-9, oxidized (UQ) and reduced (UQH2) forms.
Plants exposed to normal (150μE × m-2× s-1) or high (500μE × m-2× s-1) light intensities were extracted using THF. Data are from 4 biological replicates (± SD). For PQ-9 (D) and UQ-9 (F) the redox state of the total leaf pool was taken into account.
HL conditions g- and a-tocopherol levels increased 8-fold and 3.5-8-fold respectively (Figure 6A and 6B). The synthesis of tocopherols and their accumulation in thy-lakoid membranes and plastoglobules is a well-known phenomenon which has been demonstrated to occur in response to oxidative stress [4,5]. After exposure to HL conditions plants produce more a-tocopherol, which mitigates photosystem II photoinactivation and protects thylakoids from photooxidative damage under chilling conditions [6,23]. No significant variation in phylloqui-none levels was observed under HL (Figure 6C). As a matter of fact, even though its absence in plants lacking key enzymes in vitamin K biosynthetic pathway affects photosystem I activity [9], no direct evidence of its accu-mulation under HL has been reported [4]. In the future, we will apply this new method to profile simultaneously several tocochromanols/prenylquinones and assess the roles of each of them under various conditions.
Concerning plastoquinone-9, 4-week-old A. thaliana plants grown under normal light conditions showed a PQH2/PQTOTratio of about 0.25, in agreement with a
previous study by Szymanska et al. [24] that used plants of similar age and a different method for prenyllipids extraction. After continuous HL exposure, plastoqui-none-9 total content (oxidized + reduced) did not seem to be significantly altered. Yet, the redox state of the electron acceptor pool changed, with a significant accu-mulation of the reduced form (PQH2), leading to a
PQH2/PQTOTratio of 0.6 (Figure 6D). This result
sug-gests that the accumulation of PQH2under HL may not
be due to the de novo synthesis of the latter but on the reduction of the already available PQ pool. While these findings are distinct from the increase in PQH2
synth-esis reported by Szymanska et al. [24], this discrepancy may well be attributed to the different growth and light conditions or to the different reference units employed (μg/g fresh weight versus μg/mg chlorophyll).
Among the other prenyllipids identified, plastochro-manol-8 levels did not significantly change when plants were exposed to HL (Figure 6E), while total ubiquinone-9 content increased about 1.5-fold. Moreover, the UQH2/UQTOTratio increased in response to the change
in light conditions (Figure 6F), as previously observed by Yoshida et al. [14].
Conclusion
The presented method introduces for the first time the use of UHPLC-APCI-QTOFMS for simultaneously pro-filing several prenylquinones in plants. It proves to be fast, reliable, very selective and sensitive for the analyzed molecules, and consume less solvent than conventional methods. By combining it with simple and rapid sample preparation, a single plant can be extracted and analyzed in less than 15 min and twelve samples can be
processed in 90 min. Moreover it allows for the detec-tion and tentative identificadetec-tion of molecules for which no pure standard is available. The developed method will be used to profile prenylquinones in various Arabi-dopsis mutants as well as in other commercially relevant crop species.
Methods
Chemicals
The solvents used for extraction were methanol (MeOH, HPLC grade, Chromanorm), chloroform (CHCl3,
analy-tical grade, Normapur) and tetrahydrofuran (THF, ana-lytical grade, Normapur) from VWR (Leuven, Belgium), isopropanol (IPA, HPLC grade) and ethylacetate (EtAc, analytical grade) from Acros Organics (Geel, Belgium). ULC/MS grade MeOH and water from Biosolve (Valk-enswaard, The Netherlands) were used for the UHPLC-APCI-QTOFMS analyses.
a-T and K standards of HPLC grade (≥ 99.5%) were purchased from Sigma-Aldrich (Steinheim, Germany). Decyl-plastoquinone (~75%) was obtained from Sigma-Aldrich. PQ-9 and PC-8 standards were provided by Jerzy Kruk (Jagiellonian University, Kraków, Poland). The oxidized and reduced PQ-9 standards were obtained as described in [25] with slight changes. Briefly, an excess (1μg) of sodium borohydride (Fluka, Buchs, Switzerland) was added to the oxidized PQ standard (100 ng) to completely reduce it to PQH2. The retention
time of both forms was then determined by UHPLC-APCI-QTOFMS. Ascorbic acid was purchased from Carl Roth (Karlsruhe, Germany) and butyl hydroxyto-luene (BHT) from Sigma-Aldrich.
Plant material and treatments
Arabidopsis thaliana (Columbia-0) plants were grown on soil under standard growth conditions (150 μE·m-2·s
-1
, 8/16 h light/dark period, 21/18°C, 55% relative air humidity) according to the protocol described in [26] with slight modifications. HL treatment was performed on 4- to 5-week-old rosettes by exposure to continuous HL conditions (500 μE·m-2·s-1, 21°C, 55% relative air humidity) for 1 week in a PGC 6HID growth chamber (Percival Scientific, Boone, IA) equipped with 400 W metal halide lamps (Philips).
Prenyllipid extraction
Arabidopsis leaves from 4- to 5-week-old rosettes were ground in a mortar with liquid nitrogen. Approximately 100 mg of leaf material was then exactly weighed, trans-ferred to a 1.5 mL microcentrifuge tube (Eppendorf, Hamburg, Germany) and swiftly re-suspended in five volumes of the selected solvent (e.g. 500μL for 100 mg) containing decylplastoquinone at 2μg/mL as internal standard. Care was taken that no thawing occurred
before the solvent was added. Glass beads of about 1 mm of diameter (Assistent, Sontheim, Germany) were added and samples were further homogenized for 3 min at 30 Hz in a tissue lyser (Retsch MM 300, Haan, Ger-many). Tubes were centrifuged on a benchtop centrifuge (14,000 × g for 3 min at 4°C) and 400 μL of supernatant was then transferred to an appropriate glass vial for immediate UHPLC-QTOFMS analysis.
Liquid chromatography-mass spectrometry analysis The LC-MS system consisted of a Waters Acquity UPLC™ (Milford, MA) coupled to a Waters Synapt G2 MS QTOF equipped with an atmospheric pressure che-mical ionization (APCI) source. Prenyllipids were sepa-rated on an Acquity BEH C18 column (50 × 2.1 mm, 1.7 μm) under the following conditions: Solvent A = water; Solvent B = MeOH; 90-100% B in 1.5 min, 100% B for 2.5 min, re-equilibration at 90% B for 0.5 min. The flow rate was 800μL/min and the injection volume was 2.5μL. The temperature of the column was set to 60°C and the autosampler chamber was kept at 15°C. Data were acquired with a scan time of 0.4 s over an m/ z range of 225-1200 in the negative ion MS mode. The corona current was set to 18μA and the cone voltage to 40 V. The source temperature was maintained at 120°C and the APCI probe temperature at 475°C. The desolvation gas flow was set to 800 L/hr. The mobile phase was diverted to waste for 0.3 min at the beginning of the gradient. Accurate mass measurements were obtained by infusing a 400 ng/mL solution of the small peptide leucin-enkephalin at a flow rate of 10μL/min through the Lock Spray™ probe. For the identification of prenyllipids, positive and negative ion MS/MS experi-ments were carried out using a fixed collision energy of 40 eV and argon as collision gas at a flow of 2.1 mL/ min. The quadrupole LM resolution was 4.7, and the HM resolution was 15. MS/MS product ion spectra were acquired over the m/z range 50-1200. Absolute quantities of prenyllipids were determined using stan-dard curves obtained from stanstan-dard compounds. The concentrations of the calibration points for a-T were 0.05, 0.2, 1.0, 2.0, and 10.0μg/mL, for PQ-9 and PC-8 0.05, 0.2, 1.0, 2.0, and 5.0μg/mL. For K, the concentra-tions were 0.1, 0.25, 1.0, and 2.5 μg/mL. All standard solutions contained decylplastoquinone (internal stan-dard) at a concentration of 2μg/mL.
Data treatment
Data were processed using Masslynx v4.1 (Waters). Multivariate analysis was carried out using MarkerLynx XS™ (Waters). The following parameters were used: initial and final retention times 0.7-3.0 min, mass range m/z 225-1200 Da, mass tolerance 0.03 Da, retention time window 0.10 min, automatic peak width detection,
intensity threshold 1000 counts. The deisotope filtering function was applied. Non-normalized peak areas were generated. Variables were UV-scaled before applying PCA.
Acknowledgements
We thank Jerzy Kruk for kindly providing purified plastoquinone-9 and plastochromanol-8 standards. GG acknowledges support from the Swiss Plant Science Web. FK was supported by UniNE, SystemsX PGCE, NCCR Plant Survival and SNF 31003A_127380.
Author details
1Laboratory of Plant Physiology, University of Neuchâtel, 2000 Neuchâtel,
Switzerland.2Chemical Analytical Service of the Swiss Plant Science Web,
University of Neuchâtel, 2000 Neuchâtel, Switzerland. Authors’ contributions
JM grew, collected, and extracted plants. GG developed the UHPLC-APCI-QTOFMS method and conducted measurements. JM and GG carried out the optimization of the sample preparation, performed data analysis and treatment. GG and JM wrote the manuscript. FK contributed to the writing of the manuscript. All authors conceived the study. All authors read, commented and approved the final manuscript.
Competing interests
The authors declare that they have no competing interests.
References
1. Nowicka B, Kruk J: Occurrence, biosynthesis and function of isoprenoid quinones. BBA-Bioenergetics 2010, 1797:1587-1605.
2. Mene-Saffrane L, Jones AD, DellaPenna D: Plastochromanol-8 and tocopherols are essential lipid-soluble antioxidants during seed desiccation and quiescence in Arabidopsis. P Natl Acad Sci USA 2010, 107:17815-17820.
3. Kobayashi N, DellaPenna D: Tocopherol metabolism, oxidation and recycling under high light stress in Arabidopsis. Plant J 2008, 55:607-618. 4. Lichtenthaler HK: Biosynthesis, accumulation and emission of
carotenoids, alpha-tocopherol, plastoquinone, and isoprene in leaves under high photosynthetic irradiance. Photosynth Res 2007, 92:163-179. 5. Krieger-Liszkay A, Trebst A: Tocopherol is the scavenger of singlet oxygen
produced by the triplet states of chlorophyll in the PSII reaction centre. J Exp Bot 2006, 57:1677-1684.
6. Havaux M, Eymery F, Porfirova S, Rey P, Dormann P: Vitamin E protects against photoinhibition and photooxidative stress in Arabidopsis thaliana. Plant Cell 2005, 17:3451-3469.
7. Kruk J, Trebst A: Plastoquinol as a singlet oxygen scavenger in photosystem II. BBA-Bioenergetics 2008, 1777:154-162.
8. Szymanska R, Kruk J: Identification of hydroxy-plastochromanol in Arabidopsis leaves. Acta Biochim Pol 2010, 57:105-108.
9. Lohmann A, Schottler MA, Brehelin C, Kessler F, Bock R, Cahoon EB, Dormann P: Deficiency in phylloquinone (vitamin K-1) methylation affects prenyl quinone distribution, photosystem I abundance, and anthocyanin accumulation in the Arabidopsis AtmenG mutant. J Biol Chem 2006, 281:40461-40472.
10. Shimada H, Ohno R, Shibata M, Ikegami I, Onai K, Ohto M, Takamiya K: Inactivation and deficiency of core proteins of photosystems I and II caused by genetical phylloquinone and plastoquinone deficiency but retained lamellar structure in a T-DNA mutant of Arabidopsis. Plant J 2005, 41:627-637.
11. Johnson TW, Shen GZ, Zybailov B, Kolling D, Reategui R, Beauparlant S, Vassiliev IR, Bryant DA, Jones AD, Golbeck JH, Chitnis PR: Recruitment of a foreign quinone into the A(1) site of photosystem I - I. Genetic and physiological characterization of phylloquinone biosynthetic pathway mutants in Synechocystis sp PCC 6803. J Biol Chem 2000, 275:8523-8530. 12. Zbierzak AM, Kanwischer M, Wille C, Vidi PA, Giavalisco P, Lohmann A,
tocopherol and plastoquinol metabolic pathways at the plastoglobule. Biochem J 2010, 425:389-399.
13. Kruk J, Karpinski S: An HPLC-based method of estimation of the total redox state of plastoquinone in chloroplasts, the size of the photochemically active plastoquinone-pool and its redox state in thylakoids of Arabidopsis. BBA-Bioenergetics 2006, 1757:1669-1675. 14. Yoshida K, Shibata M, Terashima I, Noguchi K: Simultaneous determination
of in vivo plastoquinone and ubiquinone redox states by HPLC-based analysis. Plant Cell Physiol 2010, 51:836-841.
15. Byrdwell WC: Atmospheric pressure chemical ionization mass spectrometry for analysis of lipids. Lipids 2001, 36:327-346.
16. Swartz ME: UPLC (TM): An introduction and review. J Liq Chromatogr Relat Technol 2005, 28:1253-1263.
17. Nguyen DTT, Guillarme D, Rudaz S, Veuthey JL: Fast analysis in liquid chromatography using small particle size and high pressure. J Sep Sci 2006, 29:1836-1848.
18. Plumb R, Castro-Perez J, Granger J, Beattie I, Joncour K, Wright A: Ultra-performance liquid chromatography coupled to quadrupole-orthogonal time-of-flight mass spectrometry. Rapid Commun Mass Sp 2004, 18:2331-2337.
19. Lauridsen C, Leonard SW, Griffin DA, Liebler DC, McClure TD, Traber MG: Quantitative analysis by liquid chromatography tandem mass spectrometry of deuterium-labeled and unlabeled vitamin E in biological samples. Anal Biochem 2001, 289:89-95.
20. Lanina SA, Toledo P, Sampels S, Kamal-Eldin A, Jastrebova JA: Comparison of reversed-phase liquid chromatography-mass spectrometry with electrospray and atmospheric pressure chemical ionization for analysis of dietary tocopherols. J Chromatogr A 2007, 1157:159-170.
21. Kurilich AC, Britz SJ, Clevidence BA, Novotny JA: Isotopic labeling and LC-APCI-MS quantification for investigating absorption of carotenoids and phylloquinone from kale (Brassica oleracea). J Agric Food Chem 2003, 51:4877-4883.
22. Suhara Y, Kamao M, Tsugawa N, Okano T: Method for the determination of vitamin K homologues in human plasma using high-performance liquid chromatography-tandem mass spectrometry. Anal Chem 2005, 77:757-763.
23. Maeda H, Song W, Sage TL, DellaPenna D: Tocopherols play a crucial role in low-temperature adaptation and phloem loading in Arabidopsis. Plant Cell 2006, 18:2710-2732.
24. Szymanska R, Kruk J: Plastoquinol is the main prenyllipid synthesized during acclimation to high light conditions in Arabidopsis and is converted to plastochromanol by tocopherol cyclase. Plant Cell Physiol 2010, 51:537-545.
25. Kruk J: Charge-transfer complexes of plastoquinone and alpha-tocopherol quinone in vitro. Biophys Chem 1988, 30:143-149.
26. Hiltbrunner A, Bauer J, Alvarez-Huerta M, Kessler F: Protein translocon at the Arabidopsis outer chloroplast membrane. Biochem Cell Biol 2001, 79:629-635.