HAL Id: hal-00687810
https://hal.archives-ouvertes.fr/hal-00687810
Submitted on 15 Apr 2012
HAL is a multi-disciplinary open access archive for the deposit and dissemination of sci-entific research documents, whether they are pub-lished or not. The documents may come from teaching and research institutions in France or abroad, or from public or private research centers.
L’archive ouverte pluridisciplinaire HAL, est destinée au dépôt et à la diffusion de documents scientifiques de niveau recherche, publiés ou non, émanant des établissements d’enseignement et de recherche français ou étrangers, des laboratoires publics ou privés.
GDP and the Value of Family Caretaking: How Much
Does Europe Care?
Gianna Claudia Giannelli, Lucia Mangiavacchi, Luca Piccoli
To cite this version:
Gianna Claudia Giannelli, Lucia Mangiavacchi, Luca Piccoli. GDP and the Value of Family Caretak-ing: How Much Does Europe Care?. Applied Economics, Taylor & Francis (Routledge), 2011, pp.1. �10.1080/00036846.2011.558485�. �hal-00687810�
For Peer Review
GDP and the Value of Family Caretaking: How Much Does Europe Care?
Journal: Applied Economics Manuscript ID: APE-2010-0307.R1 Journal Selection: Applied Economics Date Submitted by the
Author: 20-Jan-2011
Complete List of Authors: Giannelli, Gianna Claudia; University of Florence, Department of Economics
Mangiavacchi, Lucia; University of the Balearic Islands, Department of Applied Economics; Paris School of Economics, Microsimulation and Public Policies Analysis Unit
Piccoli, Luca; University of Balearic Islands, Department of Applied Economics; Paris School of Economics, Microsimulation and Public Policies Analysis Unit
JEL Code:
D19 - Other < D1 - Household Behavior and Family Economics < D - Microeconomics, J16 - Economics of Gender < J1 - Demographic Economics < J - Labor and Demographic Economics, R20 - General < R2 - Household Analysis < R - Urban, Rural, and Regional Economics, J22 - Time Allocation and Labor Supply < J2 - Time Allocation, Work Behavior, and Employment Determination/Creation < J - Labor and Demographic Economics
Keywords: Unpaid Domestic Work, Family Care Work , Gender Inequality, Opportunity Cost, Market Replacement Approach
For Peer Review
Page 1 of 51 Submitted Manuscript
1 2 3 4 5 6 7 8 9 10 11 12 13 14 15 16 17 18 19 20 21 22 23 24 25 26 27 28 29 30 31 32 33 34 35 36 37 38 39 40 41 42 43 44 45 46 47 48 49 50 51 52 53 54 55 56 57 58
For Peer Review
GDP and the Value of Family Caretaking:
How Much Does Europe Care?
Gianna C. Giannelli
a, Lucia Mangiavacchi
band Luca Piccoli
ba
Department of Economics, University of Florence, Via delle Pandette 9, 50127, Firenze, Italy.
b
Department of Applied Economics, University of Balearic Islands, Cra. de Valldemossa km 7.5, 07122, Palma de Mallorca, Spain.
Running title:
GDP and the Value of Family Caretaking: How Much Does Europe Care?
1 2 3 4 5 6 7 8 9 10 11 12 13 14 15 16 17 18 19 20 21 22 23 24 25 26 27 28 29 30 31 32 33 34 35 36 37 38 39 40 41 42 43 44 45 46 47 48 49 50 51 52 53 54 55 56 57 58
For Peer Review
GDP and the Value of Family Caretaking:
How Much Does Europe Care?
Running title:
GDP and the Value of Family Caretaking: How Much Does Europe Care?
Abstract
This study estimates the size and value of unpaid family caretaking activities at a European level. While at a country level several studies are available, a comprehensive evaluation for Europe as a whole was missing so far, mainly due to data limitations. This paper fills this gap using a method that merges the information of an EU household survey (EU-SILC) with a time use survey (HETUS). Monetary values of unpaid family domestic work and unpaid family childcare work are obtained applying both the opportunity cost and the market replacement approaches. For Europe as a whole, the total value of these activities ranges between 17 per cent and 31.6 per cent of the EU GDP, depending on the applied methodology. The national values of these activities are discussed and an interpretation of the country and gender differentials in family caretaking costs is given in terms of differences in culture, economic development and welfare state.
Corresponding author: ???
Page 3 of 51 Submitted Manuscript
1 2 3 4 5 6 7 8 9 10 11 12 13 14 15 16 17 18 19 20 21 22 23 24 25 26 27 28 29 30 31 32 33 34 35 36 37 38 39 40 41 42 43 44 45 46 47 48 49 50 51 52 53 54 55 56 57 58
For Peer Review
I. IntroductionUnpaid family caretaking encompasses domestic work and care provided by mem-bers of a household to other memmem-bers. This work is similar to that supplied in paid domestic and care occupations, such as those related to the provision of domestic services, childcare, nursing, and care of the elderly, which often are among the lowest paid occupations in the labour market. The majority of unpaid family workers are women, and the recipients of domestic and care services are other members of the household, in particular children, the elderly, and disabled members. Many individ-uals spend a relevant share of their time in performing these activities, sometimes for their own choice, some other because they cannot afford to buy similar services in the market, or because these services are rationed or not adequately provided by the State. Hence, it is important to have a quantitative representation of the time spent in family caretaking relative to all other activities performed in a society, and to attribute monetary values to them.
The main purpose of this paper is to devise an estimation method yielding a monetary value of unpaid family work in the EU suitable for comparisons with the value of work performed in market activities. The results are then used for addressing the policy question whether the best strategy for supplying family services is through the market, or through the State, or through the family itself by means of an adequate public support, or through an optimal mixture of all these policies. In fact, in a cost-benefit analysis, the value of unpaid family care may be viewed as a cost not only for the family, but also for the society, when household members performing unpaid work could generate, with the same amount of work, a higher value added in the market. In this case, State intervention with public services or subsidies might be more efficient. For example, the finding that the opportunity cost of family care is higher than its market value - obtained multiplying the market price of care activities by the time spent in performing them - might indicate that the public provision of care services is rationed and that a larger share of them
1 2 3 4 5 6 7 8 9 10 11 12 13 14 15 16 17 18 19 20 21 22 23 24 25 26 27 28 29 30 31 32 33 34 35 36 37 38 39 40 41 42 43 44 45 46 47 48 49 50 51 52 53 54 55 56 57 58
For Peer Review
should be provided by the State. With sufficiently detailed data, estimates of the value of specific family based care activities that could be in part either subsidized or supplied by the State at possibly lower costs for the society may be derived.
As for the role of gender and culture in the distribution of these activities within the society, knowing the value of unpaid family caretaking is particularly important to understand the real contribution of women to the national product and the di-mension of gender gaps, since this type of work is still predominantly provided by women. These issues are explicitly discussed, although the labour market implica-tions behind them, that would also involve an examination of participation rates, are not the main focus of the analysis.
While at a country level several studies on the distribution of time among all types of activities are available, only a few try to assess the value of unpaid family caretaking. The evaluation of unpaid family work, in fact, requires detailed infor-mation on the use of time and on the value of market work which is used to impute a value to household work. Any research on this topic faces two problems: i) such information, when available, is normally contained in different surveys for different years, and ii) it is often difficult to compare it across countries. As to the latter, recently EUROSTAT has made an important effort for harmonizing time use sur-veys (the Harmonised European Time Use Survey, HETUS) and income sursur-veys (the European Survey of Income and Living Conditions, EU-SILC).
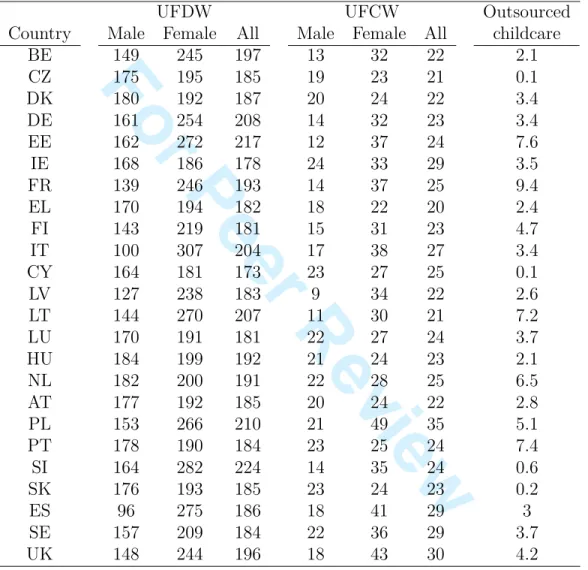
This paper addresses for the first time the issue of measurement of unpaid fam-ily caretaking at the EU level, exploiting these harmonised data to combine the information on time use with the information on the values of hours of work in different occupations in the market (wages). The focus is on two components of un-paid family caretaking work, namely, unun-paid family domestic work (UFDW), which encompasses household production activities not involving personal caring of other household members, and unpaid family childcare work (UFCW), which encompasses activities related to personal care of children. Family care of the elderly is left out of the analysis because of the lack of harmonised data on this aspect. The analysis
Page 5 of 51 Submitted Manuscript
1 2 3 4 5 6 7 8 9 10 11 12 13 14 15 16 17 18 19 20 21 22 23 24 25 26 27 28 29 30 31 32 33 34 35 36 37 38 39 40 41 42 43 44 45 46 47 48 49 50 51 52 53 54 55 56 57 58
For Peer Review
yields several results. First, it allows estimating the overall value of unpaid house-hold work at the EU level and for each EU member state, so that its importance relatively to the GDP can be appreciated. Second, it allows estimating the cost for the society in terms of the difference between the opportunity cost and the market value of unpaid work. Third, it allows investigating the gender differences in the size and value of this work both at the EU and national levels. Fourth, it allows to group countries in clusters that show a similar attitude towards the role of domestic pro-duction of goods and services for people’s well being and to interpret the observed differences between countries in terms of cultural traditions, economic development and welfare state regimes.
The paper is organized as follows. Section II reviews the literature on unpaid fam-ily caretaking activities and on the related policies in Europe. Section III describes the data, the matching of HETUS and EU-SILC and deals with the estimation of the hourly wages used to compute the values of UFDW and UFCW. Section IV presents the results for the EU as a whole, a comparative analysis of the of the values of UFDW and UFCW in each country, a comparative analysis of the dif-ferences between the opportunity and market replacement costs, and offers some interpretations. Section V concludes.
II. Family caretaking and related policies in Europe
Several strands of research on unpaid household work relate to its integration in the national accounts and to its connection with labour market participation and gender differentials. As a result, following the contribution of many scholars1 started with
the pioneering works of Margaret Reid (1934) and Becker (1965), unpaid domestic
1
Several works are based on the experiences of individual researchers, as Gronau (1973), Nordhaus and Tobin (1973), Kendrick (1979), Eisner et al. (1982), Ironmonger (1994), Goldschmidt-Clermont and Pagnossin-Aligisakis (1999), and others by initiatives of several international institutions, as ILO (1995, 1996); OECD (1992, 1999); Swiebel (1999); EUROSTAT (2000, 2003); Trewin (2000); Holloway et al. (2002).
1 2 3 4 5 6 7 8 9 10 11 12 13 14 15 16 17 18 19 20 21 22 23 24 25 26 27 28 29 30 31 32 33 34 35 36 37 38 39 40 41 42 43 44 45 46 47 48 49 50 51 52 53 54 55 56 57 58
For Peer Review
and care work have been integrated into System of National Accounts with the so called Satellite Accounts2.
A great deal of concordant evidence is available on the relationship between do-mestic, family care and market work. Davis and Greenstein (2004) and Breen and Cooke (2005), using data for several European and non-European countries, find significant national differences in the division of domestic work. In nations where women are more employed in the market, their partners are more likely to perform at least half of the household work. Voicu et al. (2007), Anxo et al. (2007) and Solera (2008) find various patterns across Europe: in the Nordic countries, couples spend a relatively restricted amount of time on housework, sharing it quite equally; in the Southern countries3, as well as in Ireland and the United Kingdom4, women daily
spend plenty of time on domestic chores, while men tend to avoid such activities; in most of the ex-communist countries, both spouses spend many hours, daily, on housework; in Western-Central Europe, the daily housework load is higher than in Scandinavia but lower than in the Eastern and Southern countries. Overall, it seems that the division of domestic labour does not change much over time.
There are several models of caretaking in Europe. As far as family childcare is concerned, its negative nexus with female participation in the labour market is documented at all level of analysis. Powell (1998), Del Boca et al. (2008) and Lewis et al. (2008), for example, exploring the impact of social policies and labour market characteristics on women’s decisions regarding work and childbearing, find that a non-negligible portion of the differences in participation across European countries can be attributed to institutions such as formal childcare, parental leave arrangements, family allowances, and part-time opportunities. A common finding
2
In the national economic accounts, the economic activities are categorized as (i) System of Na-tional Accounts (SNA) production activities; (ii) non-SNA production activities (food prepa-ration, childcare, adult care, making and care of textiles, upkeep of dwelling and surroundings, repairs and maintenance of dwelling and of household equipment, household management and shopping, gardening and pet care) and unpaid work for the community; (iii) non-economic activities, sometimes called personal activities (physiological and recreational activities and self-education).
3
See also Iazaro et al. (2004) for an analysis of unpaid caring work in Spain, and Alesina and Ichino (2010) for Italy.
4
See Prodromos-Ioannis (2005) for an analysis on the use of time of British women.
Page 7 of 51 Submitted Manuscript
1 2 3 4 5 6 7 8 9 10 11 12 13 14 15 16 17 18 19 20 21 22 23 24 25 26 27 28 29 30 31 32 33 34 35 36 37 38 39 40 41 42 43 44 45 46 47 48 49 50 51 52 53 54 55 56 57 58
For Peer Review
is that there is very little evidence of convergence towards a dual, full-time worker model of the family outside the Nordic countries, although the balance between the hours which men and women spend in paid work is becoming less unequal.
In fact, countries vary enormously in terms of the composition of the policy pack-ages adopted. The structure of formal and informal arrangements depends on pol-icy choices regarding the public and private provision of childcare services, parental leaves and family allowances. A few European countries - mainly Nordic - have for-mulated a social right to formal childcare services (see EGGE, 2009). In Denmark, for example, all municipalities have to guarantee childcare until the child is 6 month old5. The same applies to Finland, where this entitlement complements the home
care allowance system, which enables the parent to stay at home to care for his/her child with full job security until the child is 3 years old. Also in Sweden, the number of places available for pre-school children meets demand. In Belgium, France and Slovenia the level of provision is also relatively high, with policy focusing on full coverage. The United Kingdom, the Netherlands and Germany are clearly moving towards a more complete coverage of childcare services. The level of provision is also increasing in Luxembourg, Portugal, Italy and Spain, although at a somewhat more moderate pace. In other countries developments are extremely limited. This seems to be the case in Cyprus, Estonia, Ireland, Latvia and Malta. Finally, there is a group of countries that experienced a clear downward tendency with regard to childcare facilities during the 1990s, partly because of a lack of financial means (Hungary, Slovakia, the Czech Republic, Lithuania, Poland, Bulgaria and Romania). As for leave facilities and family allowances, France provides an example of the complex trade-offs within family policy. French families are entitled to parental leave of 36 months (including maternity leave). This leave period is paid at a rate of approximately 500 Euros per month for a second or subsequent child. More than half of the families, however, make use of childcare facilities after the end of
5
Since 2006 all municipalities had to offer a childcare guarantee untill the child is 6 month old. In fact in Denmark there is a tendency to see childcare as much as an offer to the children in their development as democratic citizens, as an offer to the parents to have their children cared for while they are working.
1 2 3 4 5 6 7 8 9 10 11 12 13 14 15 16 17 18 19 20 21 22 23 24 25 26 27 28 29 30 31 32 33 34 35 36 37 38 39 40 41 42 43 44 45 46 47 48 49 50 51 52 53 54 55 56 57 58
For Peer Review
maternity leave. In the absence of a sufficient number of childcare facilities, many of these families have to resort to solutions implying family care. In Germany, a new parental allowance act came into force in January 2007 whereby parents have the right to parental leave for a maximum of 3 years, the parental allowance is 67 per cent of the previous gross earnings for the parent on leave and is paid for 12 months. After the new regulation on parental allowances the demand for formal childcare has increased noticeably after one year of parental leave, as mothers return earlier to employment.
III. Empirical strategy
This section presents the empirical strategy applied to the two harmonized data sets matched for the analysis. This strategy involves some imputations and the choice of market values to be attributed to hours of caretaking work in line with the criteria derived from the accounting literature just reviewed.
Data and definitions
The problem of evaluating UFDW and UFCW is in large part a problem of missing data. EU-SILC 2006 is a European household survey for 24 EU member States plus Norway and Iceland, which are not included in this study, since the focus is on the EU. The data set is rich in information on several household and individual variables, such as work status and characteristics, income, taxes and benefits, family composi-tion, health and education. EU-SILC, however, does not collect information on the use of time, which is fundamental to properly estimate the values of UFDW and UFCW. On the other hand, the Harmonized European Time Use Survey6 (HETUS) by EUROSTAT does not contain information on wages and incomes, but, being a
6
HETUS is a collection of national time use surveys recorded in different years. Belgium (2005-6), Bulgaria (2001-2002), Estonia (1999-2000), Finland (1999-2000), France (1998-1999), Germany (2001-2002), Italy (2002-2003), Latvia (2003), Lithuania (2003), Norway (2000-2001), Poland (2003-2004), Slovenia (2000-2001), Spain (2002-2003), Sweden (2000-2001), the United King-dom (2000-2001). For this reason whenever a figure or a table is based on HETUS, the reference year is not reported. See http://www.tus.scb.se.
Page 9 of 51 Submitted Manuscript
1 2 3 4 5 6 7 8 9 10 11 12 13 14 15 16 17 18 19 20 21 22 23 24 25 26 27 28 29 30 31 32 33 34 35 36 37 38 39 40 41 42 43 44 45 46 47 48 49 50 51 52 53 54 55 56 57 58
For Peer Review
collection of harmonized time use surveys, it provides exactly the information which is missing in EU-SILC.
The EU-SILC variable that can be exploited to indirectly estimate the value of unpaid family work is weekly hours of market work. Non-market work time can be obtained subtracting market work time from daily total time. Clearly, this is not sufficient to determine the time spent in unpaid domestic or childcare work, since it includes also time spent in sleeping and leisure, which is usually much larger than time spent in domestic activities7. A value of unpaid family caretaking work
estimated using non-market work time only would largely overestimate its true value, whatever criterion is chosen. Hence, to avoid these overestimation issues, time-use data from HETUS are combined with EU-SILC micro data for 2006. In the present case, the only chance to perform a matching of time use information into EU-SILC was to generate a table of average time spent into daily activities by the individuals over some characteristics available in the web application of HETUS that were found to be the most useful to explain data variability8.
The strategy adopted to maintain the highest degree of individual detail in the data was the following:
i) Use market work time information present in EU-SILC (MWEU
i ) to compute
non-market work time (NMWEU
i ) for each person i in the sample
N M WiEU = TEU
i − M WiEU,
where TEU
i is total time available for each person i in EU-SILC;
ii) Calculate from HETUS - by country (g), gender (j) and a variable called
lifecycle (k), which combines age with the family status of the individual - the
7
According to HETUS data, the individual average time of market work and domestic work amount to around 200 minutes per day each (see Table 2), leisure amounts to 321 minutes per day and other activities, which include sleeping, amount to more than 700 minutes per day.
8
The choice of the technique to be applied is often related to the kind of information that is matched, but in the present case there was not a real option of choice. In fact, direct access to HETUS micro data was not allowed. The reason is that HETUS is a harmonized collection of independent national time-use surveys, and to have access to the whole dataset, single agreements with each statistical institute involved would have been needed. The only viable solution was to use the on-line application that can generate personalised tables of average times devoted to a broad range of activities.
1 2 3 4 5 6 7 8 9 10 11 12 13 14 15 16 17 18 19 20 21 22 23 24 25 26 27 28 29 30 31 32 33 34 35 36 37 38 39 40 41 42 43 44 45 46 47 48 49 50 51 52 53 54 55 56 57 58
For Peer Review
average shares (ω) of non-market work time spent in domestic work (DHET U S),
childcare work (CHET U S)9, leisure (LHET U S) and other activities (OHET U S):
ωDHET U Sg,j,k = D HET U S N M WHET U S ! g,j,k ωCHET U Sg,j,k = C HET U S N M WHET U S ! g,j,k ωLHET U Sg,j,k = L HET U S N M WHET U S ! g,j,k ωOHET U Sg,j,k = O HET U S N M WHET U S ! g,j,k ;
iii) Impute the non-market work time shares for the countries not present in HETUS. This imputation is a simple regression imputation, regressing the logarithm of the shares on a series of personal, household and environmental characteristics for the countries of HETUS, and predicting the shares for the countries not present in HETUS (ωDdEU
g,j,k, ωCdEUg,j,k, ωLdEUg,j,k and ωOdEUg,j,k)10;
iv) Use the observed and predicted shares for HETUS and non-HETUS countries respectively, and multiply them by the non-market work time of each individ-ual i with characteristics (g, j, k) in EU-SILC, obtaining for each person the time devoted to each activity:
c DiEU =ωDdEUg,j,k· N M Wi,EU(g,j,k) b CiEU =ωCdEUg,j,k· N M Wi,EU(g,j,k) b LEUi =ωLdEUg,j,k· N M Wi,EU(g,j,k) b OEUi =ωOdEUg,j,k· N M WiEU(g,j,k). 9
Domestic work and childcare work are the only two family caretaking activities that are ac-counted for in this analysis, since the HETUS source does not allow distinguishing care of the elderly from other activities.
10
More details about this step are presented in the Appendix.
Page 11 of 51 Submitted Manuscript
1 2 3 4 5 6 7 8 9 10 11 12 13 14 15 16 17 18 19 20 21 22 23 24 25 26 27 28 29 30 31 32 33 34 35 36 37 38 39 40 41 42 43 44 45 46 47 48 49 50 51 52 53 54 55 56 57 58
For Peer Review
The imputation of time-use shares to non-HETUS countries (step iii above) may seem rather arduous. Europe is composed by heterogeneous countries and trying to impute time use to a person using data from different countries is indeed a relevant approximation. However, there are several factors that act in favour of the proposed methodology. First, the aim of the analysis is to find aggregate European and na-tional amounts, not to conduct a microeconometric evaluation on the determinants of time use. If the imputation is good on average, this is sufficient to guarantee that the results are meaningful. Second, it should be noted that even though it is true that in Europe each country has its own peculiar characteristics, the ob-served variability in the shares of time spent in domestic and childcare activities is much smaller than, for example, the variability observed for earnings. Third, the imputation is conducted using as dependent variables several indicators of family composition, housing characteristics, household wealth and welfare state provision, ensuring that households in similar conditions have similar time-use values. Fourth, the choice of imputing the shares rather than time use values further reduces the magnitude of the imputation error because the time use values are recovered using non-labour time information, which is available for all individuals in all EU-SILC countries. This also allows capturing country specific fixed effects. Considering these points, it follows that the error due to the imputation can be reasonably assumed to be small, at least for an analysis conducted at the aggregate level.
Resuming, the evaluation strategy consists in assigning to each person observed in EU-SILC an imputed amount of time dedicated to UFDW and UFCW derived from HETUS. In what follows, indicators of the values of UFDW and UFCW based on the opportunity cost approach (Gronau, 1973) and on the market replacement approach (Goldschmidt-Clermont and Pagnossin-Aligisakis, 1999) are presented. It is to be noted that different estimated values can be obtained according to the technique used for evaluation. The results deriving from each technique provide a range within which it is reasonable to place the “true” values of UFDW and UFCW.
1 2 3 4 5 6 7 8 9 10 11 12 13 14 15 16 17 18 19 20 21 22 23 24 25 26 27 28 29 30 31 32 33 34 35 36 37 38 39 40 41 42 43 44 45 46 47 48 49 50 51 52 53 54 55 56 57 58
For Peer Review
Estimating wages
As already mentioned, the values of UFDW and UFCW are derived applying three methods: the opportunity cost (OC), the generalist market replacement (GMR) and the specialist market replacement (SMR).
Opportunity Cost. The OC approach relies on the assumption that each hour de-voted to domestic or caring activities could be productively employed in the labour market. As a consequence, hours should be evaluated at the hourly wage the indi-viduals would earn if they had spent this time in the labour market. This implicitly defines the set of individuals that should be taken into account, namely, potential workers (the unemployed persons and housewives in the present case) and actual workers. Instead, unpaid family work performed by people who are not even po-tentially part of the labour force and receive a compensation for their time - like pensioners or some categories of disabled people who receive pensions, transfers or subsidies - is not taken into account within this approach.
The evaluation of UFDW and UFCW for actual workers presents no particular difficulties, since wages are observed in the data. However, some difficulties arise because of the incomplete harmonization of income data between countries. Some countries record only gross yearly wages, others only net wages, and some others both of them. Gross wages are chosen whenever available and net wages as a proxy for gross wages when net wages are not available. This could lead to underestimating the values of UFDW and UFCW for these countries, but taking into account that the differential is usually around 30 per cent and that these countries are only four (Greece, Italy, Latvia and Portugal), the overall effect on the European values should be small.
For potential workers two further problems arise: the identification of individuals pertaining to this category and the estimation of the potential wage to be attributed to each potential worker. Potential workers are defined as all non-working
individ-Page 13 of 51 Submitted Manuscript
1 2 3 4 5 6 7 8 9 10 11 12 13 14 15 16 17 18 19 20 21 22 23 24 25 26 27 28 29 30 31 32 33 34 35 36 37 38 39 40 41 42 43 44 45 46 47 48 49 50 51 52 53 54 55 56 57 58
For Peer Review
uals older than 2011 and younger than 65 who have no health limitation, are not
in education and self-report as being unemployed or fulfilling domestic tasks. With this definition, potential workers are 30 millions in Europe, while workers for which a salary is actually observed are 158 millions.
The wage estimation for potential workers is conducted using a Heckman Selection model (Heckman, 1979), separately for men and women to account for the different behaviour implied by the different role in the society. These estimates are used to predict wages of potential workers, to be employed for the computation of the OC value. Wages used with the OC are reported in Table 1. More details about the estimation of potential wages can be found in the Appendix.
Generalist Market Replacement. The GMR approach aims at assigning a general-ist domestic/care worker wage to each hour of unpaid domestic work. This approach has two practical implications. The first is that the total population should be in-cluded in the analysis, not only workers and potential workers like in the OC case, but also retired people. The upper age limit of 65 is therefore relaxed to 74. The second is that a wage is exogenously assigned independently of the specific charac-teristics of households and individuals. When the GMR is applies to the enlarged population (EGMR), its value is expected to be larger than that computed using the OC12.
As for the wage of a generalist domestic worker, the chosen strategy is to compute a country median wage13, hence maintaining the country heterogeneity
naturally observed in the data. On the other hand, to avoid possible interpretation difficoulties caused by the fact that the gender pay gap may differ substantially
11
This lower bound is chosen for consistency with HETUS tables, which include people aged 20-74.
12
In the literature concerning the comparison between the two approaches, the OC value of unpaid work is usually larger than the MR value because the average market wage is generally higher than the “domestic worker” wage used as general wage to apply to domestic work. This is so because the reference population performing this work is, for comparative purposes, of the same size. On the other hand, with EGMR the value of unpaid work supplied by retirees is also taken into account.
13
We could have chosen the average wage, but as the distribution of wages is skewed toward high salaries, the average wage is always higher that the median wage, implying a possible overestimation of the values of UFDW and UFCW.
1 2 3 4 5 6 7 8 9 10 11 12 13 14 15 16 17 18 19 20 21 22 23 24 25 26 27 28 29 30 31 32 33 34 35 36 37 38 39 40 41 42 43 44 45 46 47 48 49 50 51 52 53 54 55 56 57 58
For Peer Review
between countries, the median wages are not computed by gender. The wage of generalist domestic worker is assumed to be the ISCO-88 code 91 occupation (sales and services elementary occupations), which includes, among other similar workers, the category “Domestic and related helpers, cleaners and launderers”. Table 1 resumes the values (in Euros per hour) of the generalist domestic worker wage for each country.
Specialist Market Replacement. The detailed information about time use cate-gories present in HETUS allows assigning a specific wage to each activity related to childcare14. HETUS collects information on the following childcare activities:
phys-ical care, supervision of child; teaching, reading, talking with child; transporting a child. EU-SILC collects information on three analogous categories of childcare ac-tivities according to the ISCO-88 codes of the occupational classification. The codes used are 51 - personal and protective service workers - for physical care, supervision of a child; 23 - teaching professionals - for teaching, reading, talking with a child15;
83 - drivers and mobile plant operators - for transporting a child. The specialists wages used in each country are shown in Table 1.
Again, the use of the enlarged population base (ESMR) leads to larger expected values with respect to the OC approach.
Outsourced Childcare. Finally, another component has to be taken into account for the evaluation of unpaid family childcare work, namely, childcare outsourced to other family members who provide it for free. The evaluation of outsourced childcare is performed using the EU-SILC information on time spent by children in childcare provided by grandparents and other household members and multiplying it by the
14
For UFDW, HETUS detailed information is also available (like time devoted to ironing, washing, cleaning the house and so on), but it would not match with any occupational ISCO-88 code other than 91.
15
Since code 23 includes university professors, code 33 (teaching assistant professionals) could have been chosen, in order to avoid overestimating the average parental teaching ability. However, code 33 has too few observations in the EU-SILC survey (for instance Finland only have 6 observations, Greece 10), thus it would produce unreliable results.
Page 15 of 51 Submitted Manuscript
1 2 3 4 5 6 7 8 9 10 11 12 13 14 15 16 17 18 19 20 21 22 23 24 25 26 27 28 29 30 31 32 33 34 35 36 37 38 39 40 41 42 43 44 45 46 47 48 49 50 51 52 53 54 55 56 57 58
For Peer Review
median country wage of a personal care worker (ISCO-88 code 51). EU-SILC has a detailed section on hours of childcare spent by children in different types of formal and informal care. Therefore, it is possible to isolate the hours of childcare spent by each child with relatives or friends living outside the household. These hours are most likely supplied by grandparents. Table 6 shows the country average time spent in outsourced childcare.
Advantages and disadvantages of each method
Each method of evaluation has advantages and shortcomings which have been exten-sively discussed in the literature (see Jackson, 1996; Landefeld and McCulla, 2000; UN, 2000; Abraham and Mackie, 2004). Several authors have pointed out that the problem with the opportunity cost method is that it yields different values for similar household tasks depending on who performed the task. Although this is a real prob-lem when national accounting is the purpose of the analysis (EUROSTAT, 2003), this criticism may not apply here, since this method is used for another purpose, namely drawing some conclusions in the cost-benefit analysis16. A more general
drawback of this method is that it is based on the standard microeconomic model of labour supply whereby people are assumed to choose freely the number of their working hours, an assumption that does not seem realistic given the constraints faced by individuals in the labour market.
The replacement cost approach - both generalist and specialist - using market wage rates to value unpaid family activities does not suffer from the previous problems, making this method more appropriate for accounting purposes. However, also this market approach may be problematic, especially in its specialist variant. The major problem with this variant is that the working conditions and productivity of the specialized worker may be significantly different from those of the unpaid household worker. This usually leads to an overestimation of the value of unpaid household
16
A similar example of the use of OC for this purpose is provided in Davis and You (2010), who study the consequences on obesity of the increase in the opportunity cost of time of food preparation at home. 1 2 3 4 5 6 7 8 9 10 11 12 13 14 15 16 17 18 19 20 21 22 23 24 25 26 27 28 29 30 31 32 33 34 35 36 37 38 39 40 41 42 43 44 45 46 47 48 49 50 51 52 53 54 55 56 57 58
For Peer Review
work, but, in the present analysis, the aim of the use of SMR is somewhat broader, consisting in the derivation of an indicative range of variation for this value. The idea is to show that, whatever the methodology applied, be it overestimating or underestimating it, the value of family care work represents a substantial share of the national product.
IV. Results
The use of time by European households
The distribution of time across different activities gives a first general picture of the daily share of time spent in domestic and childcare work. Data drawn from HETUS shows that in the EU market work and domestic work amount daily to around 200 minutes each per person on average, while leisure takes the largest share in the distribution of time reaching a mean value of 321 minutes per day (see Table 2). European women spend 257 minutes of their daily time in domestic work, whereas men 147 minutes. On average, including non-working days and inactive people, market work occupies less than three hours per day of women’s time, while men work four hours and a half per day. Childcare, compared to total domestic work, is a much smaller share, especially the part carried out by fathers (13 versus 33 minutes of mothers). Childcare takes such small values both because the average values comprise households without children and because only primary activities are included in the analysis.
From this description, family caretaking seems to remain a woman’s responsibility, following the traditional division of activities within the household. Thus, European women are characterized by a heavier load of domestic and childcare work, even if there are differences in relation to household income, household size and level of education. These figures confirm the evidence on gender gaps, with men working more for the market and engaging less in domestic tasks in all countries. Moreaover,
Page 17 of 51 Submitted Manuscript
1 2 3 4 5 6 7 8 9 10 11 12 13 14 15 16 17 18 19 20 21 22 23 24 25 26 27 28 29 30 31 32 33 34 35 36 37 38 39 40 41 42 43 44 45 46 47 48 49 50 51 52 53 54 55 56 57 58
For Peer Review
the amount of total work, both domestic and for the market, is in general higher for women (460 minutes per day versus 424 minutes per day of men).
Another piece of evidence on the burden of domestic tasks for women’s employ-ment can be drawn from EU-SILC. Family caretaking - housework, looking after children or other persons - seems to be the major reason for working less than 30 hours per week and, in the EU, up to 96.8 per cent of individuals that work less than 30 hours because of domestic activities are women. Table 3 shows the percentage of women working less than 30 hours per week over total female employment and their distribution by reasons of this choice. In general, part-time female workers (working less than 30 hours per week) are unevenly distributed across the European countries. The countries with the highest percentages of female part-time workers are the Netherlands and Germany. A large part of these women would prefer to work more if they did not have to accomplish with domestic tasks (47 per cent and 35 per cent respectively). Similar figures are observed for Ireland, Spain, Cyprus, Luxembourg, Austria and the UK, but with lower rates of part-time. Where a smaller share of part-time work is observed, lower percentages of women working less than 30 hours per week because of domestic work are also observed (as in the case of Italy, Greece, Poland and Portugal) and this might be interpreted as a signal that, where part-time work is less accessible, women that have an excessive burden of domestic tasks do not participate at all. Unfortunately EU SILC does not ask housewives the reasons for not working, so it is not possible to answer precisely this question.
The Values of Unpaid Family Domestic Work and Unpaid Family Childcare Work in the EU
This section presents the values of UFDW and UFCW estimated with the OC and the MR approaches, both generalist and specialist, for Europe as a whole. Table 4 summarises the estimated values of unpaid domestic work, unpaid family childcare work and outsourced childcare at the EU level.
1 2 3 4 5 6 7 8 9 10 11 12 13 14 15 16 17 18 19 20 21 22 23 24 25 26 27 28 29 30 31 32 33 34 35 36 37 38 39 40 41 42 43 44 45 46 47 48 49 50 51 52 53 54 55 56 57 58
For Peer Review
With the OC approach, the values of UFDW and UFCW are 2655 and 470 billion Euros respectively, summing up to 3125 billion Euros for the whole European family caretaking activities. This value corresponds to 27.1 per cent of the 2006 EU GDP (11543 billion Euros – Source: Eurostat 2006). On the other hand, the values estimated with the GMR on the same reference population as OC drop to 1611 and 285 billion Euros for UFDW and UFCW respectively, smaller than those found with the OC approach, since the hourly wage of a domestic worker is smaller than the average imputed opportunity cost (see Tables 2 and 3). The values estimated with the EGMR approach are 3021 and 390 billion Euros. They sum up to 3411 billion Euros, which represents 29.6 per cent of the EU GDP.
The possible sources of underestimation of these values can be adjusted in two ways. On one side, the ESMR can be applied, imputing a specialized wage to each different activity of childcare17. On the other side, the OC could be integrated to
take into account the amount of time that children spend in outsourced childcare, namely, the value of childcare time provided for free by friends or relatives. Table 4 shows that in the first case, the value of UFCW computed with the ESMR approach is 623 billion Euros, which is 60 per cent larger than that computed with EGMR and represents 5.4 per cent of the European GDP. The estimated value of outsourced childcare, instead, amounts to 68 billion Euros, yielding the OC value of unpaid family childcare work of 538 billion Euros (4.7 per cent of the EU GDP).
As for the use of these findings in a cost-benefit analysis, the difference between the OC and the GMR value of family caretaking activities, that is 9 and 1.6 percentage points in terms of overall EU GDP for UFDW and UFCW respectively, might be symptomatic of a possible waste of resources for the society as a whole. In other words, it might turn out to be more convenient subsidizing or providing public services for certain types of household activities in order to allow a more efficient allocation of the labour force. The disaggregation by country presented in the next Section gives some additional insight into this topic. However, a thorough analysis
17
The wage of a professional childcare worker is usually higher than that of a domestic worker, allowing to evaluate more accurately the value of UFCW.
Page 19 of 51 Submitted Manuscript
1 2 3 4 5 6 7 8 9 10 11 12 13 14 15 16 17 18 19 20 21 22 23 24 25 26 27 28 29 30 31 32 33 34 35 36 37 38 39 40 41 42 43 44 45 46 47 48 49 50 51 52 53 54 55 56 57 58
For Peer Review
of which workers and which activities drive this result would require more detailed analysis of wages and of the use of time by type of activity which is beyond the scope and possibilities of the present work.
The different underlying assumptions and techniques used to produce the values of Table 4 imply that the smaller and larger values can be reasonably interpreted as bounds. The smaller value (lower bound) is calculated using the most restrictive conditions and assumptions, that is taking into account only the active population and housewives and evaluating domestic activities at the wage of an unskilled do-mestic worker. The largest value (upper bound) is applied to a larger population share, the whole adult population, and evaluating domestic activities at the wage of more specialized workers. For the lower bound (GMR), the values of UFDW and UFCW sum up to 17.0 per cent of the EU GDP. For the upper bound (ESMR), this value rises to 31.6 per cent of the EU GDP.
These are huge figures that, nonetheless, are expected to be so for two reasons: (i) the time devoted to domestic and childcare activities is on average similar to the time spent in the labour market (see Table 2), and (ii) the time devoted to these activities is evaluated at market wages. These two conditions imply that the value of UFDW plus UFCW in terms of percentage of GDP should be expected to be similar to that of labour income.
Unpaid Family Domestic Work and Unpaid Family Childcare Work in the European Countries
This section presents the results concerning the values of UFDW and UFCW for each country. It is important to keep in mind that these values highly depend on the national labour market features and wage levels, which are accounted for in the following analysis. For clarity of exposition, the focus is only on the values estimated with the EGMR for UFDW and the ESMR for UFCW.
Looking at the differences among Member States (Table 5) and excluding the countries for which EU-SILC records net wages, Belgium, Denmark and Germany
1 2 3 4 5 6 7 8 9 10 11 12 13 14 15 16 17 18 19 20 21 22 23 24 25 26 27 28 29 30 31 32 33 34 35 36 37 38 39 40 41 42 43 44 45 46 47 48 49 50 51 52 53 54 55 56 57 58
For Peer Review
have the highest values for UFDW in percentage of GDP. On the contrary, the smallest values are recorded for Luxembourg, Estonia and the Czech Republic. In absolute terms, the main contributions to the value of European UFDW are given by the largest countries, such as Germany, France, the United Kingdom and Italy, characterised by relatively high wages and large populations.
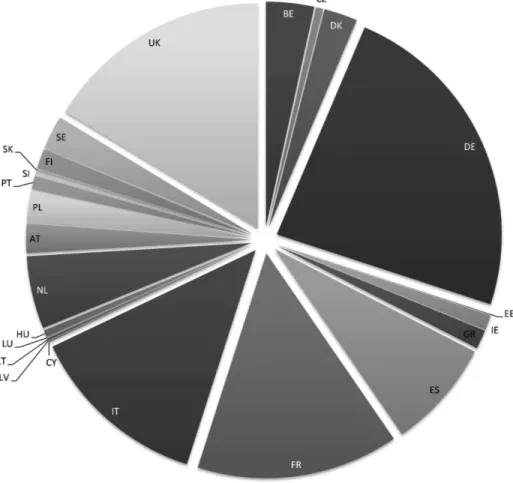
UFCW values are rather close in all countries - at least in GDP percentage terms - showing a smaller variability with respect to the estimates of UFDW. As shown in Figure 1, few countries contribute in absolute terms to the most part of the European value of UFCW. The main contribution is given by the “old” Member States, while in percentage of GDP Poland has the largest value in the EU, together with Germany, Cyprus, the United Kingdom and the Netherlands. The smallest values of family childcare are in the Baltic States and the Czech Republic.
In order to deepen the comparative analysis and to understand why these dif-ferences among countries emerge, it is useful to look at how the monetary values UFDW and UFCW are composed. The underlying relation which determines the country values can be decomposed as country population times the average time devoted to unpaid activities times the value of this time. Given that the size of the country population can be considered a purely exogenous factor (at least in the short term), the focus on the relation between unpaid work time and its value allows to identify groups of homogeneous countries with similar characteristics. The choice of focusing on these aspects is motivated by the fact that time spent in domestic activities can be associated to cultural traditions and to the provision of public ser-vices by the state18, while the average wage can be used as a rough proxy of the level
of economic development of a country. Even though more appropriate measures of economic development are available, it is still possible to use a simple indicator such as the wage rate, since the majority of countries analysed have the same currency,
18
This is a very broad approximation, though, and a more precise indicator of the provision of services by the state should be used to avoid uncertainty about what are the real factors influencing the time devoted to unpaid activities. This, however, is beyond the scope of the article and could be an issue to investigate in future work.
Page 21 of 51 Submitted Manuscript
1 2 3 4 5 6 7 8 9 10 11 12 13 14 15 16 17 18 19 20 21 22 23 24 25 26 27 28 29 30 31 32 33 34 35 36 37 38 39 40 41 42 43 44 45 46 47 48 49 50 51 52 53 54 55 56 57 58
For Peer Review
the Euro, and the rest belongs to the European Exchange Rate Mechanism, which allows only minimal fluctuations of the exchange rates.
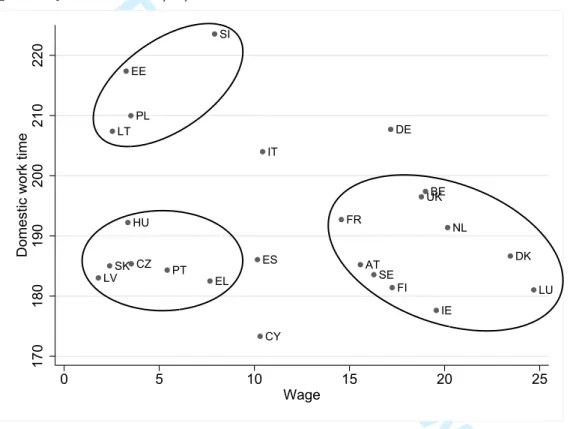
A graphical analysis of the relation between the average time devoted to UFDW and UFCW and the average wage observed in each country (Figure 2) shows that at least three groups can be identified. A first group, characterized by low wages and small amounts of time devoted to UFDW, is composed by Croatia, Greece, Hungary, Latvia, Portugal and Slovakia. A second group, characterized by high wages and rather small amounts of UFDW time, is composed by Austria, Belgium, Denmark, Finland, France, Ireland, Luxembourg, Sweden and the United Kingdom. Germany stands out of this group because of a higher amount of domestic work. Finally a third group, characterized by low wages and large UFDW time amounts is composed by Estonia, Lithuania, Poland and Slovenia. Comparing the first two groups, group one and two display similar amounts of time dedicated to domestic work, while wages are much higher in the second group. This evidence shows that the per-capita value of UFDW is higher in the second group of nations because of higher wages. On the other hand, group three has similar wages as the first group, but more time is devoted to domestic work, possibly because the organization of households follows more traditional rules and structures. Here, the appearance that economic development reduces the time spent in domestic activities because people can afford to buy these services in the market may be misleading: a rather large group of countries with high wages spends the same amount of time in domestic work as the group with low wages. Traditions seem to be more important than economic development in the choice of providing UFDW.
The same analysis for UFCW (Figure 3) reveals that four groups of countries can be identified. A first group, composed by Croatia, Estonia, Greece, Hungary, Latvia, Lithuania, Portugal and Slovakia, is characterized by low wages and scarce time devoted to UFCW. A second group, composed by Ireland, Sweden and the United Kingdom, is characterized by high wages and large amounts of time devoted to UFCW. A third group, composed by Cyprus, France, Italy and Spain, is
char-1 2 3 4 5 6 7 8 9 10 11 12 13 14 15 16 17 18 19 20 21 22 23 24 25 26 27 28 29 30 31 32 33 34 35 36 37 38 39 40 41 42 43 44 45 46 47 48 49 50 51 52 53 54 55 56 57 58
For Peer Review
acterized by medium wages and medium time devoted to UFCW. A fourth group composed by Austria, Belgium, Denmark, Finland, Germany, Luxembourg and the Netherlands, is characterized by high wages and small amounts of time devoted to UFCW. Finally, Poland seems to be an outlier, with low wages and a very large amount of time devoted to UFCW. As a result, the grouping of countries is slightly more complex than in the case of UFDW. The first and fourth group show simi-lar childcare attitudes, but the fourth group is economically better off. The third group has higher wages and dedicates more time to children with respect to the first group. In turn, the second group shows higher wages and more childcare time than the third. This seems to suggest a positive relation between economic development and time spent with children, with the exception of a group mostly composed by relatively high wage countries that dedicate less time to UFCW, possibly because of a welfare system in which childcare services provided by the state are widespread19.
In this kind of analysis, gender differences play a crucial role. As an example20,
Figure 4 graphs the same relationship for UFDW provided by men. The emblematic cases of Italy and Spain are evident. In these countries, men dedicate by far the smallest amounts of time to UFDW. Overall, a somewhat positive relationship be-tween wages and time devoted to domestic work is found. This could be explained if higher wages reflected higher productivity or education. In the first case a higher productivity may leave more non-labour time to help in domestic activities. In the second case, higher education may imply a deeper social conscience that pushes males to help more in the house.
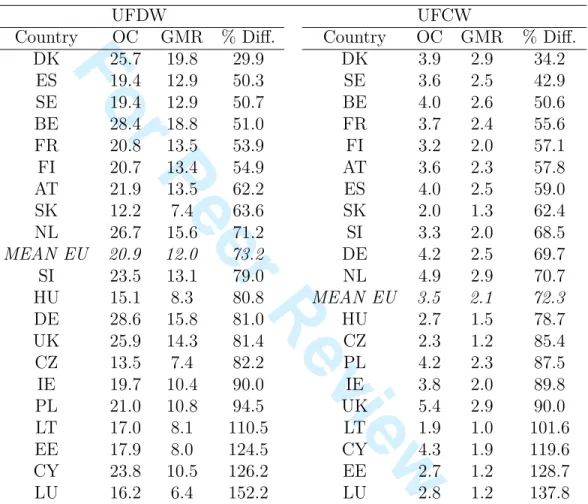
Turning now to the potential use of these results in cost-benefit analyses, the expected evidence is that where public care services and allowances are more devel-oped, the loss in Value Added attributable to an inefficient allocation of the labour force should be lower. Table 7 presents the difference between the OC and the GMR
19
Under this respect, a more detailed analysis accounting for Esping Andersen’s classification of welfare state regimes could lead to interesting results (Esping-Andersen, 1990).
20
It would be possible to produce several other analyses using data from Table 6. These are left out of the paper for the sake of brevity and may be object of a future work.
Page 23 of 51 Submitted Manuscript
1 2 3 4 5 6 7 8 9 10 11 12 13 14 15 16 17 18 19 20 21 22 23 24 25 26 27 28 29 30 31 32 33 34 35 36 37 38 39 40 41 42 43 44 45 46 47 48 49 50 51 52 53 54 55 56 57 58
For Peer Review
value of family caretaking activities by country21. The table ranks the countries from
the lowest loss (the lowest per cent difference OC-GMR) to the highest. The cost of UFDW and UFCW in terms of loss of VA (in per cent) is quite relevant in the major-ity of countries. As for UFDW the Nordic countries, Belgium and France appear to suffer from the lowest losses, but, unexpectedly, also Spain and Slovakia; the highest losses are instead to be found in the Baltic and ex-communist countries, but, unex-pectedly, also in Germany, UK, Ireland and Luxembourg. However, the amount of UFDW is influenced by public policies more indirectly than the amount of UFCW. In fact, the country ranking in this latter case is somewhat easier to reconcile to the mapping of childcare policies in Europe sketched in Section II. The lowest losses are again found in the Nordic countries, Belgium and France, and also Germany ranks below the EU average. However, Spain ranks better than Germany, and Slovenia better than Germany and the Netherlands. The highest losses due to UFCW are to be found in the Baltic and ex-communist countries as before, but also, and again unexpectedly, in the UK, Ireland and Luxembourg, that rank after Poland. The case of Germany is emblematic: it is the country with one of the highest values of family caretaking over GDP, with one of the highest percentage of part-time women who would desire to work more in the market if they had less domestic tasks and with one of the highest opportunity costs. This happens notwithstanding the relatively high standard of family policies in this country.
V. Summary and Conclusions
To our knowledge, this research provides for the first time estimates of the value of unpaid family caretaking activities in the EU based on matched harmonized data drawn from EU-SILC ad HETUS. Both the opportunity cost and market replace-ment approaches are implereplace-mented and used to estimate the total time input cost for unpaid family domestic work and unpaid family childcare work.
21
Italy, Portugal, Latvia and Greece had to be excluded from this comparison because of the use of net wages instead of gross wages, like in the rest of countries.
1 2 3 4 5 6 7 8 9 10 11 12 13 14 15 16 17 18 19 20 21 22 23 24 25 26 27 28 29 30 31 32 33 34 35 36 37 38 39 40 41 42 43 44 45 46 47 48 49 50 51 52 53 54 55 56 57 58
For Peer Review
The main task of the paper is to devise a methodology to impute monetary val-ues to unpaid family domestic work (UFDW) and to unpaid family childcare work (UFCW) in the EU. The analysis is conducted for all the EU25 countries (except Malta, whose data were not available), with the objective of giving some indications about the weight that unpaid family caretaking has in the EU and in each European economy. The results show that the comprehensive value of unpaid family caretak-ing (UFDW plus UFCW) ranges between a minimum of 17 per cent and a maximum of 31.6 per cent of the EU GDP. Unpaid family childcare work alone ranges from a minimum of 2.5 per cent to a maximum of 5.4 per cent of European GDP, depending on the applied methodology.
The paper also discusses the values of UFDW and UFCW at a country level, pointing out the contribution that unpaid family caretaking work would provide to each economy if included in the national accounts. This contribution varies from 10.4 per cent of GDP in Latvia to 40.3 per cent of GDP in Denmark. The cross-country analysis of UFDW and UFCW by their time and wage components reveals two important facts. First,economic development (in terms of wage levels) is not sufficient to reduce the amount of time devoted to unpaid family domestic work, and cultural traditions, along with the amount of public services provided by the state, seem to be a more important factor. Second, the higher the average wage of a country, the more time is devoted to childcare, probably because childcare is considered a valuable activity, similarly to leisure time. This positive relationship is not found for a group of countries which belong to continental welfare state regimes, in which the childcare services provided by the state are widespread and the culture of female labour force participation has a long tradition.
Finally, the difference between the opportunity cost and market replacement input costs for UFDW and UFCW is interpreted as an indicator of the loss in value added due to the misallocation of the labour force. The overall EU amount of this loss is 10.6 percentage points in GDP terms and its distribution among the EU countries crucially depends on national variables such as the wage level, the
Page 25 of 51 Submitted Manuscript
1 2 3 4 5 6 7 8 9 10 11 12 13 14 15 16 17 18 19 20 21 22 23 24 25 26 27 28 29 30 31 32 33 34 35 36 37 38 39 40 41 42 43 44 45 46 47 48 49 50 51 52 53 54 55 56 57 58
For Peer Review
amount of time dedicated to these activities, the population performing them and national economic policies. The country comparison yields the general impression that this loss is lower in countries that have dedicated more resources to implement family policies. However, under this respect, the usual clustering of countries is not completely applicable, and further research regarding this issue would help to better understand this evidence.
Acknowledgements. This article grew out of a study for the European
Par-liament conducted by the authors on behalf of the Fondazione Giacomo Brodolini in Rome. It was presented in 2009 at the XXIV National Conference of Labour Economics in Sassari, and in 2010 at the conference of the International Association for Time Use Research in Paris, and at the CEPR-IZA European Summer Sym-posium in Labour Economics in Munich, benefiting from the suggestions of their participants. The authors also would like to thank two anonymous referees for their comments and suggestions. The usual disclaimer applies.
References
Abraham, K. and Mackie, C. (2004) Beyond the Market. Designing Nonmar-ket Accounts for the United States, Tech. rep., Washington, D.C.The National Academies Press.
Alesina, A. and Ichino, A. (2010) L’Italia Fatta in Casa. Indagine sulla vera
ric-chezza degli italiani, Mondadori.
Anxo, D., Flood, L., Mencarini, L., Pailhé, A., Solaz, A. and Tanturri, M. (2007) Time Allocation between Work and Family over the Life-Cycle: A Comparative Gender Analysis of Italy, France, Sweden and the United States, IZA Discussion
Papers.
Becker, G. (1965) A theory of allocation of time, Economic Journal, 75, 493–517. Breen, R. and Cooke, L. (2005) The persistence of the gendered division of domestic
labour, European Sociological Review, 21, 43–57.
1 2 3 4 5 6 7 8 9 10 11 12 13 14 15 16 17 18 19 20 21 22 23 24 25 26 27 28 29 30 31 32 33 34 35 36 37 38 39 40 41 42 43 44 45 46 47 48 49 50 51 52 53 54 55 56 57 58
For Peer Review
Davis, G. C. and You, W. (2010) The time cost of food at home: general and food stamp participant profiles, Applied Economics, 42, 2537–2552.
Davis, S. and Greenstein, T. (2004) Cross-national variations in the division of household labor, Journal of Marriage and Family, 66, 1260–1271.
Del Boca, D., Pasqua, S. and Pronzato, C. (2008) An Empirical Analysis of the Effects of Social Policies on Fertility, Labour Market Participation and Earn-ings of European Women, in Social Policies, Labour Markets and Motherhood: a
Comparative Analysis of European Countries(Eds.) D. Del Boca and C. Wetzels, Cambridge University Press.
EGGE (2009) The provision of childcare services: A comparative review of 30 Euro-pean countries, Tech. rep., EuroEuro-pean Commission, Expert Group on Gender and Employment.
Eisner, R. et al. (1982) Total Incomes in the United States, 1946-1976: A Summary Report, Review of Income and Wealth, 28, 133–174.
Esping-Andersen, G. (1990) The Three Worlds of Welfare Capitalism, Polity Press, Oxford.
EUROSTAT (2000) Guidelines on Harmonised European Time Use Survey, Tech. rep., Eurostat, european Commission, Luxembourg: Office for Official Publica-tions of the European Communities.
EUROSTAT (2003) Household Production and Consumption Proposal for a Methodology of Household Satellite Accounts, Tech. rep., Eurostat, working Pa-pers and Studies.
Goldschmidt-Clermont, L. and Pagnossin-Aligisakis, E. (1999) Households’ Non-SNA Production: Labour Time, Value of Labour and of Product, and Contri-bution to Extended Private Consumption, Review of Income and Wealth, 45, 519–529.
Gronau, R. (1973) The intrafamily allocation of time: The value of the housewives’ time, The American Economic Review, 63, 634–651.
Page 27 of 51 Submitted Manuscript
1 2 3 4 5 6 7 8 9 10 11 12 13 14 15 16 17 18 19 20 21 22 23 24 25 26 27 28 29 30 31 32 33 34 35 36 37 38 39 40 41 42 43 44 45 46 47 48 49 50 51 52 53 54 55 56 57 58
For Peer Review
Heckman, J. (1979) Sample selection bias as a specification error, Econometrica, 47, 153–161.
Holloway, S., Short, S. and Tamplin, S. (2002) Household satellite account (experi-mental) methodology, Tech. rep., Office of National Statistics UK.
Iazaro, N., Molto’, M. L. and Sanchez, R. (2004) Paid employment and unpaid caring work in Spain, Applied Economics, 36:9, 977–986.
ILO (1995) Measurement and Valuation of Unpaid Contribution, Tech. rep., Inter-national Labour Office, Santo Domingo, accounting through Output and Time. ILO (1996) Valuation of Household Production and the Satellite Accounts, Tech.
rep., International Labour Office, Santo Domingo.
Ironmonger, D. S. (1994) Modelling the Household Economy, in Economics,
Econo-metrics and the LINK: Essays in Honor of Lawrence R. Klein (Ed.) M. J. Dutta, North-Holland.
Jackson, C. (1996) The valuation of unpaid work at statistics Canada, Feminist
Economics, 2, 145–148.
Kendrick, J. (1979) Expanding Imputed Values in the National Income and Product Accounts, Review of Income and Wealth, 25, 349–363.
Landefeld, S. and McCulla, S. (2000) Accounting for Nonmarket Household Produc-tion Within a NaProduc-tional Accounts Framework, Review of Income and Wealth, 46, 289–307.
Lewis, J., Campbell, M. and Huerta, C. (2008) Patterns of paid and unpaid work in Western Europe: gender, commodification, preferences and the implications for policy, Journal of European Social Policy, 18, 21–37.
Nordhaus, W. D. and Tobin, J. (1973) Is growth obsolete?, in The Measurement of
Economic and Social Performance (Ed.) M. Moss, National Bureau of Economic Research, New York, vol. 38 of Studies in Income and Wealth, pp. 509–532. OECD (1992) What is households non-market production worth?, Tech. Rep. 18,
Organization for Economic Cooperation and Development, Paris.
1 2 3 4 5 6 7 8 9 10 11 12 13 14 15 16 17 18 19 20 21 22 23 24 25 26 27 28 29 30 31 32 33 34 35 36 37 38 39 40 41 42 43 44 45 46 47 48 49 50 51 52 53 54 55 56 57 58
For Peer Review
OECD (1999) Proposal for a satellite account of household production, Tech. rep., Organization for Economic Cooperation and Development, Paris, meeting of Na-tional Accounts Experts.
Powell, L. M. (1998) Part-time versus full-time work and child care costs: evidence for married mothers, Applied Economics, 30: 4, 503–511.
Prodromos-Ioannis, P. (2005) Estimating women’s time use: based on British survey evidence from 1986-1987, Applied Economics, 37:13, 1505–1521.
Reid, M. (1934) Economics of household production, J. Wiley & Sons, Inc.
Solera, C. (2008) Combining marriage and children with paid work: Changes across cohorts in Italy and Great Britain, ISER working papers, 22.
Swiebel, J. (1999) Unpaid work and policy-making: Towards a broader perspective of work and employment, United Nations - DESA Discussion Paper Series, 10, 20–30.
Trewin, D. (2000) Unpaid work and the Australian economy: 1997, Australian
Bu-reau of Statistics.
UN (2000) Household Accounting: Experience in Concepts and Compilation, Tech. Rep. Vol. 2, Household Satellite Extensions, United Nations.
Voicu, B., Voicu, M. and Strapkova, K. (2007) Engendered housework. A cross-european analysis, IRISS Working Paper Series, 7.
Page 29 of 51 Submitted Manuscript
1 2 3 4 5 6 7 8 9 10 11 12 13 14 15 16 17 18 19 20 21 22 23 24 25 26 27 28 29 30 31 32 33 34 35 36 37 38 39 40 41 42 43 44 45 46 47 48 49 50 51 52 53 54 55 56 57 58
For Peer Review
Table 1. Wages used in OC, GMR and SMR (Euro/h, 2006. Source EU-SILC)
Country OC GMR SMR
code Men Women Domestic worker Physical care Teaching Transport BE 19.61 18.27 12.6 14.9 20.1 15.6 CZ 3.94 3.1 1.9 2.3 4.1 2.9 DK 24.56 22.71 18.5 19.1 25.9 20.7 DE 18.79 15.47 9.2 12.4 26.6 14.2 EE 3.71 2.8 1.4 1.7 3.2 2.6 IE 20.49 17.8 10.2 12.8 35.0 14.2 EL* 7.99 7.05 4.7 6.0 13.9 7.0 ES 10.71 9.31 6.5 7.5 17.2 8.4 FR 15.19 13.9 9.4 10.6 17.7 10.9 IT* 10.44 10.01 7.5 8.1 16.4 9.0 CY 11.56 8.88 4.6 7.7 19.0 9.0 LV* 2.03 1.55 0.7 1.0 2.2 1.4 LT 2.64 2.39 1.2 1.5 3.4 1.8 LU 26.59 22.55 10.0 12.5 37.2 14.4 HU 3.48 3.13 1.9 2.2 4.1 2.5 NL 22.76 17.7 12.2 14.4 23.8 16.3 AT 17.17 13.99 9.7 12.6 22.3 13.6 PL 3.48 3.33 1.8 1.9 5.6 2.5 PT* 5.66 5.08 3.2 3.4 11.6 3.9 SI 8.07 7.76 4.5 5.3 11.9 5.5 SK 2.59 2.19 1.5 1.6 2.6 2.1 FI 18.62 15.94 11.1 12.4 19.6 13.0 SE 17.61 14.98 10.8 12.7 14.8 13.7 UK 20.48 16.72 9.9 11.3 21.7 13.4
* Indicates countries that report only net wages
1 2 3 4 5 6 7 8 9 10 11 12 13 14 15 16 17 18 19 20 21 22 23 24 25 26 27 28 29 30 31 32 33 34 35 36 37 38 39 40 41 42 43 44 45 46 47 48 49 50 51 52 53 54 55 56 57 58
For Peer Review
Table 2. Average minutes per day spent in different categories of time use in the EU (males and females aged 20-74. Source: HETUS)
Males Females All Market work 270 170 218 Domestic work 141 257 202 Childcare work 13 33 23
Leisure 344 298 321 Other activities 673 382 376
Page 31 of 51 Submitted Manuscript
1 2 3 4 5 6 7 8 9 10 11 12 13 14 15 16 17 18 19 20 21 22 23 24 25 26 27 28 29 30 31 32 33 34 35 36 37 38 39 40 41 42 43 44 45 46 47 48 49 50 51 52 53 54 55 56 57 58
For Peer Review
Table 3. Women working part-time and their distribution by reasons for working part-time ( % , 2006. Source: EU-SILC).
Working less than 30 hours Reasons for working less than 30 hours Country over total employed Family caretaking Other
BE 14.2 29.9 70.1 CZ 2.7 25.2 74.8 DK 10.8 11.9 88.1 DE 22.3 35.3 64.7 EE 3.9 19.4 80.6 IE 12.4 45.1 54.9 EL 4.9 12.0 88.0 ES 6.5 34.9 65.1 FR 12.1 29.0 71.0 IT 5.9 19.9 80.1 CY 3.9 37.6 62.4 LV 3.4 22.3 77.7 LT 2.7 11.1 88.9 LU 12.8 55.0 45.0 HU 3.2 21.8 78.2 NL 25.8 47.4 52.6 AT 12.0 63.4 36.6 PL 4.1 12.0 88.0 PT 5.0 20.1 79.9 SI 1.4 * * SK 2.6 * * FI 6.7 4.6 95.4 SE 14.8 9.9 90.1 UK 16.2 46.2 53.8 EU 11.9 33.9 66.1 1 2 3 4 5 6 7 8 9 10 11 12 13 14 15 16 17 18 19 20 21 22 23 24 25 26 27 28 29 30 31 32 33 34 35 36 37 38 39 40 41 42 43 44 45 46 47 48 49 50 51 52 53 54 55 56 57 58
For Peer Review
Table 4. Values of UFDW and UFCW in the EU, including childcare outsourced to friends or relatives (billions of Euros, % of GDP in paren-theses, 2006)
Approach UFDW UFCW Outsourced childcare Total Opportunity Cost 2655 (23.0) 470 (4.1) 68 (0.6) 3193 (27.7) Generalist Market Replacement* 1611 (14.0) 285 (2.5) 68 (0.6) 1964 (17.0) Enlarged Generalist Market Replacement** 3021 (26.2) 390 (3.4) - ( - ) 3411 (29.6) Enlarged Specialist Market Replacement** 3021 (26.2) 623 (5.4) - ( - ) 3644 (31.6)
* Value computed using the same population base as the OC, i.e. employed people and potential workers (all non-working individuals who have no health limitation, are not in education and self-report as being unemployed or fulfilling domestic tasks) aged 20-65. ** Value computed using as population base the same definition above enlarged to include people aged up to 74 (pensioners)
Page 33 of 51 Submitted Manuscript
1 2 3 4 5 6 7 8 9 10 11 12 13 14 15 16 17 18 19 20 21 22 23 24 25 26 27 28 29 30 31 32 33 34 35 36 37 38 39 40 41 42 43 44 45 46 47 48 49 50 51 52 53 54 55 56 57 58