HAL Id: hal-01805230
https://hal.archives-ouvertes.fr/hal-01805230
Submitted on 23 Jul 2020
HAL is a multi-disciplinary open access
archive for the deposit and dissemination of
sci-entific research documents, whether they are
pub-lished or not. The documents may come from
teaching and research institutions in France or
abroad, or from public or private research centers.
L’archive ouverte pluridisciplinaire HAL, est
destinée au dépôt et à la diffusion de documents
scientifiques de niveau recherche, publiés ou non,
émanant des établissements d’enseignement et de
recherche français ou étrangers, des laboratoires
publics ou privés.
surface dry deposition
T. Verbeke, J. Lathière, S. Szopa, N. de Noblet-Ducoudré
To cite this version:
T. Verbeke, J. Lathière, S. Szopa, N. de Noblet-Ducoudré. Impact of future land-cover changes on
HNO3 and O3 surface dry deposition. Atmospheric Chemistry and Physics, European Geosciences
Union, 2015, 15 (23), pp.13555-13568. �10.5194/acp-15-13555-2015�. �hal-01805230�
www.atmos-chem-phys.net/15/13555/2015/ doi:10.5194/acp-15-13555-2015
© Author(s) 2015. CC Attribution 3.0 License.
Impact of future land-cover changes on HNO
3
and O
3
surface dry deposition
T. Verbeke, J. Lathière, S. Szopa, and N. de Noblet-Ducoudré
Laboratoire des Sciences du Climat et de l’Environnement – LSCE-IPSL, CEA/CNRS/UVSQ, Gif-sur-Yvette, France
Correspondence to: J. Lathière (juliette.lathiere@lsce.ipsl.fr)
Received: 3 April 2015 – Published in Atmos. Chem. Phys. Discuss.: 8 July 2015
Revised: 18 November 2015 – Accepted: 19 November 2015 – Published: 9 December 2015
Abstract. Dry deposition is a key component of surface–
atmosphere exchange of compounds, acting as a sink for several chemical species. Meteorological factors, chemical properties of the trace gas considered and land surface prop-erties are strong drivers of dry deposition efficiency and vari-ability. Under both climatic and anthropogenic pressure, the vegetation distribution over the Earth has been changing a lot over the past centuries and could be significantly altered in the future. In this study, we perform a modeling investigation of the potential impact of land-cover changes between the present day (2006) and the future (2050) on dry deposition velocities at the surface, with special interest for ozone (O3) and nitric acid (HNO3), two compounds which are character-ized by very different physicochemical properties. The 3-D chemistry-transport model LMDz-INCA is used, considering changes in vegetation distribution based on the three future projections, RCPs 2.6, 4.5 and 8.5, and present-day (2007) meteorology. The 2050 RCP 8.5 vegetation distribution leads to a rise of up to 7 % (+0.02 cm s−1) in the surface deposi-tion velocity calculated for ozone (Vd,O3) and a decrease of
−0.06 cm s−1 in the surface deposition velocity calculated for nitric acid (Vd,HNO3)relative to the present-day values
in tropical Africa and up to +18 and −15 %, respectively, in Australia. When taking into account the RCP 4.5 scenario, which shows dramatic land-cover change in Eurasia, Vd,HNO3
increases by up to 20 % (annual-mean value) and reduces
Vd,O3 by the same magnitude in this region. When analyzing
the impact of surface dry deposition change on atmospheric chemical composition, our model calculates that the effect is lower than 1 ppb on annual-mean surface ozone concen-tration for both the RCP 8.5 and RCP 2.6 scenarios. The impact on HNO3 surface concentrations is more disparate between the two scenarios regarding the spatial repartition
of effects. In the case of the RCP 4.5 scenario, a signifi-cant increase of the surface O3 concentration reaching lo-cally by up to 5 ppb (+5 %) is calculated on average during the June–August period. This scenario also induces an in-crease of HNO3 deposited flux exceeding locally 10 % for monthly values. Comparing the impact of land-cover change to the impact of climate change, considering a 0.93◦C in-crease of global temperature, on dry deposition velocities, we estimate that the strongest increase over lands occurs in the Northern Hemisphere during winter, especially in Eurasia, by
+50 % (+0.07 cm s−1) for Vd,O3and +100 % (+0.9 cm s
−1) for Vd,HNO3. However, different regions are affected by both
changes, with climate change impact on deposition charac-terized by a latitudinal gradient, while the land-cover change impact is much more heterogeneous depending on vegetation distribution modification described in the future RCP scenar-ios. The impact of long-term land-cover changes on dry de-position is shown to be significant and to differ strongly from one scenario to another. It should therefore be considered in biosphere–atmospheric chemistry interaction studies in order to have a fully consistent picture.
1 Introduction
Amongst surface–atmosphere interactions, dry deposition plays a key role in the exchange of compounds and acts as a significant sink for several atmospheric species. Perform-ing an intercomparison of 26 state-of-the-art atmospheric chemistry models, Stevenson et al. (2006) estimated the surface removal of ozone by dry deposition to be about 1000 ± 200 Tg yr−1 on average, with values ranging from 720 to 1507 Tg yr−1 amongst models, compared to 5100,
4650 and 550 Tg yr−1for chemical production, chemical de-struction and stratospheric input fluxes, respectively. This study also underlined that although global deposition fluxes are consistent between models, locally there is a large vari-ability in the ozone deposition velocities (Stevenson et al., 2006). Since all these models use deposition schemes based on Wesely’s prescription (Wesely et al., 1989), the discrep-ancies suggest different hypotheses for the land-type consid-eration. Based on satellite measurements from OMI (Ozone Monitoring Instrument) combined with the Goddard Earth Observing System chemical transport model (GEOS-Chem), Nowlan et al. (2014) estimated dry deposition to land to be 98 % of total deposition for NO2and 33 % for SO2. The de-position fluxes over land represent 3 % of global NOx emis-sions and 14 % of global sulfur emisemis-sions. Land surfaces can therefore play a significant role on deposition, with a highly variable contribution from one chemical compound to an-other.
The air–surface exchange of trace compounds has been shown to be strongly variable, especially between different types of surface vegetation and soil characteristics (Wesely et al., 2000). Regarding ozone, model data differences reported in the literature could be attributed to oversimplifications in the implementation of the dry deposition scheme (Val Martin et al., 2014) since many models rely on “resistance in series” schemes developed in the 1980s (Hardacre et al., 2015).
In order to quantify the non-photochemical sink for tropo-spheric burden at the regional and global scales, the scien-tific community uses numerical dry deposition schemes cal-ibrated with field measurements of dry deposition velocities (Wesely et al., 1989; Zhang et al., 2002b), implemented usu-ally in chemistry-transport models. Dry deposition efficiency is influenced by multiple meteorological factors (tempera-ture, solar radiation, humidity and especially atmospheric turbulence), chemical properties of the trace gas considered (solubility, oxidative capacity) and land surface properties (surface type, surface roughness, foliar surface and ecosys-tem height in the case of vegetation surfaces). Some of these factors are poorly constrained and are thus accounted for in deposition schemes in a very simplistic way. The vegetation distribution, for instance, is usually prescribed using maps for the region of interest that are generally kept the same for either past, present or future studies (e.g., Andersson and En-gardt, 2010 or Lamarque et al., 2013). There is therefore a lack of knowledge regarding the impact of long-term changes in vegetation distribution on dry deposition chemical com-pounds at the surface. Since the beginning of the industrial era, human activities have modified the use of large surfaces, affecting significantly the vegetation distribution, especially in the northern temperate latitude regions. Further land-cover modifications are expected in the 21st century due to pro-jected increases in energy and food demands, and vegetation, in tropical regions in particular, could undergo drastic alter-ations.
Figure 1. Interactions between vegetation and atmospheric
chem-istry potentially affected by land-use changes. In this work, only the red arrows are investigated.
Only a few studies have been carried out recently on the dry deposition changes in the future. Some of them focus on the impact of climate change on the dry deposition (An-dersson and Engardt, 2010) while others combine the effects of several future changes (climate, CO2 levels, land cover) on atmospheric chemistry in general (Ganzeveld et al., 2010; Wu et al., 2012). However, considering anthropogenic land-cover changes among other large modifications of the vegeta-tion/atmospheric chemistry drivers does not allow us to iden-tify whether the land-cover change should be considered as a priority in the studies of future atmospheric chemistry or not. The objective of this study is to investigate and isolate the po-tential impact of land-cover changes between the present day (2006) and the future (2050) on dry deposition velocities at the surface, using a modeling approach with a 3-D chemistry-transport model as illustrated in Fig. 1. Changes in vegetation distribution are based on the three future projections known as Representative Concentration Pathway (RCP) scenarios (van Vuuren et al., 2011), developed for the climate model in-tercomparison project (CMIP5): RCPs 2.6, 4.5 and 8.5. For this work we focus on ozone (O3)and nitric acid (HNO3), two compounds which are characterized by very different biophysical properties (e.g., solubility and oxidative capac-ity). In Sect. 2, we describe the chemistry-transport model LMDz-INCA, the dry deposition module and the modeling strategy adopted. In Sect. 3, we describe the different future land-cover changes as given in the three RCP scenarios 2.6, 4.5 and 8.5 and explain their impacts on surface dry deposi-tion velocities of ozone and nitric acid. Finally, the magni-tude of land-cover effects related to climate change on dry deposition velocities by 2050 is discussed.
2 Modeling setup
In our study, the global chemistry–climate model LMDz-INCA (Hauglustaine et al., 2004) is used to compute dry deposition. LMDz (v4) is an atmospheric general circula-tion model that simulates the transport of trace species. The model is run with 19 hybrid levels from the surface to 3 hPa at a horizontal resolution of 1.85◦in latitude and 3.75◦in longi-tude. It is coupled online to the chemistry and aerosols model INCA (v2) which computes concentrations of reactive trac-ers considering their emissions, chemical transformations, transport and deposition processes. The atmospheric oxida-tion reacoxida-tions of CH4, CO and non-methane hydrocarbons are documented in Folberth et al. (2006). In order to be able to isolate the effect of land-cover change only on the at-mospheric chemical composition, through change in surface dry deposition, emissions are prescribed according to Lamar-que et al. (2010) for anthropogenic fluxes and Lathière et al. (2006) for biogenic volatile organic compounds, as de-scribed in Szopa et al. (2013), and are kept constant between all runs.
2.1 Dry deposition in LMDz-INCA
The chemical deposition scheme used in INCA is based on the parameterization of Wesely (1989) and Wesely and Hicks (2000), computing dry deposition velocity Vdas a suc-cession of resistances as follows:
|Vd(z)| = [Ra(z) + Rb+Rc]−1,
where Rais the aerodynamic resistance, Rbthe quasi-laminar resistance and Rcthe bulk surface resistance.
Radetermines the ability of the airflow to bring gases or particles close to the surface and depends mainly on the at-mospheric turbulence structure and on the height considered. In this paper, we will focus on dry deposition at the surface ground level (z = 0). Rbdescribes the resistance to the trans-fer very close to the surface and is driven by the surface (sur-face roughness) and the gas or particle (molecular diffusiv-ity) characteristics. Raand Rbare calculated based on Wal-cek et al. (1986). The surface resistance Rc represents the different pathways through which the gas or particles can de-posit and is determined by the affinity of the surface for the chemical compound. Deposition can thus occurs directly on the ground and/or, in the case of vegetative surfaces, on the different vertical layers of the canopy on trunks, branches and mainly on leaves, through stomata or cuticles (Wesely, 1989). Vegetation surfaces in particular cover a large area of the Earth, with a high spatial and seasonal variability due to species diversity. Environmental conditions such as at-mospheric CO2, pollutant (ozone) concentrations, radiation, temperature or the occurrence of possible stress (drought for instance) can strongly affect the vegetation functioning, and the stomatal opening especially, and therefore impact dry de-position velocity. The impact of vegetation type, distribution
and functioning on dry deposition is still not well understood and generally very simply, if at all, considered in chemistry-transport models (Hardacre et al., 2015). For all chemical species considered in LMDz-INCA, Rcis based on their tem-perature dependent Henry’s Law effective coefficient and re-activity factor for the oxidation of biological substances (Fol-berth et al., 2006). The coefficients for Henry’s Law are taken from Sander (1999) and reactivity factors are taken from We-sely (1989) and Walmsley and WeWe-sely (1996).
The dry deposition scheme implemented in LMDz-INCA considers eleven surface categories: (1) urban land, (2) agri-cultural land, (3) range land, (4) deciduous forest, (5) conif-erous forest, (6) mixed forest including wetland, (7) water, both salt and fresh, (8) barren land, mostly desert, (9) non-forested wetland, (10) mixed agricultural and range land and (11) rock open areas with low-growing shrubs. This scheme was originally developed by Wesely (1989) and updated by Wesely and Hicks (2000) for northern hemispheric regions of the USA and southern Canada. Five seasonal categories are used as proxy of vegetation growth stage (midsummer with lush vegetation; autumn with unharvested cropland; late au-tumn after frost, no snow; winter, snow on ground, and sub-freezing; transitional spring with partially green short annu-als). For global-scale study purposes, the scheme in LMDz-INCA has been modified in order to represent the different seasonal cycles throughout the world. The latitude depen-dency of the vegetation seasonality is described by dividing the globe into three belts: northern hemispheric regions (lat-itude > 33◦N), tropical regions (33◦S < latitude < 33◦N) and southern hemispheric regions (latitude < 33◦S). Summer is considered in the tropics throughout the whole year, describ-ing the evergreen vegetation. Two opposite seasonal cycles are taken into account in extra-tropical northern and south-ern hemispheric regions, with winter being activated when snow falls. The deposition of atmospheric compounds on plant leaves, through stomata especially, is determined fol-lowing the Wesely (1989) approach. The stomatal resistance depends on vegetation type, seasonal category, radiation and temperature, but the potential impact of other environmen-tal conditions such as drought, or atmospheric concentration of CO2or ozone, is not considered. The dry deposition ve-locity over each grid box is eventually determined by sum-ming deposition velocities computed over every land-cover types, weighted by their respective fractional surface cover-age (ranging from 0 to 1).
The deposition velocities computed by LMDz-INCA based on a different land-cover distribution was evaluated in Hauglustaine et al. (2004). This work illustrates values gener-ally consistent with typical deposition velocities highlighted for North America and Europe as presented in Wesely and Hicks (2000) and monthly values reaching up to 0.6 cm s−1 for ozone and up to 3 cm s−1for HNO3over land. In the sup-plementary material the ozone dry deposited fluxes simulated by LMDz-INCA in the present-day simulation and used in
Figure 2. Surface categories considered in LMDz-INCA for dry deposition, represented as dominant coverage: agricultural land, range land,
deciduous forest, coniferous forest, water, barren land and mostly desert. Regions discussed in this study are also illustrated: Eurasia, USA, Central America, tropical South America, South America, tropical Africa, southern Africa, western Australia, eastern Australia and tropical regions.
this study are compared to other global model and long-term measurements which are discussed in Hardacre et al. (2015).
2.2 Land-use and land-cover changes between 2007 and 2050
The present-day distribution of vegetation categories con-sidered in LMDz-INCA is illustrated in Fig. 2 as dominant type, covering the largest fraction of each grid box. Crops are dominant mainly in restricted temperate regions of North America, central Europe and also in India, while range lands are largely spread. Deciduous forests dominate in tropical re-gions of South America, Africa and Indonesia, together with central and southern Europe, while coniferous forests have a high occupancy in boreal regions of North America and Eurasia. Figure 2 also shows the 10 regions of special inter-est selected for this study, which will be considered in more detail when analyzing our results.
Future maps are based on scenarios of land-cover changes derived from four different RCPs (Moss et al., 2010; van Vu-uren et al., 2011) and four integrated assessment models (one per RCP) (RCP 8.5, RCP 4.5 and RCP 2.6). Those maps were further harmonized to ensure smooth transitions with past/historical changes (Hurtt et al., 2011). Those data sets only provide information on human activities (crop land and grazed pastureland) in each grid cell (at a 0.5◦ resolution) but do not provide any recommendation regarding the dis-tribution of natural vegetation. We have therefore combined them with our original present-day land-cover map (Love-land et al., 2000), which already includes both natural and
an-thropogenic vegetation types, following a methodology de-scribed in Dufresne et al. (2013).
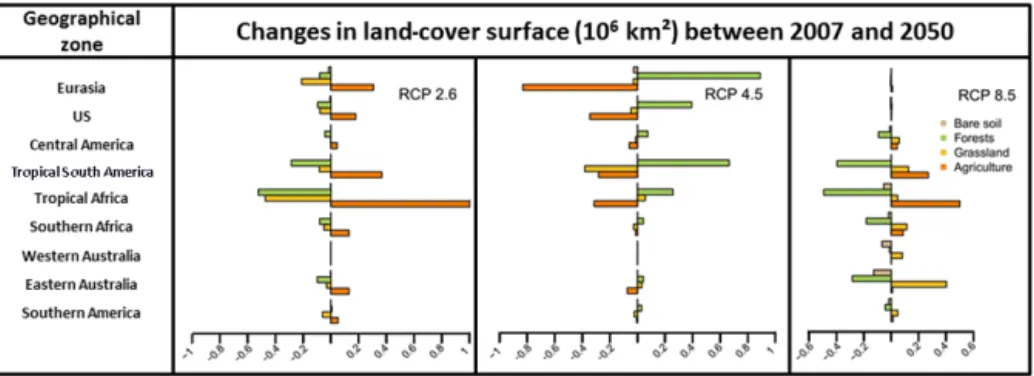
Figure 3 illustrates changes in vegetation fraction for agri-culture and grasslands on one hand, and for forests on the other hand, between present-day (distribution for 2007) and the future RCP scenarios. For most affected regions, the changes in land surfaces are presented in Fig. 4. The RCP 4.5 scenario shows the largest surface change with a total of 20.8×10⁶km2, representing 10.4 % of the 70◦S–70◦N Earth continental surface. According to the RCP 2.6 and RCP 8.5 scenarios only 15–16.8 × 10⁶km2 of land-cover surfaces is converted.
The RCP 2.6 scenario is characterized by a moderate in-crease of energy consumption throughout the 21st century together with a decrease in oil consumption. The energy sup-ply is thus partly ensured by bioenergy production increase (van Vuuren et al., 2011). Such hypotheses lead to a strong expansion of agricultural lands (+2.61 × 10⁶km2globally) at the expense of forests (−1.40 × 10⁶km2) and grasslands (−1.15 × 10⁶km2) targeting mainly Eurasia, USA and trop-ical South America.
The RCP 8.5 scenario, characterized by the strongest increase in population and energy consumption (amongst RCPs), assumes a large increase in global population until 2050. The resulting demand for food leads to a strong ex-pansion of land used for crops and pastures at the expense of forests. The tropical belt (from 30◦N to 30◦S) under-goes the largest changes: tropical forests in South America and southern Africa are partially harvested (1.0 × 10⁶km2 totally, i.e., 13 % of their 2007 extent) and replaced by grass-land and crops, while in eastern Australia, forests lose 7 %
Figure 3. Vegetation fraction difference between 2050 and the present day for crops and grasses (left column) and forests (right column)
according to the future RCP scenarios 2.6 (upper line), 4.5 (middle line) and 8.5 (lower line).
Table 1. Simulations performed in our study with the LMDz-INCA chemistry–climate model: setup description.
Run objectives Land-cover map Climate Duration
Control Present-day 2000s Winds and surface temperature nudged 1 year
on ECMWF fields for 2007
Impact of future land-use changes 2050 RCP 8.5 Winds and surface temperature 1 year
2050 RCP 4.5 nudged on ECMWF
2050 RCP 2.6 fields for 2007
Impact of future climate Present-day 2000s 2000–2010 fields (GCM mode) 10 years
Figure 4. Changes between 2007 and 2050 in land-type surfaces (106km2) for the nine regions as illustrated in Fig. 1, in the case of forests (green), crops (orange), grasses (yellow) and bare soil (brown).
(−0.28 × 10⁶km2) of their 2007 area and are replaced by grasslands which gain 0.12 × 10⁶km2on desert.
The “mitigation” RCP 4.5 scenario is a rather contrast-ing scenario as it proposes a strong increase in the cover of all forest categories, a small expansion of grasslands but an important recession of agricultural surfaces mainly in devel-oped countries. Indeed Eurasia, USA and Canada undergo a strong conversion from agriculture and grassland to forests with a magnitude change of ∼ 0.8 × 10⁶km2in Eurasia and
∼0.4×10⁶km2in northern USA and Canada. Besides, trop-ical South America loses 0.55 × 10⁶km2of cumulated crop-lands and grasscrop-lands but forests expand by the same surface between present day and 2050.
Finally, it is important to underline that the three RCP sce-narios offer a wide variety of land-cover change projections. They all are quite different compared to previous scenarios, such as the SRES-A2 investigated by Ganzeveld et al. (2010), characterized by a strong north/south contrast, with the trop-ical and southern hemispheric countries mainly encountering deforestation whereas northern areas (> 35◦N) were mainly projected to see afforestation.
2.3 Simulation strategy
In order to quantify the effects of these land-cover changes on surface dry deposition, we carried out two sets of simula-tions (Table 1). The first set isolates the effect of future possi-ble land-cover changes on dry deposition without any climate change. It includes one control run (present day), using 2006 vegetation distribution (Fig. 2) and three future runs using the 2050 vegetation maps according to the RCPs 8.5, 4.5 and 2.6 scenarios. The same present-day meteorology, biogenic and anthropogenic emissions are used in these four simulations. These simulations are run for 1 year with wind and tempera-ture fields being relaxed towards the ECMWF ERA-Interim reanalysis (Dee et al., 2011) with a time constant of 6 h.
Then a second set of two simulations is performed in or-der to investigate the effect of future climate change on de-position and compare it with the impact of future land-cover change: one run for the 2000–2010 period and a second run
for the 2045–2055 period. Those simulations are performed without nudging and the LMDz general circulation model requires sea surface temperature (SST), solar constant and long-lived greenhouse gases (LL-GHG) global-mean con-centrations as forcings. For historical simulations, we use the HADiSST for SST (Rayner et al., 2003) and the evolution of LL-GHG concentrations compiled in the AR4-IPCC report. For future projections, we use the SST from IPSL-CM4 sim-ulation for the SRES-A2 scenario, which induce similar cli-mate trajectories in terms of radiative forcing than RCP 8.5. We use the LL-GHG concentrations distributed by the RCP database for RCP 8.5 projection for the 2045–2055 period. Eleven years are run and averaged to allow smoothing of in-terannual climate variability. The mean surface temperature change is 0.93◦C between future simulation and present-day simulation. Both experiments use the same present-day veg-etation distribution, anthropogenic and biogenic emissions.
3 Results
3.1 Present-day ozone and nitric acid deposition
First of all, we present the deposition over continental re-gions for present-day conditions (Fig. 5) by illustrating the annual means of deposition velocities at the surface, surface concentrations and deposited fluxes for O3and HNO3.
The highest ozone deposition velocities (> 0.35 cm s−1) are simulated over India, Southeast Asia, western coast and center of South America, Mexico, Europe and sub-Saharan Africa and Australia. Hence, those areas are mainly covered by crops and grasses, where the high-est Vd,O3 occurs, while Europe and Southeast Asia are
mainly covered by deciduous forests, with therefore lower annual Vd,O3. O3 surface dry deposition is indeed
max-imal over small canopies vegetation and minmax-imal over bare soil with deposition affinity ranging from agriculture > grasslands > deciduous > coniferous > bare soil (see sensi-tivity tests in the Supplement).
Figure 5. Annual average of surface dry deposition velocities (upper panel) and surface concentrations (middle panel and deposition fluxes
(lower panel) over continental surfaces (cm s−1) for O3(left) and HNO3(right) for the present day as simulated by LMDz-INCA.
Temperate regions see ozone deposition velocities sig-nificantly reduced in winter (see Supplement for seasonal means) whereas tropical regions, covered mainly by small canopies, are characterized by surface deposition velocity ex-ceeding 0.35 cm s−1 throughout the whole year due to the lack of seasonality in the vegetation phenology in the global model. In temperate regions of the Northern Hemisphere, the highest deposition velocities for ozone reach values of 0.4 to 0.6 cm s−1for Vd,O3 over Europe.
For HNO3, the annual-mean deposition velocities are maximum over Brazil, western Europe, India, Indochinese Peninsula and southwestern Africa (> 1.6 cm s−1 in annual mean). Vd,HNO3 reaches maximum values over deciduous
and coniferous forests due to deposition affinity ranking from deciduous and coniferous > agriculture > grasslands > bare soil. This is due to the strong dependency of Vd,HNO3 on
surface roughness (Walcek et al., 1986). For the temperate region and southern Asia, the HNO3deposition is strongly affected by the vegetation cycle with maximum in July be-tween 2.5 and 3.5 cm s−1. This is remarkable over
temper-ate and boreal forests. In the tropics, Amazonian forest en-counters high HNO3deposition velocity in winter whereas deposition velocity over African equatorial forest is lim-ited throughout the whole year (see Supplement for sea-sonal means of deposition). Large areas receive high HNO3 deposition fluxes exceeding 0.5 g (N) m−2yr−1 in annual mean: northeastern USA, western Europe and eastern Asia. These areas correspond to the ones identified by Dentener et al. (2006), in which natural vegetation encounters nitro-gen deposition higher than the “critical load” threshold of 1 g (N) m−2yr−1.
The repartition of deposited fluxes is strongly affected by the large variability of atmospheric concentrations of ozone and nitric acid in the surface layer. For both O3and HNO3, the deposited fluxes are maximum over south and eastern Asia and eastern North America and central and western Europe. For ozone, the maximum in winter is over central Africa whereas in summer the ozone deposition is maximum over central Europe and eastern USA. For HNO3, the de-posited flux repartition is equally driven by the deposition
Figure 6. Annual-mean changes (in relative value %) of surface dry deposition velocity for O3between the present day and 2050 induced
by the different LCC (left) and related surface ozone concentrations (right) for the three RCP scenarios. Values in the [−1; +1] % interval are not shown.
velocity and by the HNO3 surface concentration distribu-tion. In winter, HNO3 is maximally deposited over eastern USA, central Africa, central Europe, India and eastern Asia. In summer, regions are the same in the Northern Hemisphere but the extension of deposited HNO3areas is higher and the deposition in Africa is weak, due to weak HNO3 concentra-tion.
3.2 Impact of 2050–2007 land-cover changes on surface dry deposition velocities
We then analyze the changes in surface dry deposition ve-locities between present day and 2050 induced only by land-cover change. Four regions undergo interesting land-land-cover changes in terms of intensity or contrast between scenar-ios: Eurasia, North America, tropical Africa and Australia. The left columns of Figs. 6 and 7 show the relative differ-ence in surface dry deposition velocities distribution for O3 and HNO3, resulting from the changes in vegetation distribu-tion between 2007 and 2050 for the three RCP scenarios. We
shall first describe the two scenarios projecting weak land-cover changes for 2050s: RCP 8.5 and RCP 2.6. In the RCP 8.5 scenario, one main land-cover change is the expansion of agricultural land at the expenses of forests. According to this scenario, over tropical Africa the maximal land-cover change occurs locally with fraction of deciduous forests de-creasing by up to 0.2 while cropland fraction increases by up to 0.2 in the same region. This induces a rise by up to 7 % (+0.02 cm s−1) in Vd,O3 and a decrease of 0.06 cm s
−1 in Vd,HNO3 relative to the present-day values in this area.
These order of magnitude and sign of changes are consistent with sensitivity tests in which we replaced totally forests by croplands inducing an increase of 0.1 cm s−1in Vd,O3 and a
decrease of 0.5 cm s−1in Vd,HNO3 (during summer and
win-ter). The strongest LCC occurs in Australia (−0.12 in for-est fraction and +0.2 in grassland fraction in eastern Aus-tralian regions), which induces a local maximum increase of 18 % (+0.05 cm s−1) in Vd,O3 and a maximum decrease of
15 % in Vd,HNO3 (−0.1 cm s
Figure 7. Same as Fig. 6 for HNO3.
magnitude in changes induced by land-cover change in west-ern Australia but with a different sign for Vd,HNO3 changes
(+0.1 cm s−1; +9 %), due to a different type of shift in sur-face covering (+0.12 in grassland fraction, −0.10 for desert). As land-cover changes are weak in the RCP 2.6 scenario, a more dispersed and weaker effect on surface dry deposi-tion velocities is simulated (maximum absolute difference of 10 %).
According to the RCP 4.5 scenario, the most dramatic land-cover change occurs in Eurasia where local maximum changes by up to 0.5 in fraction of vegetation are projected, involving in most cases an increase in forest surfaces at the expense of agricultural areas. This increases Vd,HNO3 by up
to 20 % (annual-mean value) and reduces Vd,O3 by the same
magnitude in this region. The LCC impacts are stronger by a factor 4–6 in summer both on O3 and HNO3 deposi-tion velocities. This difference in deposideposi-tion velocities be-tween winter and summer were highlighted in sensitivity tests which see a strong decrease in Vd,O3 during the June–
August period (up to 0.15 cm s−1in absolute) and a strong in-crease in Vd,HNO3 (up to 1.5 cm s
−1) underlining a total
con-version of croplands to forests. This is due to a higher surface roughness which enhances the deposition velocity of HNO3 (via the reduction of the aerodynamic resistance). However, the higher input surface resistance (prescribed in the model and variable relating to season indexes) reduces Vd,O3 even
combined to a warmer climate which decreases the stomatal resistance (Rs).
3.3 Impact on atmospheric composition
The objective of this part is to isolate the effects of dry depo-sition changes due to land-cover changes on the tropospheric concentration of O3and HNO3. Therefore, solely the impact of land-cover changes on deposition at the surface is con-sidered between the present-day and 2050 simulations. This impact on surface concentrations of O3and HNO3is shown in the right columns of Figs. 6 and 7.
For both the RCP 8.5 and RCP 2.6 scenarios, the LCC effects through deposition are lower than 1 ppb on annual-mean surface ozone concentrations. In term of relative differ-ence, only the reduction of ozone over Australia when
con-Figure 8. Future climate-induced impacts on surface dry deposition velocities (%) considering a 0.93◦C increase of global temperature.
sidering RCP 8.5 hypotheses exceeds 1 %, reaching up to 5 % at some points. The impact on HNO3surface concentrations is more disparate between the two scenarios when consider-ing the spatial repartition of effects. The RCP 8.5 scenario leads to a local increase of HNO3 due to the reduction in the deposition velocity. This HNO3increase is notable over Mexico, Brazil, western and southern Africa (comprised in the 1–6 % interval). Land-cover change in Australia leads to an increase exceeding 7 % in the east and a decrease reaching 5 % in the west.
The RCP 4.5 scenario induces the strongest impacts on deposition velocity with a reduction of Vd,O3(−0.08 cm s
−1) occurring in Eurasia due a strong reduction in croplands oc-cupancy (−0.6 in fraction of coverage) and a strong increase in forest distribution (+0.6 in fraction of coverage) between 2007 and 2050. It induces a significant increase of the surface O3concentration reaching locally by up to 5 ppb (+5 %) on average during the June–August period. This scenario also induces an increase of the HNO3deposition flux exceeding locally 10 % for monthly values in Eurasia and eastern North America. It thus leads to a reduction in the HNO3 concentra-tion by 0.2 ppbv in Eurasia (−13 %) and in North America (−8 %), mainly due to changes in nitric acid velocities of
+0.5 and +0.2 cm s−1, respectively.
3.4 Are the land-cover-induced changes significant compared with the climate change impact?
The impact of land-use changes on deposition can be com-pared to that of climate when discussing their respective strength on deposition velocities. To this purpose, we con-sider a 0.93◦C increase of global temperature, correspond-ing to the temperature increase projected in the RCP scenar-ios between the beginning and the middle of the 21st century. Figure 8 shows the impact of this climate change on the de-position velocity for O3and HNO3. We see that the strongest increase in surface dry deposition velocities over lands oc-curs in the Northern Hemisphere during winter, especially in Eurasia (+50 % (+0.07 cm s−1) for Vd,O3 and +100 %
(+0.9 cm s−1) for Vd,HNO3). The climate effect on the
de-position velocity by affecting stomatal resistance, sensitive
to surface temperature and solar irradiance, can locally reach values far more important than the LCC. Table 2 presents the effects of land-cover change considering RCP 4.5 projection and climate change on deposition velocity averaged over 10 regions for O3 and HNO3. In several regions, the effect of land-cover change is of the same order of magnitude than the one of climate. The modification in land-cover affecta-tion can thus amplify the climate change effect or, when the sign is the opposite, counterbalances it.
4 Discussion and conclusions
Using the RCP 2.6, 4.5 and 8.6 scenarios for land-use change between the 2000s and 2050s, simulations were carried out with the global chemistry-transport model LMDz-INCA in order to assess the impact of changes in vegetation distri-bution on the dry deposition of ozone and nitric acid at the surface and on atmospheric composition.
Regarding vegetation distribution, the largest change at the global scale is given in the RCP 4.5 scenario (20.8 × 10⁶km2), with surface converted being 28 and 19 % lower in the RCP 2.6 and RCP 8.5 scenarios, respectively. Projections show major changes in the Northern Hemisphere in the case of RCP 4.5 scenario, while Australia and Africa are mostly affected in the RCP 8.5 scenario.
With vegetation type and surface being key drivers of sur-face dry deposition, any change in vegetation distribution can potentially affect dry deposition velocity and therefore atmospheric chemical composition. Considering the 2050 RCP 8.5, vegetation distribution leads to a rise by up to 7 % (+0.02 cm s−1) in V
d,O3 and a decrease of 0.06 cm s
−1 in
Vd,HNO3 relative to the present-day values in tropical Africa
and up to +18 and −15 %, respectively, in Australia. As land-cover changes are weak in the RCP 2.6 scenario, a more dispersed and weaker effect on surface dry deposi-tion velocities is simulated (maximum absolute difference of 10 %) when considering the RCP 2.6 scenario, characterized by a moderate change in vegetation distribution compared to present day. When taking into account the RCP 4.5 sce-nario, which shows dramatic land-cover change in Eurasia,
Table 2. Mean effect on annual-mean surface deposition velocity (%) of climate and land-cover changes of O3and HNO3averaged over homogeneous regions (values > ± 1.5 % are highlighted).
Ozone Nitric acid
Climate RCP 4.5 land Sum of climate and Climate RCP 4.5 land Sum of climate and
change cover change land-cover changes change cover change land-cover changes
Global 0.5 −0.7 −0.2 2.2 1.2 3.4
Eurasia 2.1 −2.1 0.0 4.3 3.8 8.1
USA 1.5 −1.3 0.2 3.6 2.0 5.6
Central America −1.1 −1.4 −2.6 1.1 1.7 2.8
Tropical South America −2.3 −1.2 −3.5 1.1 2.6 3.7
Tropical Africa −1.5 −0.8 −2.3 0.4 0.9 1.3 South Africa −1.4 −0.6 −2.0 −0.1 0.8 0.8 Western Australia −0.4 −0.1 −0.5 −0.4 0.0 −0.4 Eastern Australia −0.5 −0.6 −1.1 0.2 0.5 0.7 South America 0.4 −0.7 −0.4 0.3 2.0 2.3 Tropics −1.1 −0.6 −1.7 0.6 1.0 1.7
Vd,HNO3increases by up to 20 % (annual-mean value) and
re-duces Vd,O3 by the same magnitude in this region. When
an-alyzing the impact of dry deposition change on atmospheric chemical composition, our model calculates that the effect is lower than 1 ppb at the grid-box scale on annual-mean sur-face ozone concentration for both of the RCP 8.5 and RCP 2.6 scenarios. The impact on HNO3 surface concentrations is more disparate between the two scenarios, regarding the spatial repartition of effects. In the case of the RCP 4.5 sce-nario, a significant increase of the surface O3concentration reaching locally up to 5 ppb (+5 %) is calculated on average during the June–August period. This scenario also induces an increase of HNO3deposited flux exceeding locally 10 % for monthly values. Investigating the impact of climate change, considering a 0.93◦C increase of global temperature, on sur-face dry deposition velocities, we calculate that the strongest increase over lands occurs in the Northern Hemisphere dur-ing winter, especially in Eurasia (+50 % (+0.07 cm s−1) for
Vd,O3 and +100 % (+0.9 cm s
−1) for V
d,HNO3). The climate
change impact on deposition is characterized by a latitudi-nal gradient, while the effect of land-cover change is much more heterogeneous. Both climate and vegetation distribu-tion changes are of similar amplitude but sign can differ.
The objective of study is to isolate the impact of land-cover change on atmospheric chemical composition through modi-fication of surface dry deposition only rather than to consider comprehensively all the atmospheric chemistry/vegetation interactions affected by land-cover change. Indeed, as far as long-term evolution of atmospheric chemistry is investi-gated (e.g., Stevenson et al., 2006; Lamarque et al., 2010), the evolution of biogenic emissions due to global changes is discussed, if not shared between models, but the land-cover maps used for dry deposition remain unchanged. Here we want to assess the importance of this choice. Land-cover changes would go together with changes in surface
emissions, either from anthropogenic, agricultural or bio-genic sources, with changes in climate and possible strong consequences on the atmospheric chemical mechanism and surface–atmosphere interactions. In an attempt to quantify all the effects of land-cover change, those processes would therefore need to be considered altogether to get a better pic-ture of the overall resulting effect. However, they all have large uncertainties and, added to error compensation effects, the dry deposition change can be can masked by other pro-cess changed (see for example Wu et al., 2012). Moreover, the sensitivity of biogenic emissions to climate and CO2 changes as well as the level of coupling between vegetation and chemistry are so different from one model to another that the full land-cover change response is for the moment highly model dependent.
Fowler et al. (2009) underline an uncertainty of about 50 % in the ability of models to estimate dry deposition fluxes for main chemical species, the lack of measurements making a proper and extensive model evaluation especially difficult. Hardacre et al. (2015), who compared the dry deposition of ozone of 15 global atmospheric chemistry-transport models with measurements in Europe and North America, underline discrepancies of up to a factor of 2, notably in the summer maximum, but do not find a systematic model bias. Dry de-position in global models is still largely based on the in-series resistance approach proposed by Wesely (1989) and gener-ally does not integrate more recent findings demonstrated by field or laboratory studies (Hardacre et al., 2015).
Vegetation is usually crudely described in chemistry-transport models, with leaf surface or cuticle and stom-atal resistances for instance being prescribed or very sim-ply parameterized and a lack of the representation of sea-sonal variation or stress (water, temperature) impacts. This could lead to significant uncertainty in model representation and projections of atmospheric chemical composition and
surface–atmosphere interactions. The work by Wesely and Hicks (2000) underlines that selecting proper input param-eters for dry deposition schemes, such as stomatal, cuticle and soil resistances, is crucial for a satisfactory determina-tion of dry deposidetermina-tion efficiency for both simple and multi-layers models. Zhang et al. (2003) propose a revised param-eterization of dry deposition including the leaf area index in the calculation of aerodynamic and cuticular resistances, which could give the possibility of a better representation of the impact of vegetation seasonality in dry deposition esti-mates. The roles of surface wetness, soil moisture and the partition between stomatal and non-stomatal uptake (shown of high importance for dry deposition processes) are usu-ally not implemented or poorly described in global models (Fowler et al., 2009; Hardacre et al., 2015). This is also the case of the LMDz-INCA model in which dry deposition is described through a highly parameterized approach. Investi-gating ozone non-stomatal uptake using measurements over five different vegetation types, Zhang et al. (2002a) show that the O3uptake by cuticles is affected by friction velocity, rela-tive humidity, canopy wetness and leaf area index especially and tends to increase with wetness and high humidity. A new parameterization for non-stomatal uptake is proposed and is expected to improve this deposition path in existing mod-els, where a constant value is often considered, and could therefore be tested more largely in global models. Investi-gating the impact of coupling dry deposition to vegetation phenology in the Community Earth System Model (CESM) on ozone surface simulation, Val Martin et al. (2014) show the importance of representing the dependence of dry de-position to vegetation parameters including drivers of stom-atal resistance variation (change in CO2, drought stress), especially when focusing on the impact of past or future changes of vegetation. Hardacre et al. (2015) recommend providing more detailed diagnostics of O3 dry deposition in next model intercomparison exercices to attribute the dif-ferences between models to methodology and/or representa-tion of processes. The next generarepresenta-tion of chemistry-transport models should therefore rely on online coupling with vegeta-tion, with dry deposition schemes having a consistent and dynamic description of vegetation distribution and growth and related short-term (seasonal, annual variation) or long-term (past and future changes) evolutions. However, model intercomparisons focusing on each process considered in iso-lation with a proper shared methodology/setup is crucial if one wants to progress in the understanding of the complex vegetation/atmospheric chemistry interactions. In particular the evolution of land-cover maps should be considered as far as dry deposition is concerned in addition to emission changes in the next model intercomparison exercices aiming to project future atmospheric chemistry.
The Supplement related to this article is available online at doi:10.5194/acp-15-13555-2015-supplement.
Acknowledgements. We warmly thank Oliver Wild for useful
discussions on the model evaluation of dry deposition. Computer time was provided by the GENCI French supercomputing program. This research was supported by CNRS via the INSU-LEFE French program under the project BOTOX.
Edited by: T. Karl
References
Andersson, C. and Engardt, M.: European ozone in a fu-ture climate: Importance of changes in dry deposition and isoprene emissions, J. Geophys. Res.-Atmos., 115, D02303, doi:10.1029/2008JD011690, 2010.
Dee, D. P., Uppala, S. M., Simmons, A. J., Berrisford, P., Poli, P., Kobayashi, S., Andrae, U., Balmaseda, M. A., Balsamo, G., Bauer, P., Bechtold, P., Beljaars, A. C. M., van de Berg, L., Bid-lot, J., Bormann, N., Delsol, C., Dragani, R., Fuentes, M., Geer, A. J., Haimberger, L., Healy, S. B., Hersbach, H., Hólm, E. V., Isaksen, L., Kållberg, P., Köhler, M., Matricardi, M., McNally, A. P., Monge-Sanz, B. M., Morcrette, J.-J., Park, B.-K., Peubey, C., de Rosnay, P., Tavolato, C., Thépaut, J.-N., and Vitart, F.: The ERA-Interim reanalysis: configuration and performance of the data assimilation system, Q. J. Roy. Meteor. Soc., 137, 553–597, doi:10.1002/qj.828, 2011.
Dentener, F., Drevet, J., Lamarque, J. F., Bey, I., Eickhout, B., Fiore, A. M., Hauglustaine, D., Horowitz, L. W., Krol, M., Kul-shrestha, U. C., Lawrence, M., Galy-Lacaux, C., Rast, S., Shin-dell, D., Stevenson, D., Van Noije, T., Atherton, C., Bell, N, Bergman, D., Butler, T., Cofala, J., Collins, B., Doherty, R., Ellingsen, K., Galloway, J., Gauss, M., Montanaro, V., Müller, J. F., Pitari, G., Rodriguez, J., Sanderson, M., Solmon, F., Stra-han, S., Schultz, M., Sudo, K., Szopa, S., and Wild, O.: Ni-trogen and sulfur deposition on regional and global scales: A multimodel evaluation, Global Biogeochem. Cy., 20, GB4003, doi:10.1029/2005GB002672, 2006.
Dufresne, J.-L., Foujols, M.-A., Denvil, S., Caubel, A., Marti, O., Aumont, O., Balkanski, Y., Bekki, S., Bellenger, H., Benshila, R., Bony, S., Bopp, L., Braconnot, P., Brockmann, P., Cadule, P., Cheruy, F., Codron, F., Cozic, A., Cugnet, D., de Noblet, N., Duvel, J.-P., Ethé, C., Fairhead, L., Fichefet, T., Flavoni, S., Friedlingstein, P., Grandpeix, J.-Y., Guez, L., Guilyardi, E., Hauglustaine, D., Hourdin, F., Idelkadi, A., Ghattas, J., Jous-saume, S., Kageyama, M., Krinner, G., Labetoulle, S., Lahel-lec, A., Lefebvre, M.-P., Lefevre, F., Levy, C., Li, Z. X., Lloyd, J., Lott, F., Madec, G., Mancip, M., Marchand, M., Masson, S., Meurdesoif, Y., Mignot, J., Musat, I., Parouty, S., Polcher, J., Rio, C., Schulz, M., Swingedouw, D., Szopa, S., Talandier, C., Terray, P., Viovy, N., and Vuichard, N.: Climate change projections us-ing the IPSL-CM5 Earth System Model: from CMIP3 to CMIP5, Clim. Dynam., 40, 2123–2165, doi:10.1007/s00382-012-1636-1, 2013.
Folberth, G. A., Hauglustaine, D. A., Lathière, J., and Brocheton, F.: Interactive chemistry in the Laboratoire de Météorologie Dy-namique general circulation model: model description and im-pact analysis of biogenic hydrocarbons on tropospheric chem-istry, Atmos. Chem. Phys., 6, 2273–2319, doi:10.5194/acp-6-2273-2006, 2006.
Fowler, D., Pilegaard, K., Sutton, M. A., Ambus, P., Raivonen, M., Duyzer, J., Simpson, D., Fagerli, H., Fuzzi, S., Schjoerring, J. K., Granier, C., Neftel, A., Isaksen, I. S. A., Laj, P., Maione, M., Monks, P. S., Burkhardt, J., Daemmgen, U., Neirynck, J., Per-sonne, E., Wichink-Kruit, R., Butterbach-Bahl, K., Flechard, C., Tuovinen, J. P., Coyle, M., Gerosa, G., Loubet, B., Altimir, N., Gruenhage, L., Ammann, C., Cieslik, S., Paoletti, E., Mikkelsen, T. N., Ro-Poulsen, H., Cellier, P., Cape, J. N., Horvath, L., Loreto, F., Niinemets, U., Palmer, P. I., Rinne, J., Misztal, P., Nemitz, E., Nilsson, D., Pryor, S., Gallagher, M. W., Vesala, T., Skiba, U., Brueggemann, N., Zechmeister-Boltenstern, S., Williams, J., O’Dowd, C., Facchini, M. C., de Leeuw, G., Floss-man, A., Chaumerliac, N., and ErisFloss-man, J. W.: Atmospheric com-position change: Ecosystems-Atmosphere interactions, Atmos. Environ., 43, 5193–5267, doi:10.1016/j.atmosenv.2009.07.068, 2009.
Ganzeveld, L., Bouwman, L., Stehfest, E., Vuuren, D. P. V., Eick-hout, B., and Lelieveld, J.: Impact of future land use and land cover changes on atmospheric chemistry-climate interactions, J. Geophys. Res., 115, D23301, doi:10.1029/2010JD014041, 2010. Hardacre, C., Wild, O., and Emberson, L.: An evaluation of ozone dry deposition in global scale chemistry climate models, At-mos. Chem. Phys., 15, 6419–6436, doi:10.5194/acp-15-6419-2015, 2015.
Hauglustaine, D. A., Hourdin, F., Jourdain, L., Filiberti, M. A., Walters, S., Lamarque, J.-F., and Holland, E. A.: Interactive chemistry in the Laboratoire de Meteorologie Dynamique gen-eral circulation model: description and background tropospheric chemistry evaluation, J. Geophys. Res.-Atmos., 109, D04314, doi:10.1029/2003JD003957, 2004.
Hurtt, G. C., Chini, L. P., Frolking, S., Betts, R. A., Feddema, J., Fischer, G., Fisk, J. P., Hibbard, K., Houghton, R. A., Jane-tos, A., Jones, C. D., Kindermann, G., Kinoshita, T., Klein Gold-ewijk, K., Riahi, K. Shevliakova, E., Smith, S., Stehfest, E., Thomson, A., Thornton, P., van Vuuren, D. P., and Wang, Y. P.: Harmonization of land-use scenarios for the period 1500–2100: 600 years of global gridded annual land-use transitions, wood harvest, and resulting secondary lands, Climatic Change, 109, 117–161, doi:10.1007/s10584-011-0153-2, 2011.
Lamarque, J.-F., Bond, T. C., Eyring, V., Granier, C., Heil, A., Klimont, Z., Lee, D., Liousse, C., Mieville, A., Owen, B., Schultz, M. G., Shindell, D., Smith, S. J., Stehfest, E., Van Aar-denne, J., Cooper, O. R., Kainuma, M., Mahowald, N., Mc-Connell, J. R., Naik, V., Riahi, K., and van Vuuren, D. P.: His-torical (1850–2000) gridded anthropogenic and biomass burning emissions of reactive gases and aerosols: methodology and ap-plication, Atmos. Chem. Phys., 10, 7017–7039, doi:10.5194/acp-10-7017-2010, 2010.
Lamarque, J.-F., Dentener, F., McConnell, J., Ro, C.-U., Shaw, M., Vet, R., Bergmann, D., Cameron-Smith, P., Dalsoren, S., Doherty, R., Faluvegi, G., Ghan, S. J., Josse, B., Lee, Y. H., MacKenzie, I. A., Plummer, D., Shindell, D. T., Skeie, R. B., Stevenson, D. S., Strode, S., Zeng, G., Curran, M., Dahl-Jensen, D., Das, S., Fritzsche, D., and Nolan, M.: Multi-model mean ni-trogen and sulfur deposition from the Atmospheric Chemistry and Climate Model Intercomparison Project (ACCMIP): evalu-ation of historical and projected future changes, Atmos. Chem. Phys., 13, 7997–8018, doi:10.5194/acp-13-7997-2013, 2013.
Lathière, J., Hauglustaine, D. A., Friend, A. D., De Noblet-Ducoudré, N., Viovy, N., and Folberth, G. A.: Impact of climate variability and land use changes on global biogenic volatile or-ganic compound emissions, Atmos. Chem. Phys., 6, 2129–2146, doi:10.5194/acp-6-2129-2006, 2006.
Loveland, T. R., Reed, B. C., Brown, J. F., Ohlen, D. O., Zhu, Z., Yang, L., and Merchant, J. W.: Development of a global land cover characteristics database and IGBP DISCover from 1 km AVHRR data, Intern. J. Rem. Sens., 21, 1303–1330, 2000. Moss, R. H., Edmonds, J. A., Hibbard, K. A., Manning, M. R.,
Rose, S. K., van Vuuren, D. P., Carter, T. R., Emori, S., Kainuma, M., Kram, T., Meehl, G. A., Mitchell, J. F., Nakicen-ovic. N., Riahi, K., Smith, S. J., Stouffer, R. J., Thomson, A. M., Weyant, J. P., and Wilbanks, T. J.: The next generation of sce-narios for climate change research and assessment, Nature, 463, 747–756, doi:10.1038/nature08823, 2010.
Nowlan, C. R., Martin, R. V., Philip, S., Lamsal, L. N., Krotkov, N. A., Marais, E. A., Wang, S., and Zhang, Q.: Global dry deposition of nitrogen dioxide and sulfur dioxide inferred from space-based measurements, Global Biogeochem. Cy., 28, 1025–1043, doi:10.1002/2014GB004805, 2014.
Rayner, N. A., Parker, D. E., Horton, E. B., Folland, C. K., Alexan-der, L. V., Rowell, D. P., Kent, E. C., and Kaplan, A.: Global analyses of sea surface temperature, sea ice, and night marine air temperature since the late nineteenth century, J. Geophys. Res.-Atmos., 108, 2156–2202, doi:10.1029/2002JD002670, 2003. Sander, R.: Compilation of henry’s law constants for inorganic
and organic species of potential importance in environmental chemistry (version 3), http://www.henrys-law.org/henry-3.0.pdf, 1999.
Stevenson, D. S., Dentener, F. J., Schultz, M. G., Ellingsen, K., van Noije, T. P. C., Wild, O., Zeng, G., Amann, M., Ather-ton, C. S., Bell, N., Bergmann, D. J., Bey, I., Butler, T., Cofala, J., Collins, W. J., Derwent, R. G., Doherty, R. M., Drevet, J., Eskes, H. J., Fiore, A. M., Gauss, M., Hauglus-taine, D. A., Horowitz, L. W., Isaksen, I. S. A., Krol, M. C., Lamarque, J. F., Lawrence, M. G., Montanaro, V., Muller, J.-F., Pitari, G., Prather, M. J., Pyle, J. A., Rast, S., Rodriguez, J. M., Sanderson, M. G., Savage, N. H., Shindell, D. T., Strahan, S. E., Sudo, K., and Szopa, S.: Multimodel ensemble simulations of present-day and near-future tropospheric ozone, J. Geophys. Res.-Atmos., 111, D08301, doi:10.1029/2005JD006338, 2006. Szopa, S., Balkanski, Y., Schulz, M., Bekki, S., Cugnet, D.,
Fortems-Cheiney, A., Turquety, S., Cozic, A., Deandreis, C., Hauglustaine, D., Idelkadi, A., Lathière, J., Lefèvre, F., Marc-hand, M., Vuolo, R., Yan, N., and Dufresne, J.-L.: Aerosol and ozone changes as forcing for climate evolution between 1850 and 2100, Clim. Dynam., 40, 2223–2250, doi:10.1007/s00382-012-1408-y, 2013.
Val Martin, M., Heald, C. L., and Arnold, S. R.: Coupling dry depo-sition to vegetation phenology in the Community Earth System Model: implications for the simulation of surface O3, Geophys.
Res. Lett., 41, 2988–2996, doi:10.1002/2014GL059651, 2014. van Vuuren, D. P., Edmonds, J., Kainuma, M., Riahi, K.,
Thom-son, A., Hibbard, K., Hurtt, G. C., Kram, T., Krey, V., Lamarque, J.-F., Masui, T., Meinshausen, M., Nakicenovic, N., Smith, S. J., and Rose, S. K.: The representative concen-tration pathways: an overview, Climatic Change, 109, 5–31, doi:10.1007/s10584-011-0148-z, 2011.
Walcek, C. J., Brost, R. A., Chang, J. S., and Wesley, M. L.: SO2, sulfate and HNO3deposition velocities computed using regional
landuse and meteorological data, Atmos. Environ., 20, 949–964, 1986.
Walmsley, J. L. and Wesely, M. L.: Modification of coded parametrizations of surface resistances to gaseous dry deposition, Atmos. Environ., 30, 1181–1188, 1996.
Wesely, M. L.: Parameterization of surface resistances to gaseous dry deposition in regional-scale numerical models, Atmos. Envi-ron., 23, 1293–1304, doi:10.1016/0004-6981(89)90153-4, 1989. Wesely, M. L. and Hicks, B. B.: A review of the current status of knowledge on dry deposition, Atmos. Environ., 34, 2261–2282, doi:10.1016/S1352-2310(99)00467-7, 2000.
Wu, S., Mickley, L. J., Kaplan, J. O., and Jacob, D. J.: Impacts of changes in land use and land cover on atmospheric chemistry and air quality over the 21st century, Atmos. Chem. Phys., 12, 1597– 1609, doi:10.5194/acp-12-1597-2012, 2012.
Zhang, L. M., Brook, J. R., and Vet, R.: On ozone dry deposition – with emphasis on non-stomatal uptake and wet canopies, Atmos. Environ., 36, 4787–4799, doi:10.1016/S1352-2310(02)00567-8, 2002a.
Zhang, L. M., Moran, M. D., Makar, P. A., Brook, J. R., and Gong, S. L.: Modelling gaseous dry deposition in AURAMS: a unified regional air-quality modelling system, Atmos. Environ., 36, 537–560, doi:10.1016/S1352-2310(01)00447-2, 2002b. Zhang, L., Brook, J. R., and Vet, R.: A revised parameterization
for gaseous dry deposition in air-quality models, Atmos. Chem. Phys., 3, 2067–2082, doi:10.5194/acp-3-2067-2003, 2003.